
Published: February 8th, 2024
Since late January, the price of LINK has increased by more than 40%, surpassing industry titans such as Bitcoin, Ethereum, Solana, and Cardano by a significant margin.
The significant increase in LINK usage could come from the increased Cross Chain Interoperability Protocol (CCIP) of the network. This protocol enables secure cross-chain applications and streamlines asset transfers across diverse blockchain networks.
The protocol was recently incorporated with Ethereum, Avalanche (AVAX), the Base network, and the BNB chain. Following the integration of CCIP, users aim to have a secure and dependable method for transferring USDC across chains.
On the other hand, a firm disclosed substantial LINK withdrawals from exchanges in a tweet, emphasizing a suspicious whale who withdrew 2,745,815 LINK from 49 newly created wallets. Furthermore, four additional new wallets withdrew 119,583 LINK from Binance, valued at $2.15 million.
In addition, the firm identified whale "0x2A19," which withdrew $4 million worth of 494,957 LINK over the previous ten days. One of the prominent billionaires involved in recent exchange withdrawals is Justin Sun, the founder of Tron. On January 21st, he withdrew 61,249 LINK from Binance, valued at $957,000.
What do we expect from the Whale Activity? Let’s see the current price projection from the LINK/USDT technical analysis:
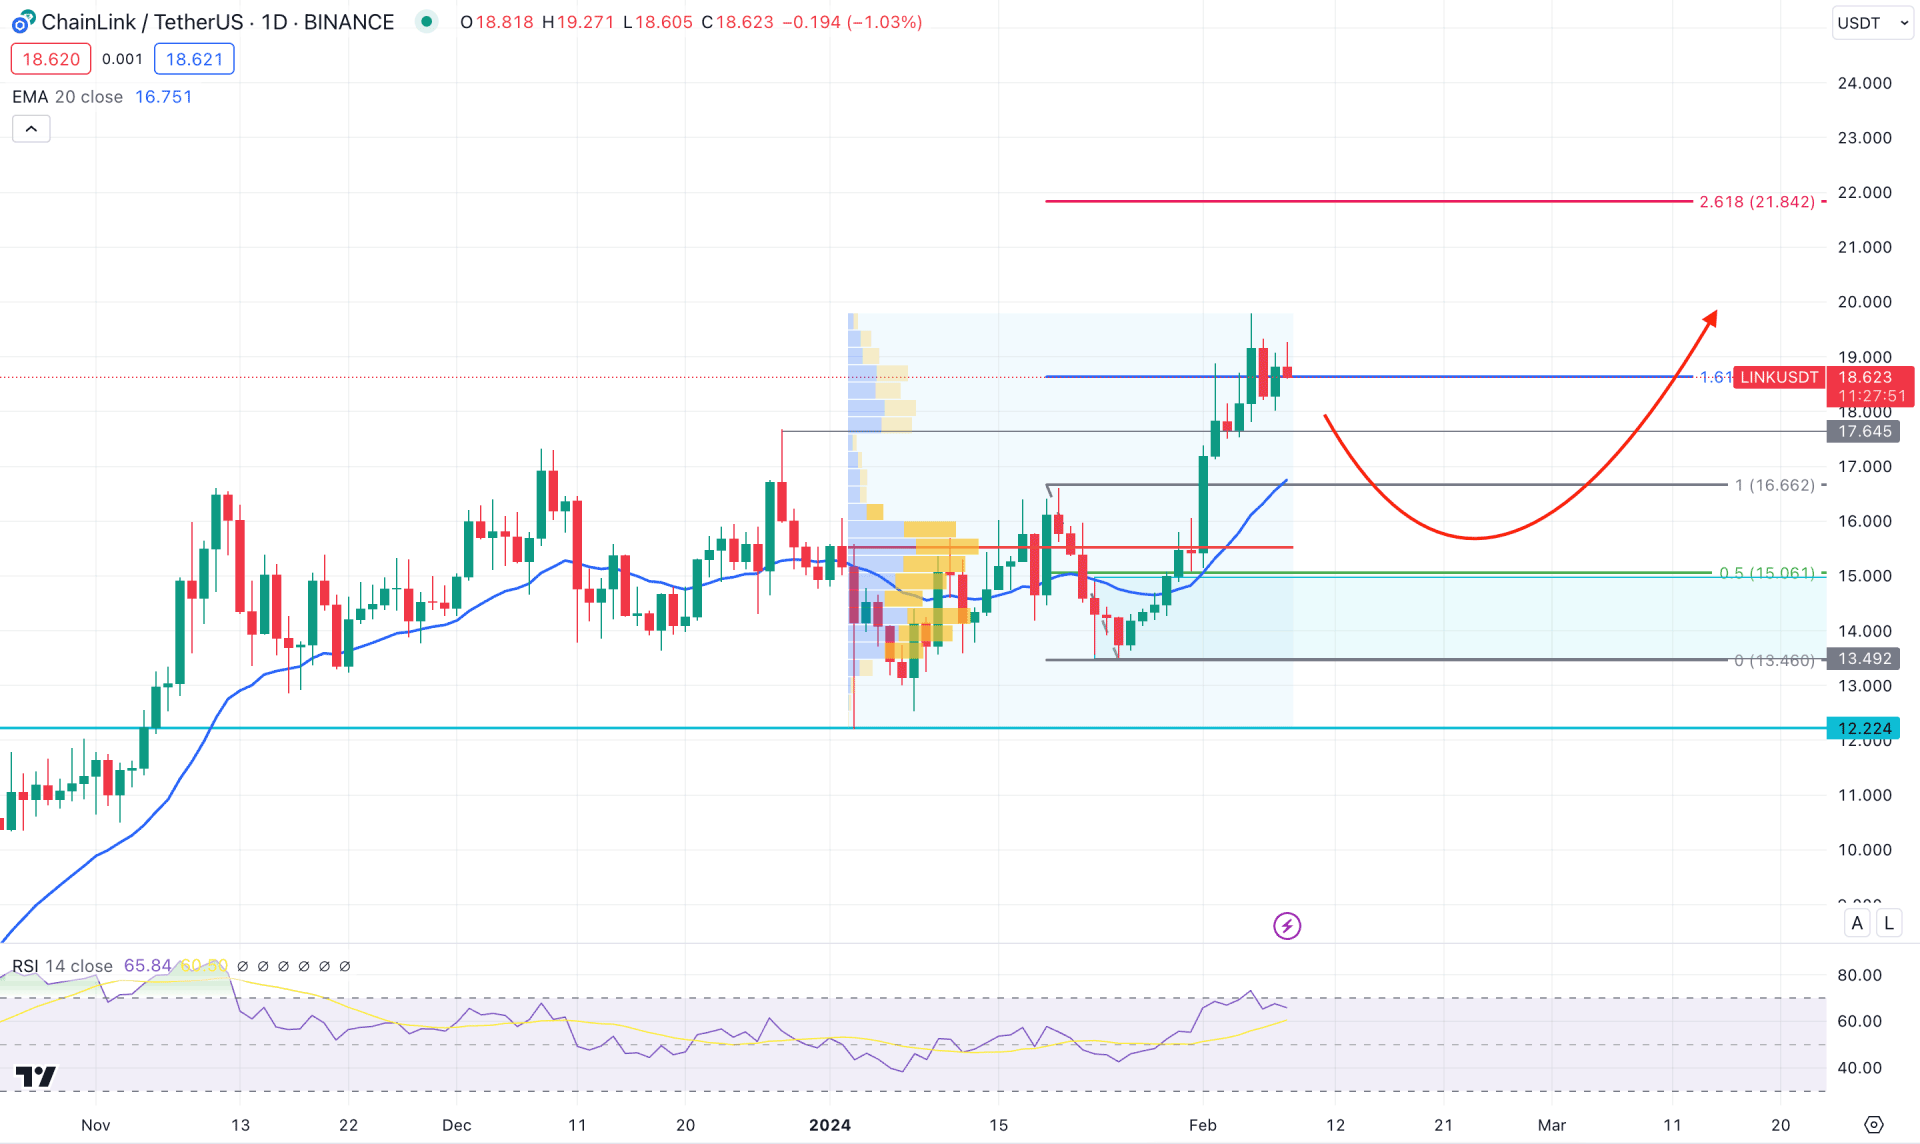
In the daily chart, a strong bull run is visible where the current price trades above the 2023 high with an impulsive wave. In this swing, the previous near-term high of 17.63 is broken with a bullish daily candle. In this context, a strong buying pressure is present, which needs closer attention before anticipating another bullish wave.
In the higher timeframe, the running candle of February already showed the highest monthly gain in the last six months. As this ongoing monthly gain came without a downside correction, it may result in a trend change at the monthly decease period. However, after a considerable downside correction, the weekly price shows a bullish wave, indicating enough liquidity grab.
Looking at the volume structure- the highest activity level since 1 January is at 15.51 level, which is writhin the previous range. It is a sign that sufficient buy orders are present within the 16.66 to 13.49 area, which could work as a possible buy zone in the coming days.
The near-term bullish order block is visible at the 15.00 to 13.49 area, which would be a valid buy zone depending on the price action. As the current price trades above the 20-day EMA, while the RSI is at the 60.00 area, we may expect an immediate bull run from the current rectangle resistance.
Moreover, the buying price found resistance at the 161.8% Fibonacci Extension level at the 18.63 area. Therefore, downside pressure with a daily candle below the 17.61 low could be a short-term bearish opportunity toward the 12.11 support.
On the bullish side, the first buy point would be the dynamic 20-day EMA from where a valid bullish rejection could increase the possibility of reaching the 21.84 resistance level.
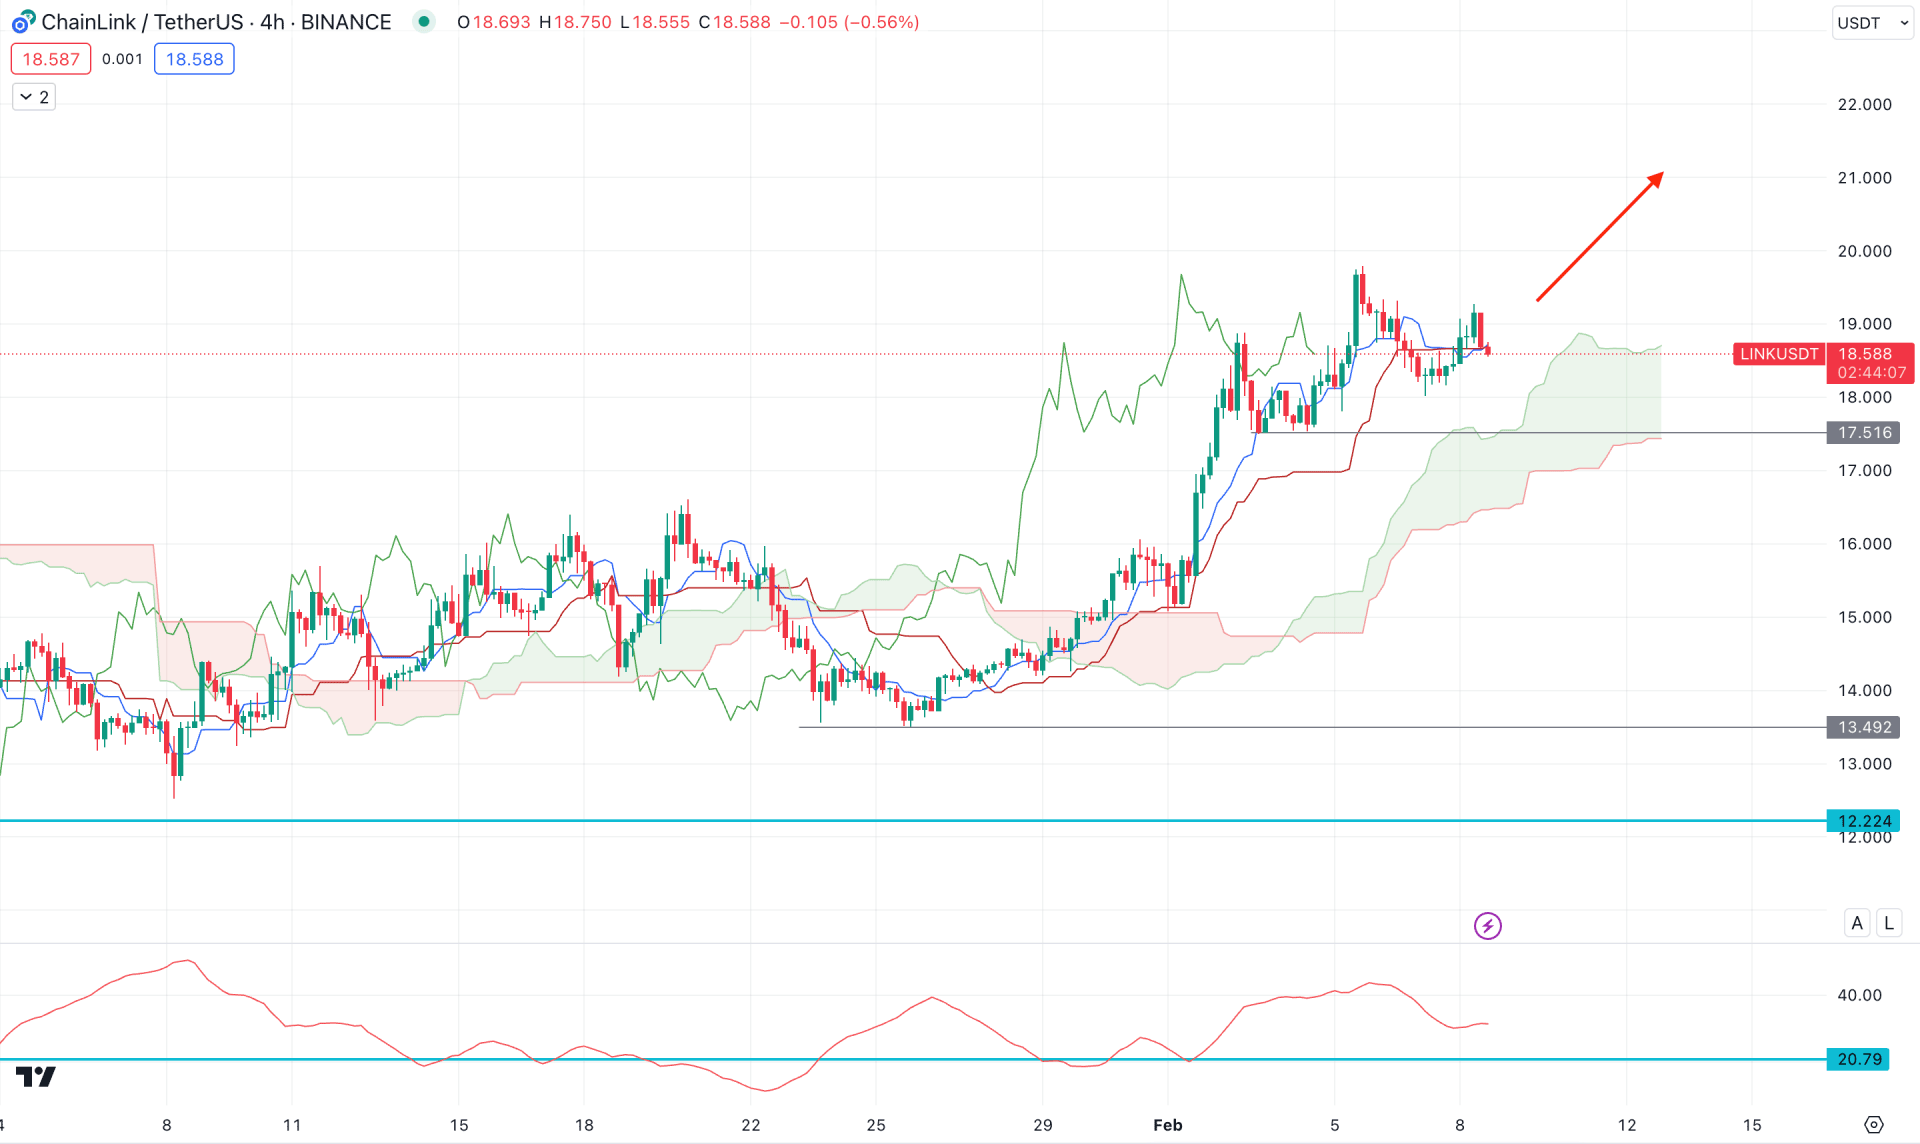
In the H4 chart, a valid bullish trend is visible as Senkou Span A and B aimed higher below the current price with an upward slope. Moreover, the Average Directional Index lost the downside pressure and started to consolidate above the 20.00 line.
Based on the H4 structure, a bullish signal might come after having an H4 candle close above the near-term swing high of 19.29 level.
On the bearish side, the 17.21 static level would be strong support, and below this line, a price inefficiency is visible at the 15.78-16.83 area. In that case, a bearish H4 close below the 17.00 line could lower the price towards the 15.00 level.
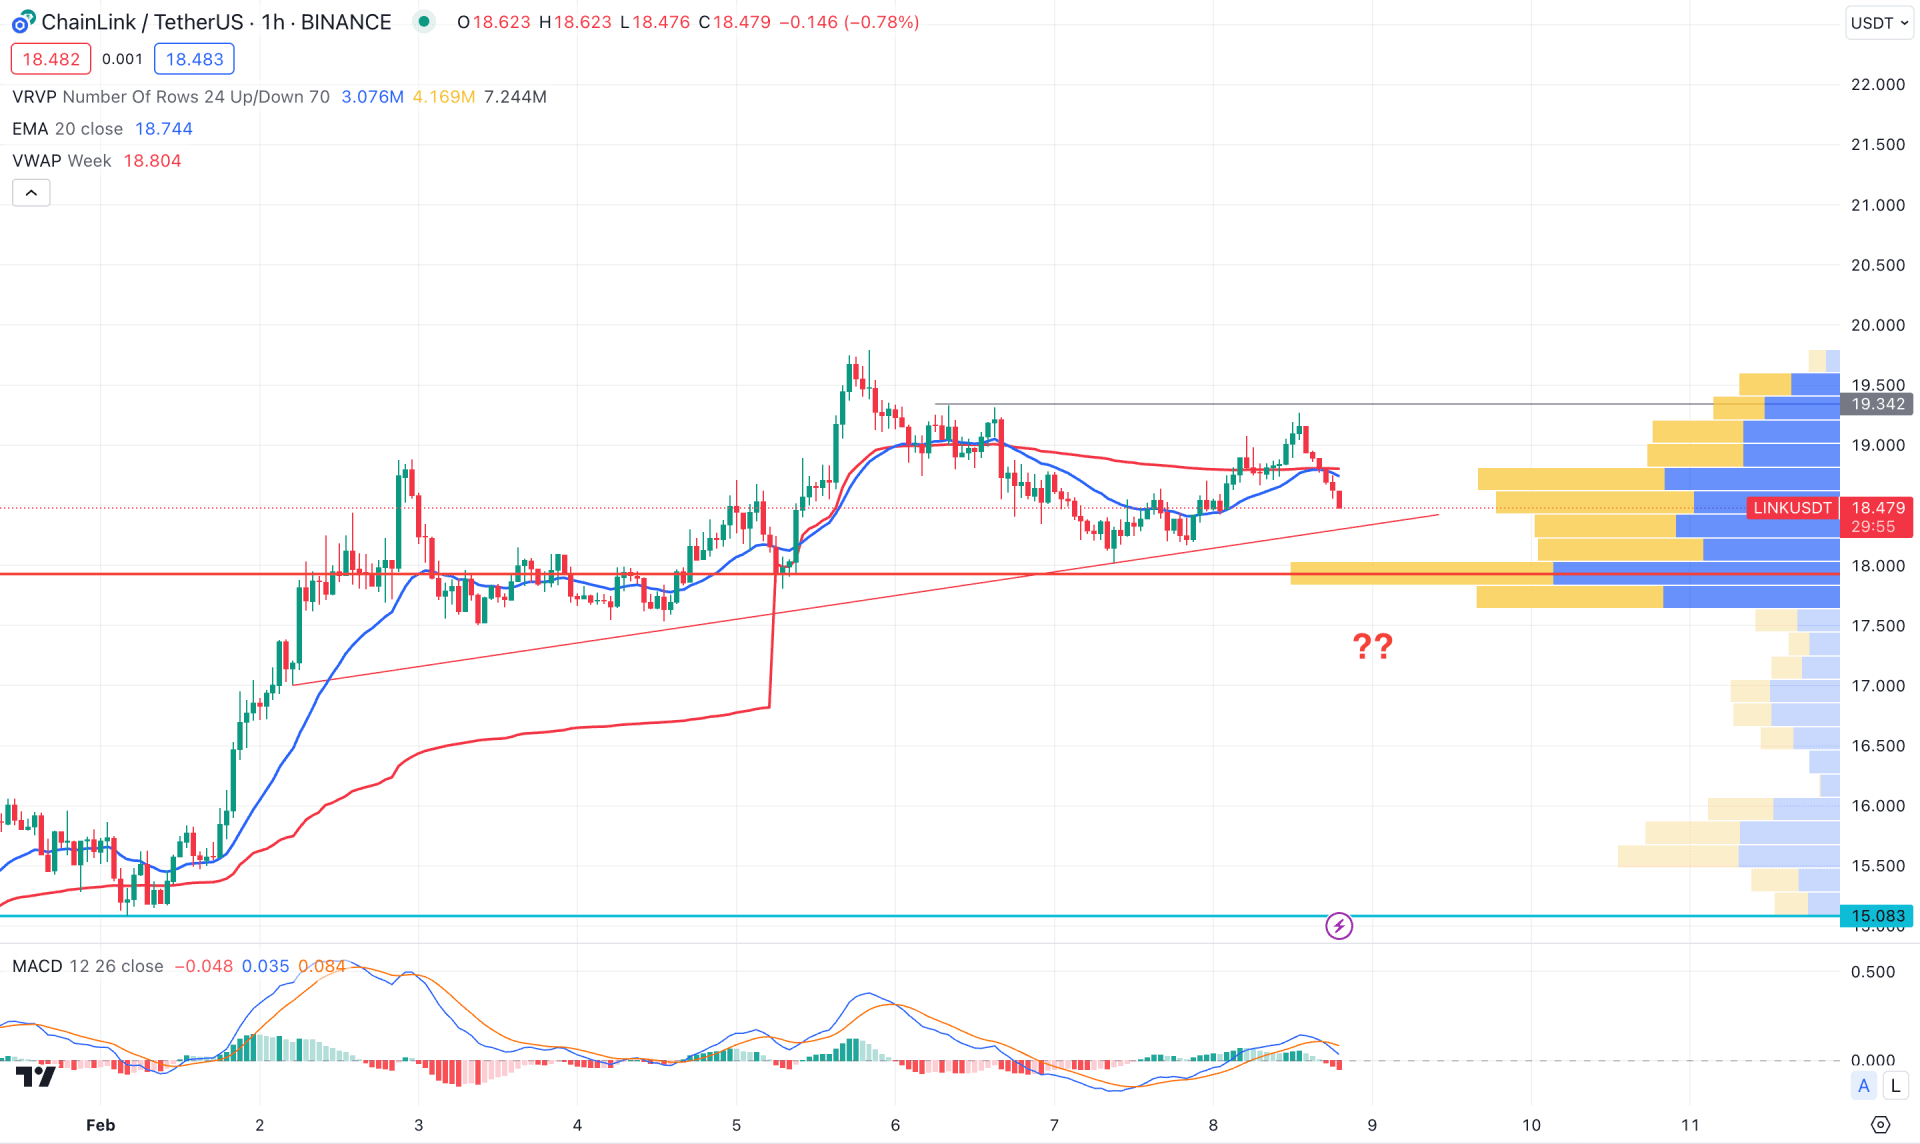
In the H1 chart, the current price trades volatile at the top, where the near-term trend line works as a primary support. Below this line, the next static support is visible at the 17.94 level.
The MACD Histogram moved to the bearish zone in the indicator window, while the dynamic 20-day EMA is above the current price. In that case, a high probable bearish opportunity is visible after having an hourly close below the 17.94 level. In that case, the selling pressure might extend toward the 15.08 support level.
On the bullish side, a liquidity sweep from the trend line support with an immediate bullish H1 candle above the dynamic 20 EMA could be a long opportunity, targeting the 20.00 resistance level.
Based on the current multi-timeframe analysis, LINK/USDT has reached a peak from which a sufficient downside correction is pending. However, a bullish push from the fundamental side could eliminate the downside possibility and resume the trend at any time.


