

Published: September 30th, 2026
Chainlink's LINK token is nearing $15 after a notable price surge sparked by the rollout of CCIP 2.0. Increased buying pressure has fueled the rally, with traders watching whether the upward trend can continue.
LINK has gained more than the broader cryptocurrency market, while Bitcoin has remained relatively stable between $83,000 and $84,000. This divergence suggests Chainlink's recent performance may be largely driven by project-specific developments rather than a broader market upswing.
The key driver behind the rally is CCIP 2.0, an upgraded version of Chainlink's Cross-Chain Interoperability Protocol introduced on September 28. The release adds new security and operational features for financial institutions and digital asset issuers that want to move assets securely between blockchain networks.
One major addition is support for Cross-Chain Verifiers operated by asset issuers, independent third parties, or institutions. These verifiers provide an additional layer of oversight alongside Chainlink's existing verification infrastructure.
The upgrade also introduces faster transfer finality, enabling institutions to tailor transaction confirmation requirements to their individual risk-management standards.
CCIP 2.0's significance extends beyond its technical improvements. Growing interest in these capabilities could strengthen the utility of Chainlink's technology and help explain the renewed market attention surrounding LINK.
Let's see the full price outlook from the LINK/USDT technical analysis:
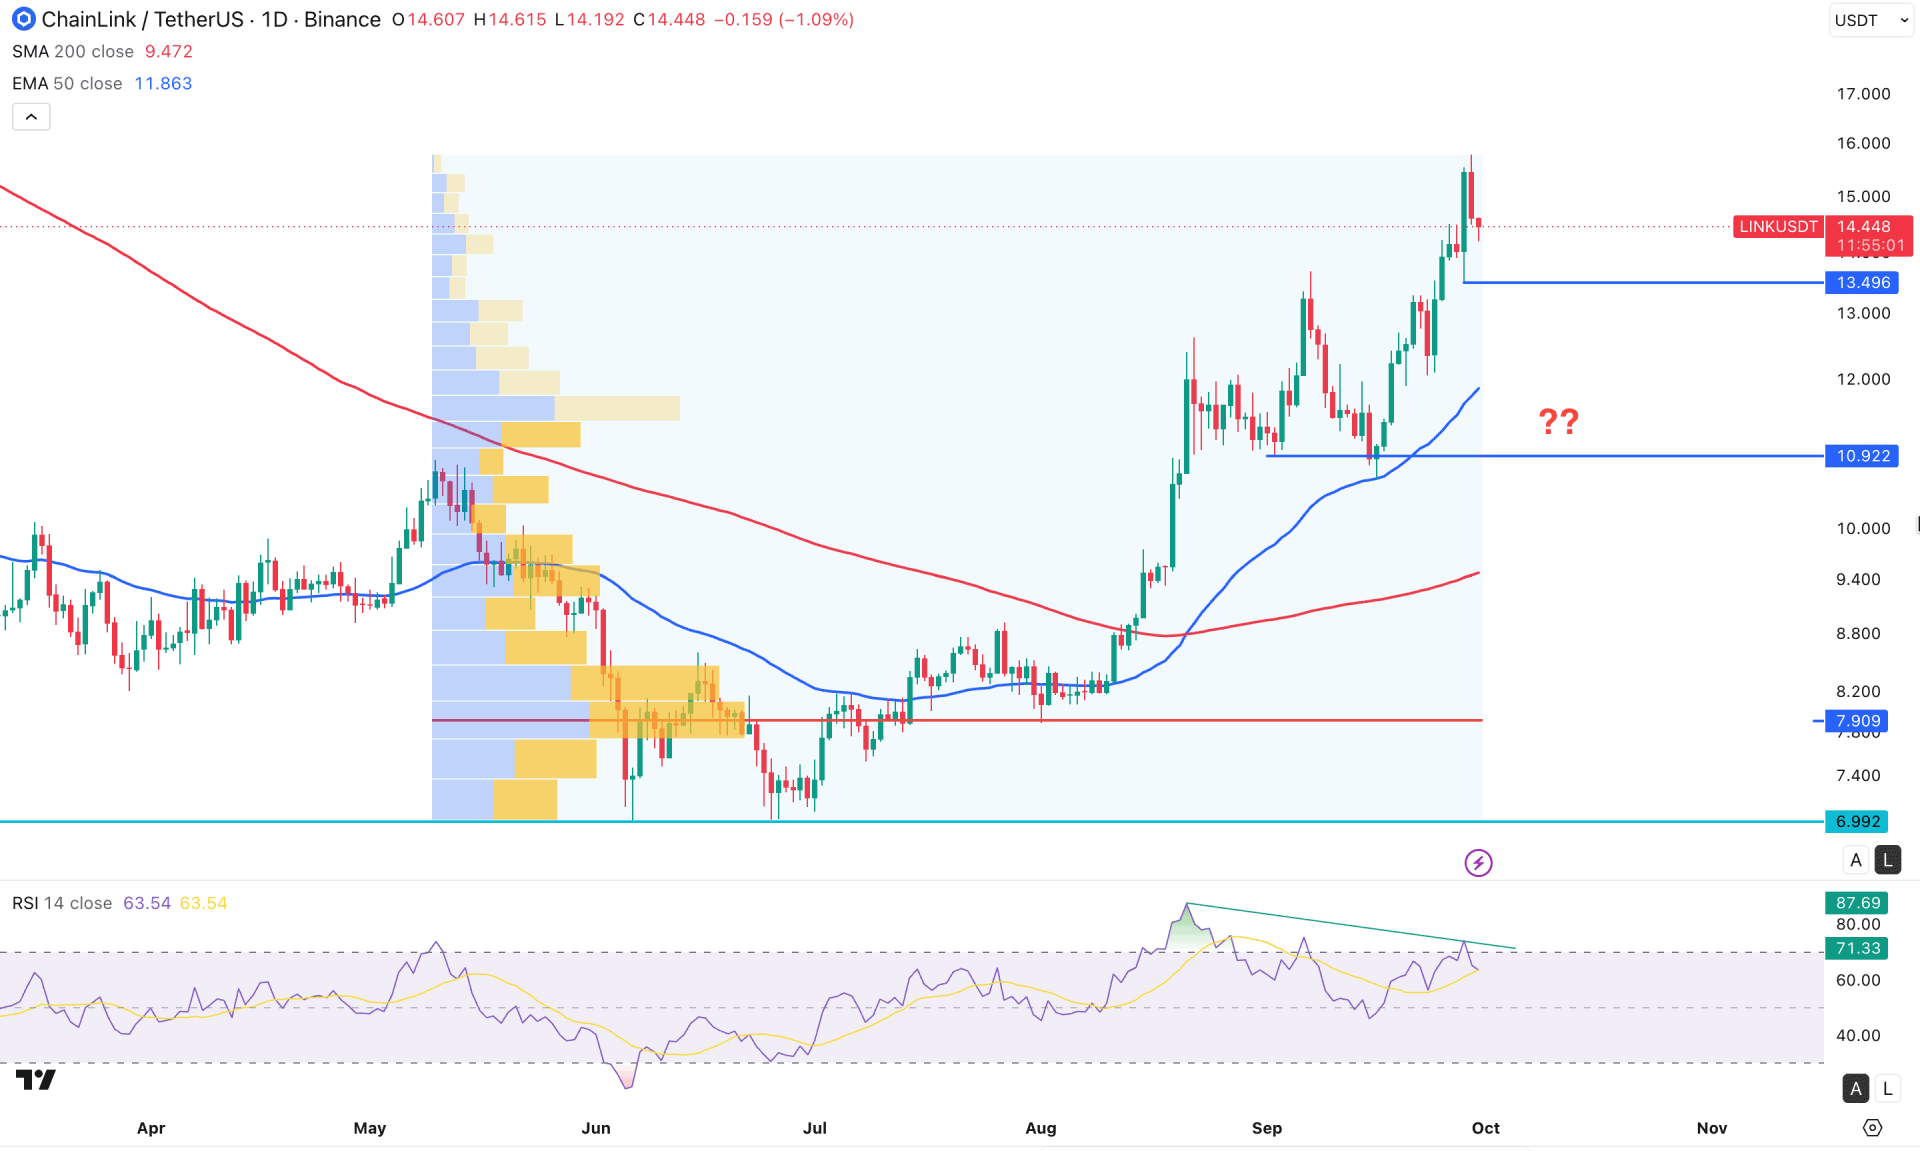
On the daily chart, LINK/USDT shows a strong bullish recovery and has reached a new high for 2026. The overall structure also shows a bullish rebound, as the price has recovered the losses recorded in early 2026.
On higher timeframes, the monthly candles suggest a potential bullish opportunity. Three consecutive bullish closes are visible, followed by a bullish breakout from a six-month range. The weekly timeframe also shows bullish momentum after the price moved above the key resistance level at 14.40.
In the volume structure, the most active level since May 2026 is 7.909, well below the current price. No significant high-volume level has formed near the recent peak, suggesting potential volatility. Continued buying pressure is visible, although the market may need a meaningful downside correction.
On the main price chart, the 200-day SMA and 50-day EMA are below the current price and slope upward. This indicates sustained bullish strength. However, recent price action has turned sideways near the peak. As a result, the gap between the price and these moving averages has widened, creating the possibility of mean reversion.
In the indicator window, a divergence is visible. The price continued to make higher highs, but the Relative Strength Index failed to maintain its upward momentum. The RSI weakened after moving above the 70.00 overbought level. This could signal a potential top, but confirmation is needed before considering a selling opportunity.
Based on the market structure, the rebound from the 6.992 support level marks a notable recovery for LINK/USDT. However, after moving above the 15.000 area, the price turned sideways and formed a bearish reversal candle on the daily chart. Traders should closely monitor how the price reacts at the 13.496 support level. A break below this level could increase the likelihood of a test of the 10.922 support area.
On the bullish side, a minor correction towards 10.922 could present a potential long opportunity. In that case, a clear bullish recovery and a daily close above the 50-day EMA could strengthen buying pressure. The immediate resistance to watch is 20.166, followed by the 28.000 area.
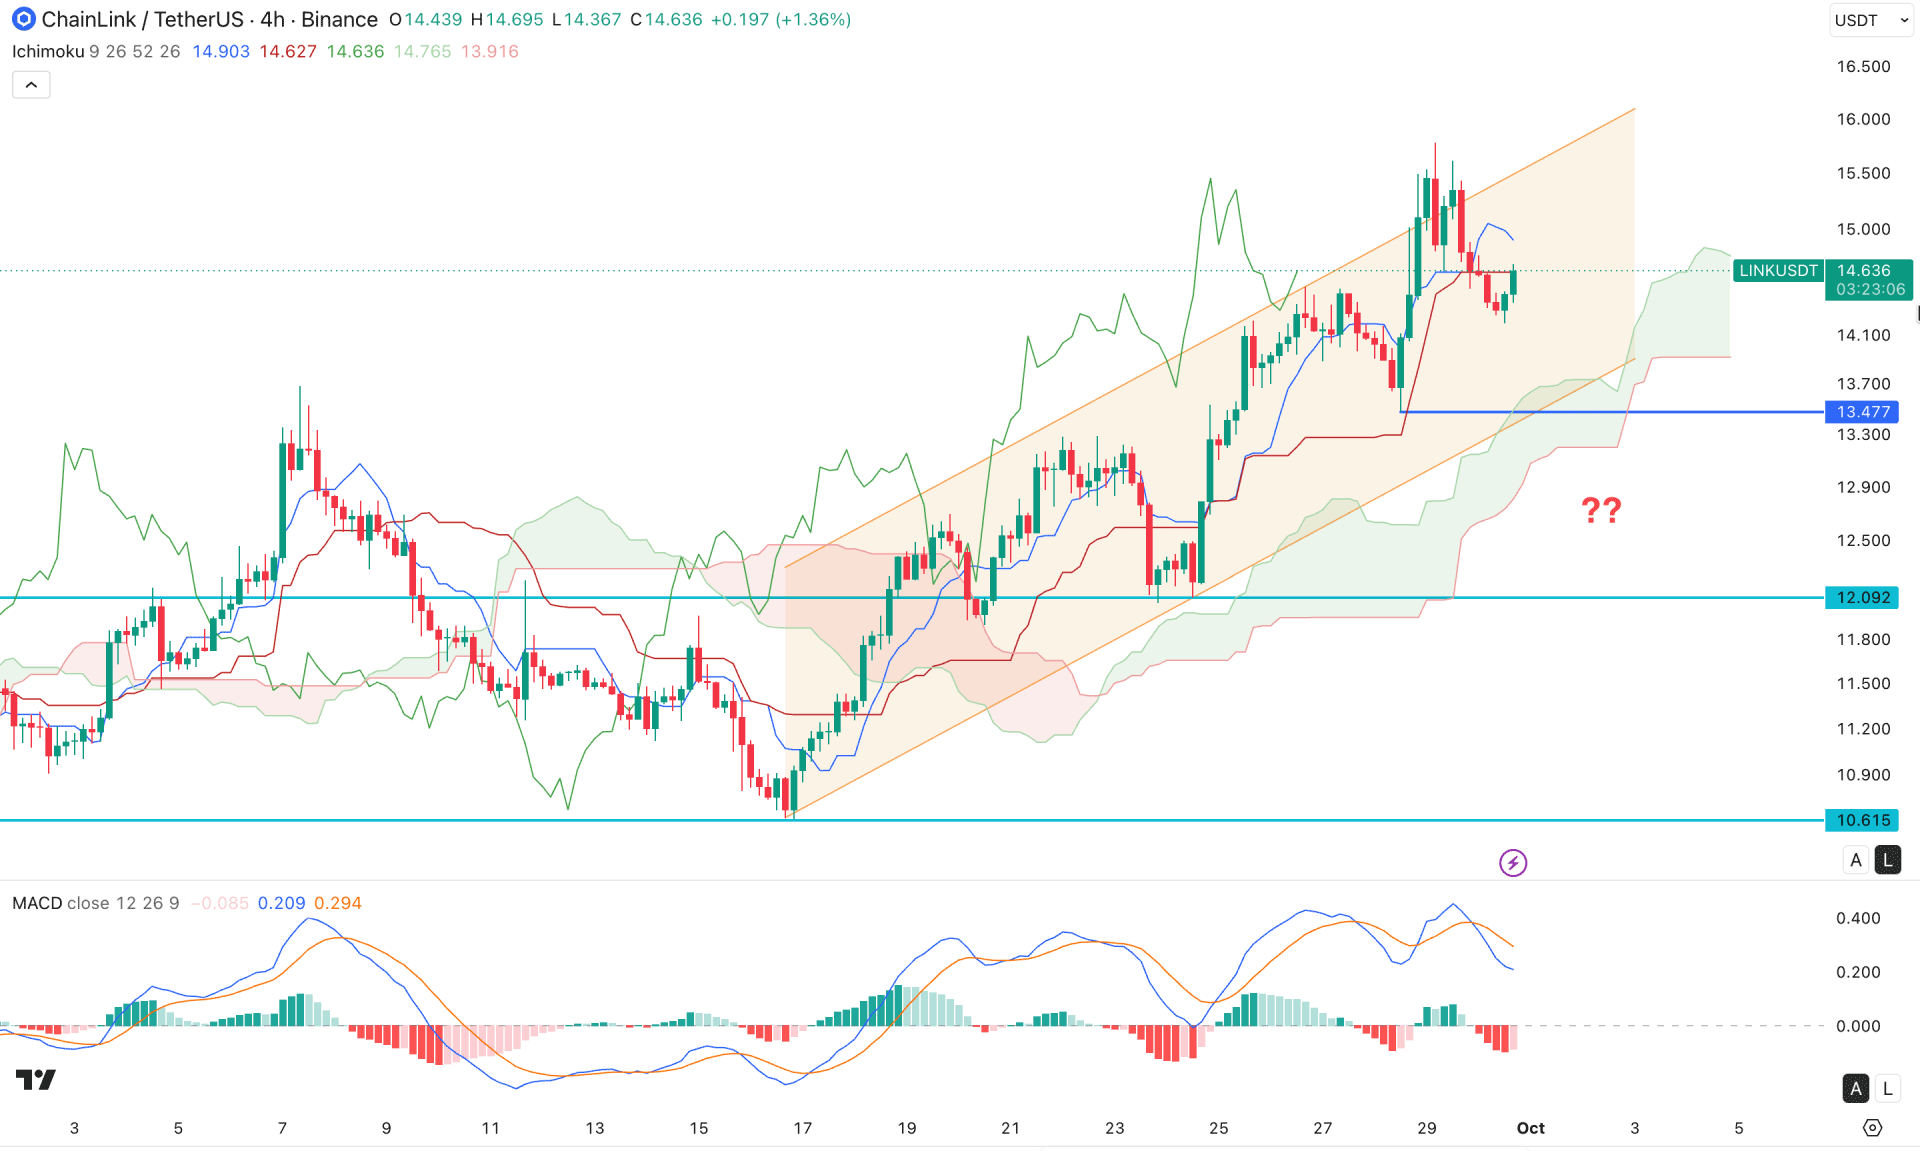
In the four-hour timeframe, LINK/USDT is trading within a bullish trend. A series of higher highs is visible above the cloud support area. However, price has recently moved below the dynamic support level and turned sideways, signalling a minor correction. The future cloud remains bullish, with Senkou Span A above Senkou Span B. This supports the view that buying pressure remains in place.
In the secondary indicator window, the picture differs. The MACD signal lines have crossed near the bullish peak. Meanwhile, the histogram remains close to the zero line, alternating between negative and positive readings.
Based on the four-hour market structure, watch immediate support at 13.47. The price could test this level before buying pressure resumes and the channel extends. A deeper correction towards the key 12.092 support level is also possible. The existing trend could resume from that area.
On the bearish side, the price is already testing channel resistance. The 13.47 level is a crucial barrier for sellers. A bearish move below this level, followed by a clear break below the cloud, could increase the likelihood of a test of the key 10.615 support level.
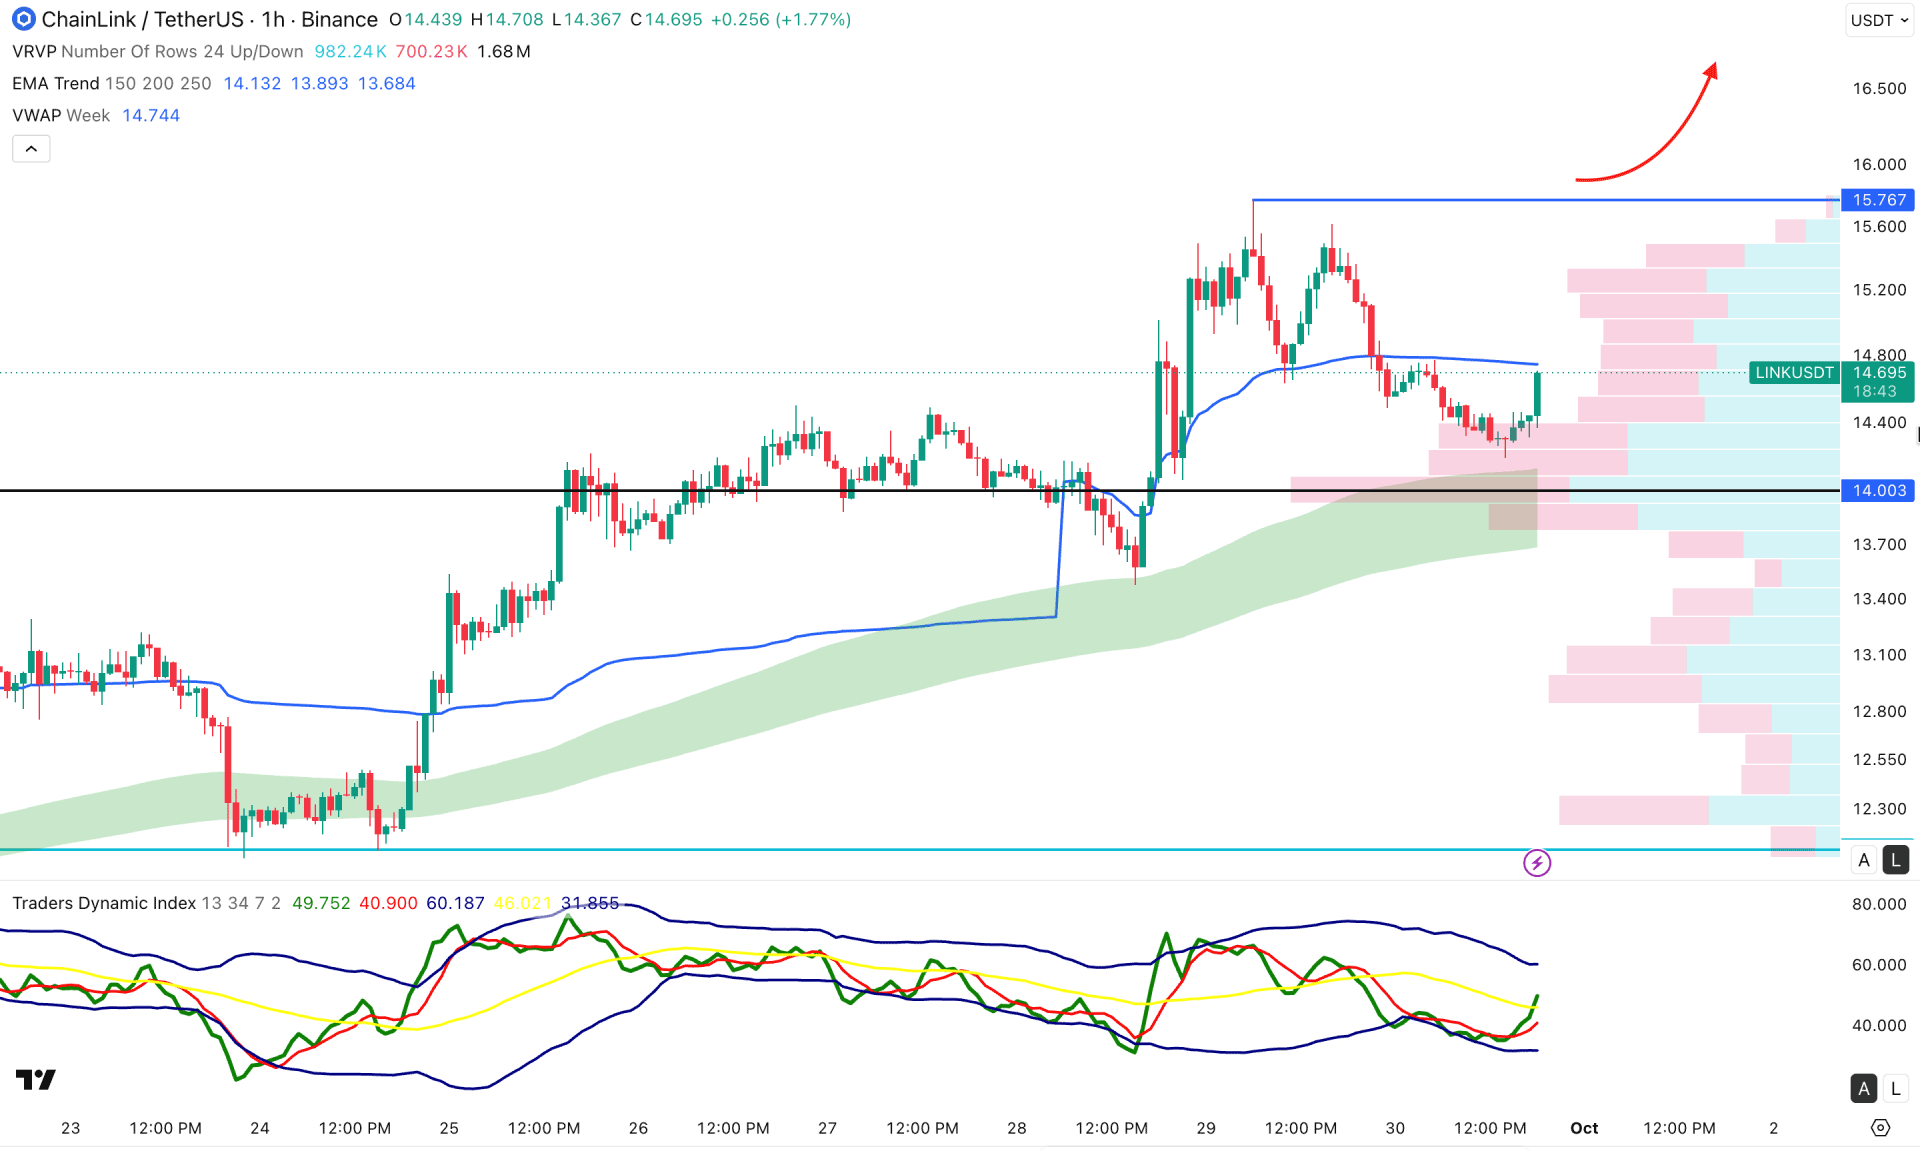
On the hourly timeframe, LINK/USDT remains in a bullish trend. A bearish correction follows an impulsive bullish wave. The EMA wave is acting as major support and aligns with the high-volume level at 14.0003. However, the most recent price action shows a bearish move below the weekly VWAP. The price needs to reclaim this level before the bullish move can continue.
In the secondary indicator, the dynamic index shows a bullish recovery. Its current line is hovering above the neutral 50.00 level, signalling buying pressure in the market.
Based on the market structure, a bullish break above the weekly VWAP could increase the likelihood of a test of the 15.767 resistance level. A move above this level could support an extension towards and beyond the 20.000 area.
The alternative trading approach is to watch for a clear move below the EMA wave. This could extend the decline over the next few hours.
Based on the overall market structure, the LINK/USDT long-term bullish trend remains valid. Three consecutive bullish monthly candles support it within the existing uptrend. However, the daily price appears extended, and a meaningful correction may follow. A selling position would therefore need clear bearish confirmation rather than relying on the possibility of a correction alone.


