
Published: November 30th, 2021
Cartesi is a blockchain-based OS that uses a Layer-2 solution integrated into Linux and a standard programming environment. As a result, developers can code scaling smart contracts in software, tools, and services. This project aims to eliminate the gap between the mainstream software and blockchain so that millions of startups can bring Linux to the blockchain network.
On the other hand, Cartesi is a competition for its layer two protocol and optimistic rollup solution that allow developers to code their DApps and smart contracts directly from the Linux OS. Moreover, Cartesi allows decentralized games where players can conceal their data while Enterprise applications can run their sensitive data within the DApps privacy.
There are 486,540,630.90 CTSI in circulation, which is 49% of the overall supply. The trading volume for the last 24 hours was $90,072,462.58, 64% above the previous day’s trading volume.
Let’s see the upcoming price direction from the CTSI/USDT technical analysis:
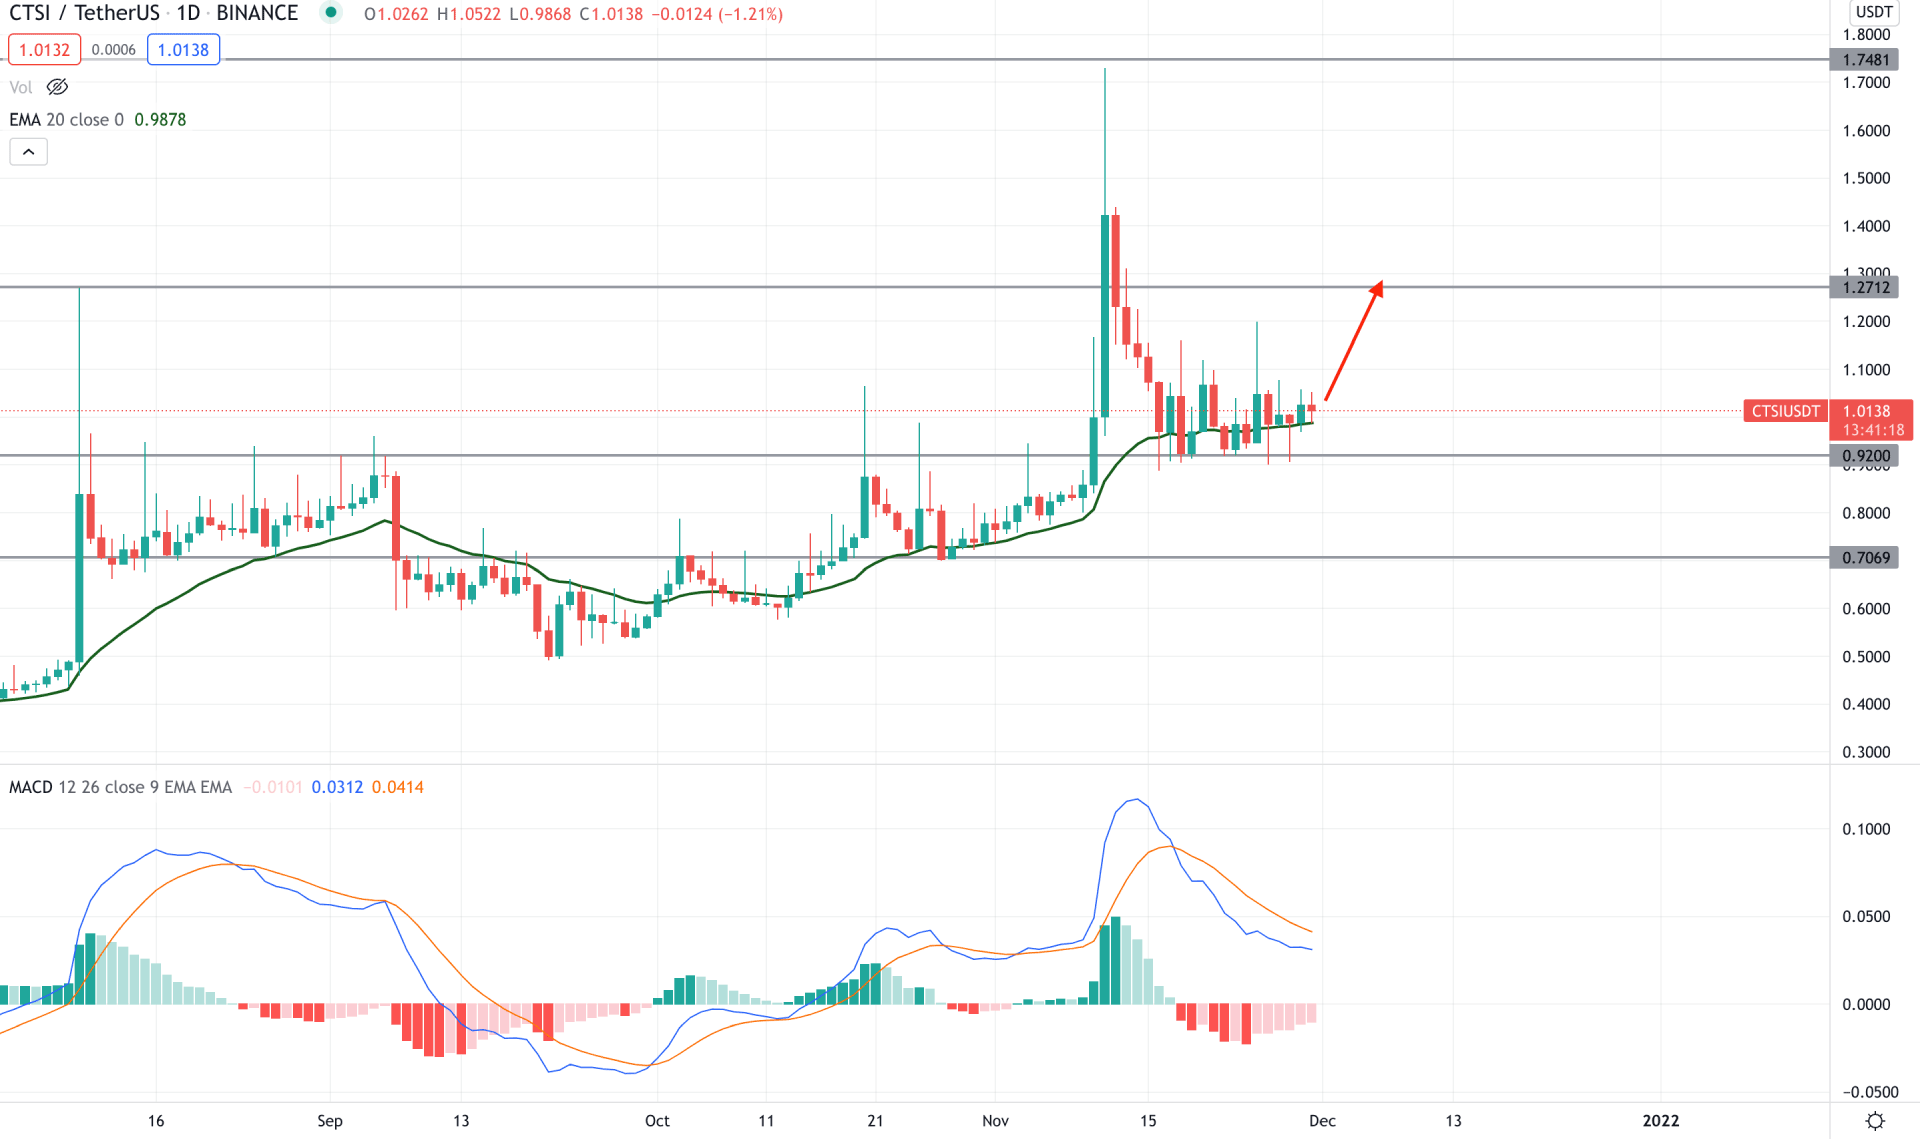
The broader outlook of the CTSI/USDT is volatile, where a prolonged spike in the daily chart is very common in the recent price action. In mid-2021, the price shot higher and made the all-time high at 1.7500 level. However, the price rebounded immediately and started to approach the level with multiple bullish impulsive pressure.
The most recent bullish surge was seen in November where the price moved to 1.7300 level and moved lower. The bearish correction after the bullish wave is weaker, and the current price is trading above the dynamic 20 EMA, which is a sign of an upcoming bullish pressure.
The above image shows how the MACD Histogram squeezes to the zero level while the dynamic 20 EMA works as minor support. The bullish possibility may extend if the price makes a new intraday swing high with a positive MACD Histogram. In that case, the primary target of the bullish pressure would be towards the 1.2700 area. On the other hand, the bullish pressure is valid as long as bulls hold the price above the 0.9200 event level. A bearish daily close below 0.9200 may lower the price towards the 0.7000 area.
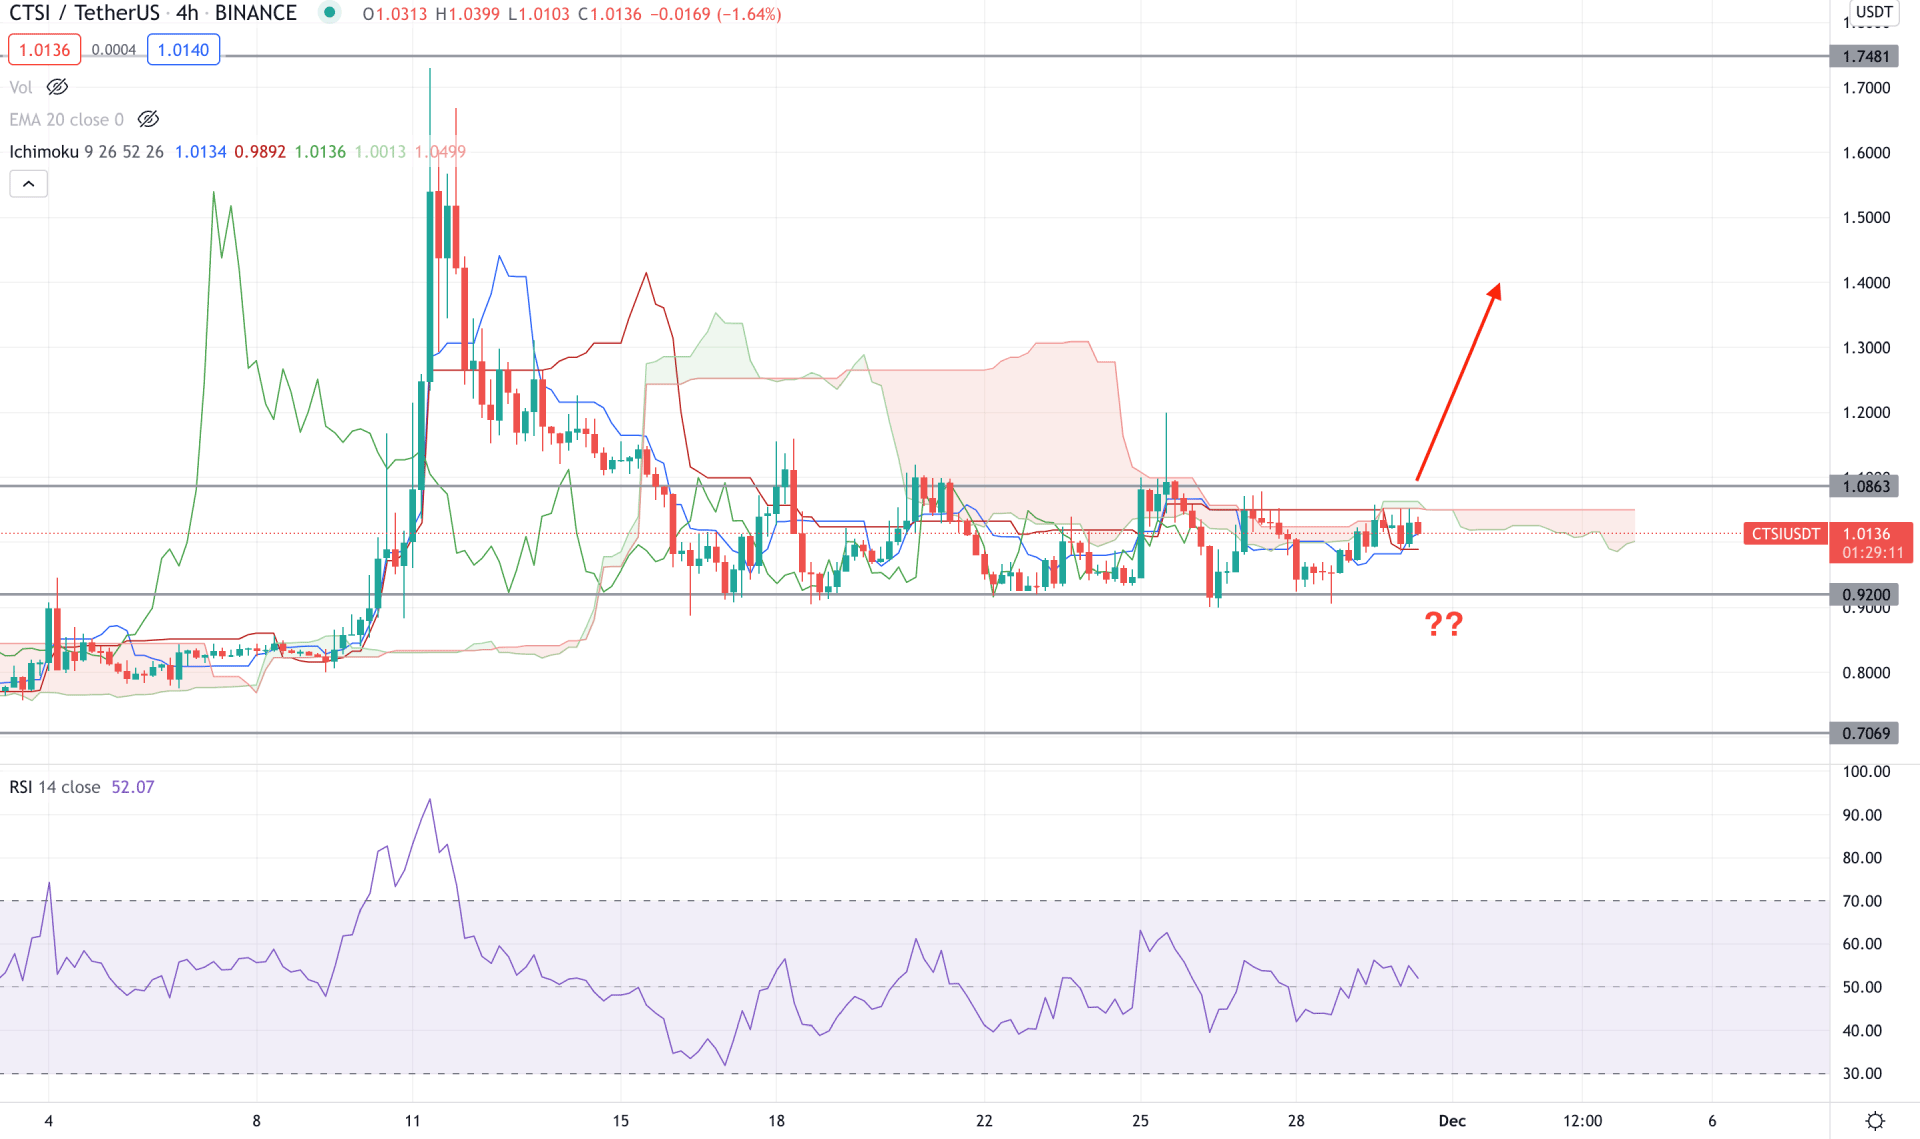
According to the Ichimoku Cloud, CTSI/USDT is trading within an extreme correction within 1.0860 to 0.9200 area. Therefore, a bullish breakout above 1.0860 has a higher possibility of taking the price higher. In the future cloud, Senkou Span A is below Senkou Span B and moving up.
The above image shows the H4 chart of CTSI/USDT where the RSI is corrective at 50 levels. Therefore, any bullish sentiment in the RSI would be a bullish sign for the CTSI. Meanwhile, the dynamic Tenkan Sen and Kijun Sen are corrective and working as minor support to the price.
Based on the H4 context, any bullish H4 close above the Kumo Cloud and static 1.086 level would be a potential buying opportunity in this pair with the target of 1.5000 level. On the other hand, a big selling pressure below the 0.9200 may alter the current market structure and lower the price towards the 0.700 area.
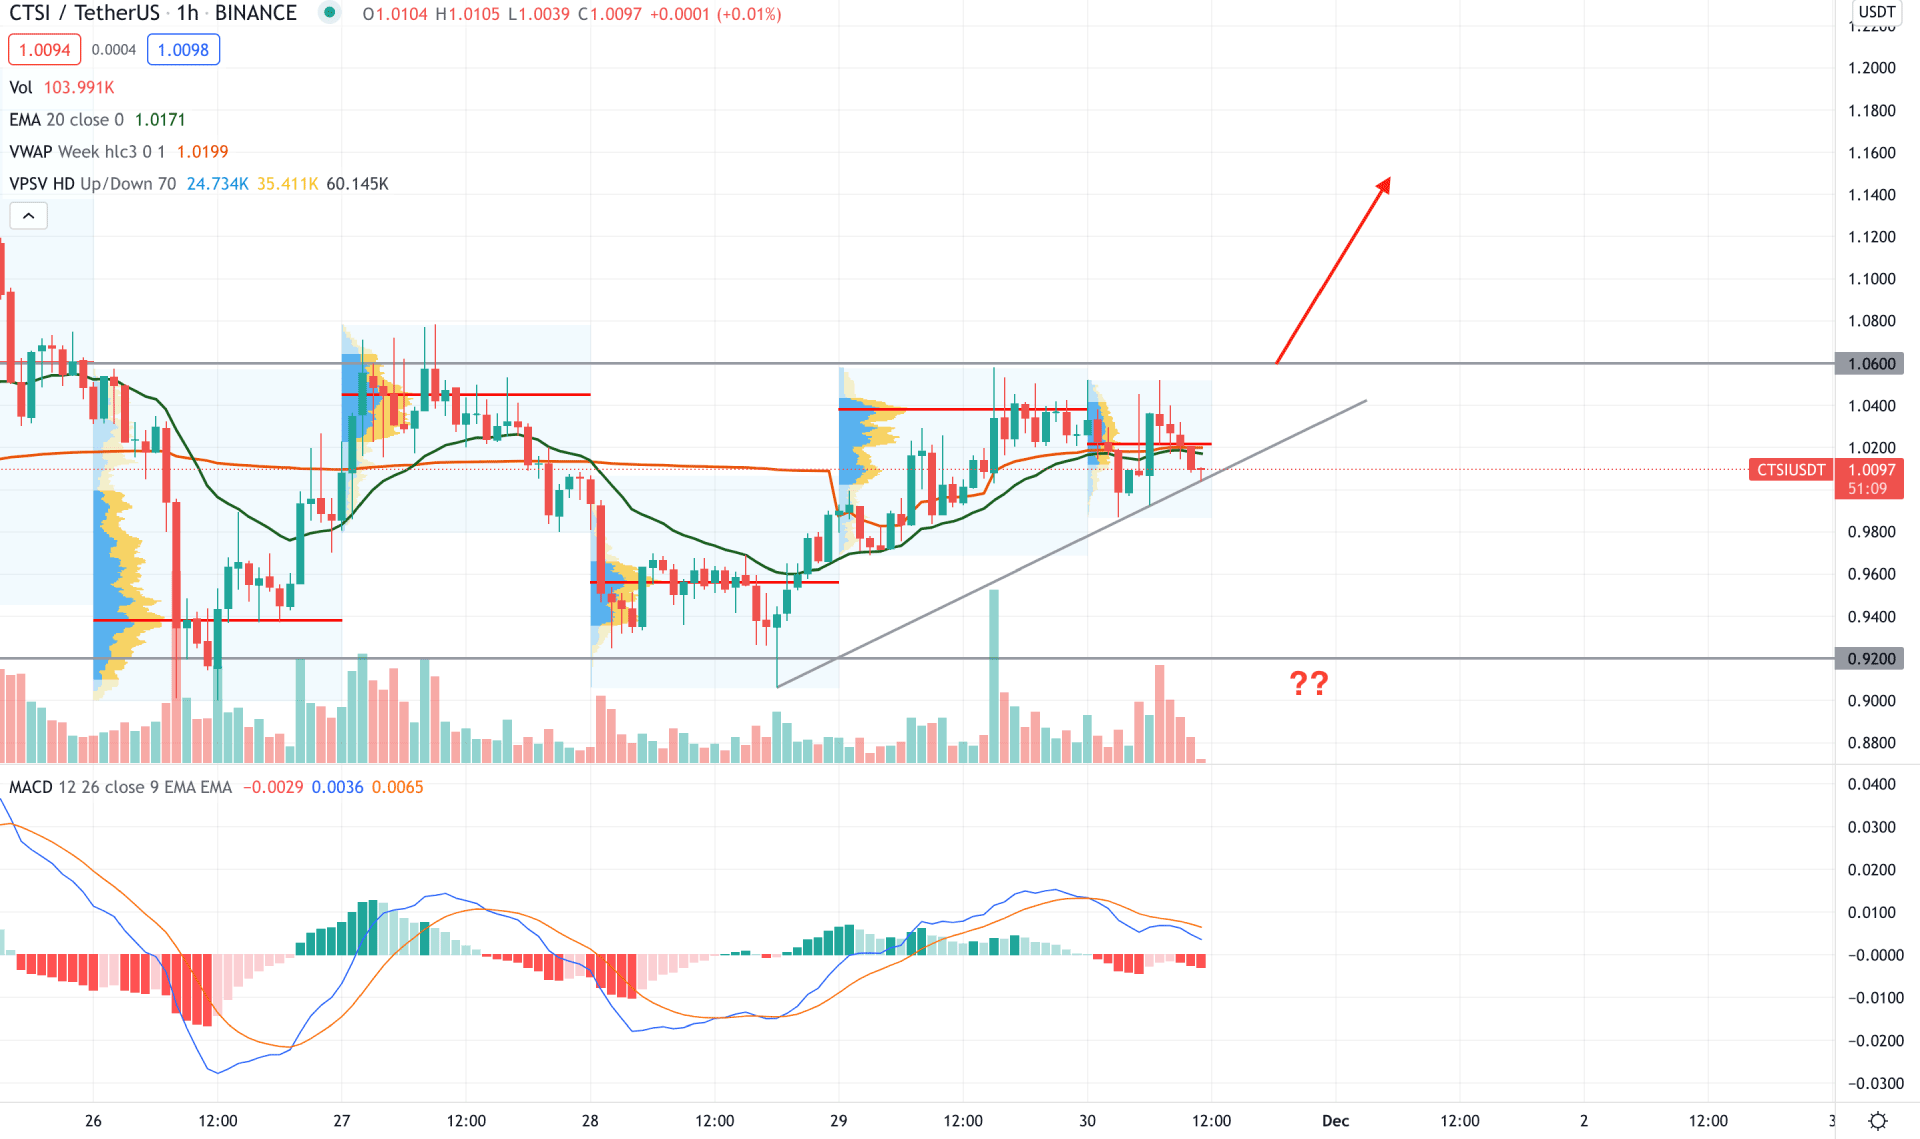
CTSI/USDT is trading within an ascending triangle where the most recent price correction is at a 1.0600 intraday resistance level in the intraday chart. As the broader market outlook is bullish, any H1 candle above the 1.0600 level would be a potential buying opportunity in this pair.
The above image shows how the MACD Histogram is heading below the neutral level while the MACD lines are at the positive territory. Therefore a new bullish MACD Histogram would attract buyers in this pair to test the 1.500 area. On the other hand, investors should closely monitor how the price reacts on the 0.9200 level. Any bearish pressure below this level with a substantial volume may lower the price towards the 0.700 area.
As per the current market condition, CTSI/USDT is more likely to move up in the coming days. As the border market context is bullish, any H4 candle above the 1.0800 level would increase the buying pressure. On the other hand, the 0.9200 level would be a major support level. Any bearish Daily candle below this level may lower the price towards the 0.700 area.


