
Published: June 6th, 2024
Carnival Corporation & plc (CCL) is in a favorable position to capitalize on a resilient booked position for the remainder of the year, as pricing and occupancy rates are substantially higher than those of 2023. Furthermore, the organization's marketing and fleet expansion initiatives are optimistic.
Carnival's shares have increased by 32.7% in the past year, surpassing the industry's 7.9% growth. Nevertheless, the organization faces obstacles, including elevated cruise expenses and geopolitical uncertainties.
Carnival anticipates a 4.5% increase in capacity from 2023 to 2024. This expansion is bolstered by a yield increase of over one percentage point, reaching approximately 9.5%. These factors are anticipated to increase revenue by approximately $200 million.
Since 2019, the organization has prioritized eliminating 26 less effective vessels from its fleet. Carnival remains optimistic about replacing these ships with new, larger, and more efficient vessels. Carnival anticipates that newly delivered ships will comprise 50% of its capacity, facilitating a return to profitability and an enhanced return on invested capital.
Carnival anticipates that its adjusted cruise costs, which exclude petroleum per ALBD (in constant currency), will increase by approximately 3% year over year during the second quarter of fiscal 2024. This increase involves a 1.3 percentage point unfavorable impact due to reduced ALBDs from the Red Sea rerouting, as certain ships were repositioned without guests.
Let's see the further price direction of this stock from the CCL technical analysis:
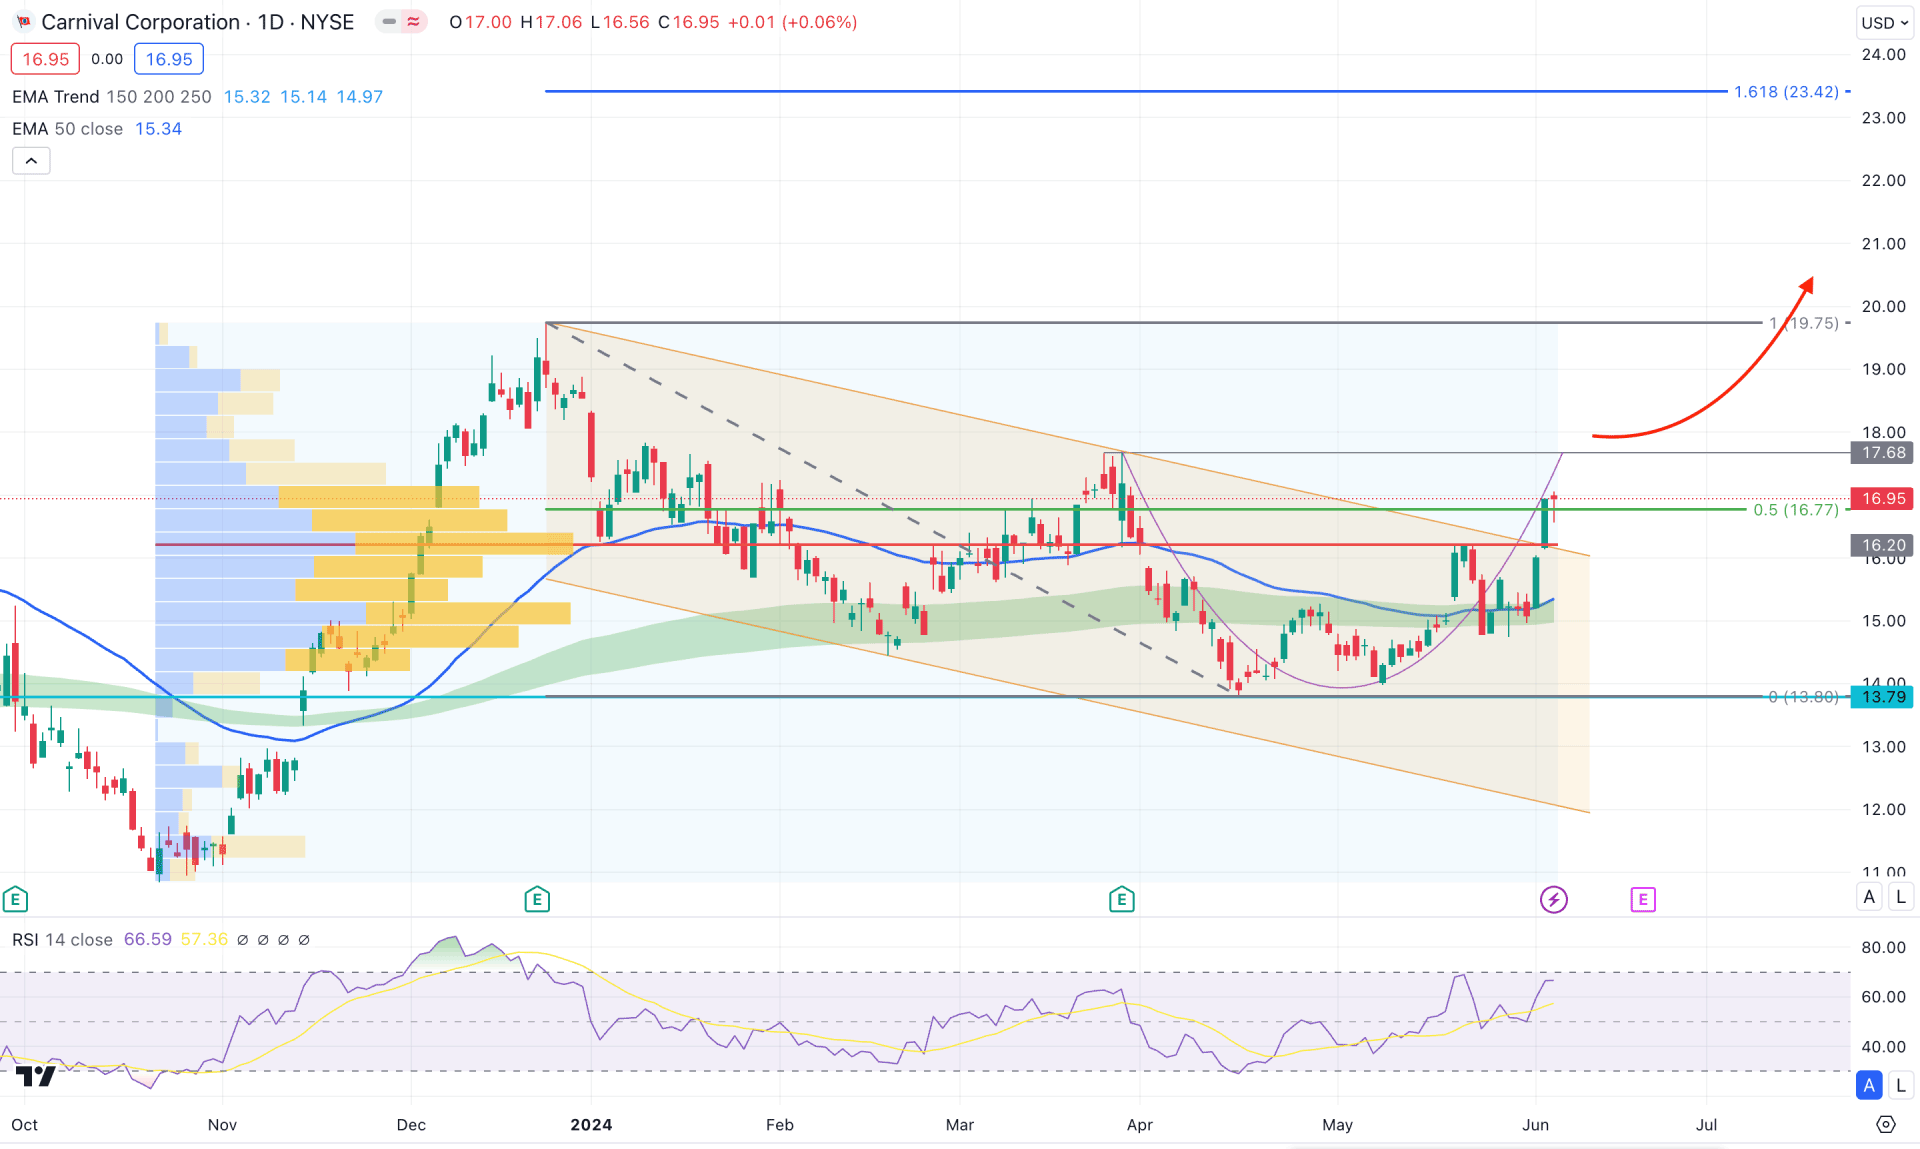
The broader market context is bullish in CCL's daily chart. The current price hovers at the crucial trendline resistance, suggesting a potential bullish breakout.
In the higher timeframe, the monthly candle suggests a bullish pressure as the current price hovers above the 2-month high with a potential bullish breakout opportunity. The weekly price shows a similar outlook, where the current candle trades higher after two consecutive indecision candlesticks.
In the volume structure, the ongoing buying pressure is valid, as the recent price hovers above the high volume line. It also signals that long-term traders and institutional investors are long in this stock. However, the gap between the current price and the high volume line is closer, which might result in a bearish signal after having a solid bearish recovery. In that case, investors should find additional signals from technical indicators to gauge the future price.
In the main price chart, the most recent consolidation came from the Moving Average wave, consisting of MA 150 to 250. As the current price trades bullish from the crucial MA zone, we may consider the current price as bullish. Moreover, the 50-day Exponential Moving Average is below the current price and is working as a major support.
In the indicator window, the Relative Strength Index (RSI) showed a bullish rebound from the 50.00 neutral point and reached near the 70.00 overbought area. It is a sign that bulls are still active in the market and ready to take the price until the RSI reaches above the 70.00 line.
Based on the daily market outlook of CCL, ongoing buying pressure is visible, where the main aim is to test the 19.75 level. Moreover, a stable market above the 17.68 level would indicate a 'U' shape recovery, increasing the possibility to test the 23.42 Fibonacci Extension level.
On the other hand, a failure to hold the price above the 16.20 high volume line with a bearish daily candle below the 15.00 level could initiate a bearish signal, targeting the 11.00 psychological level.
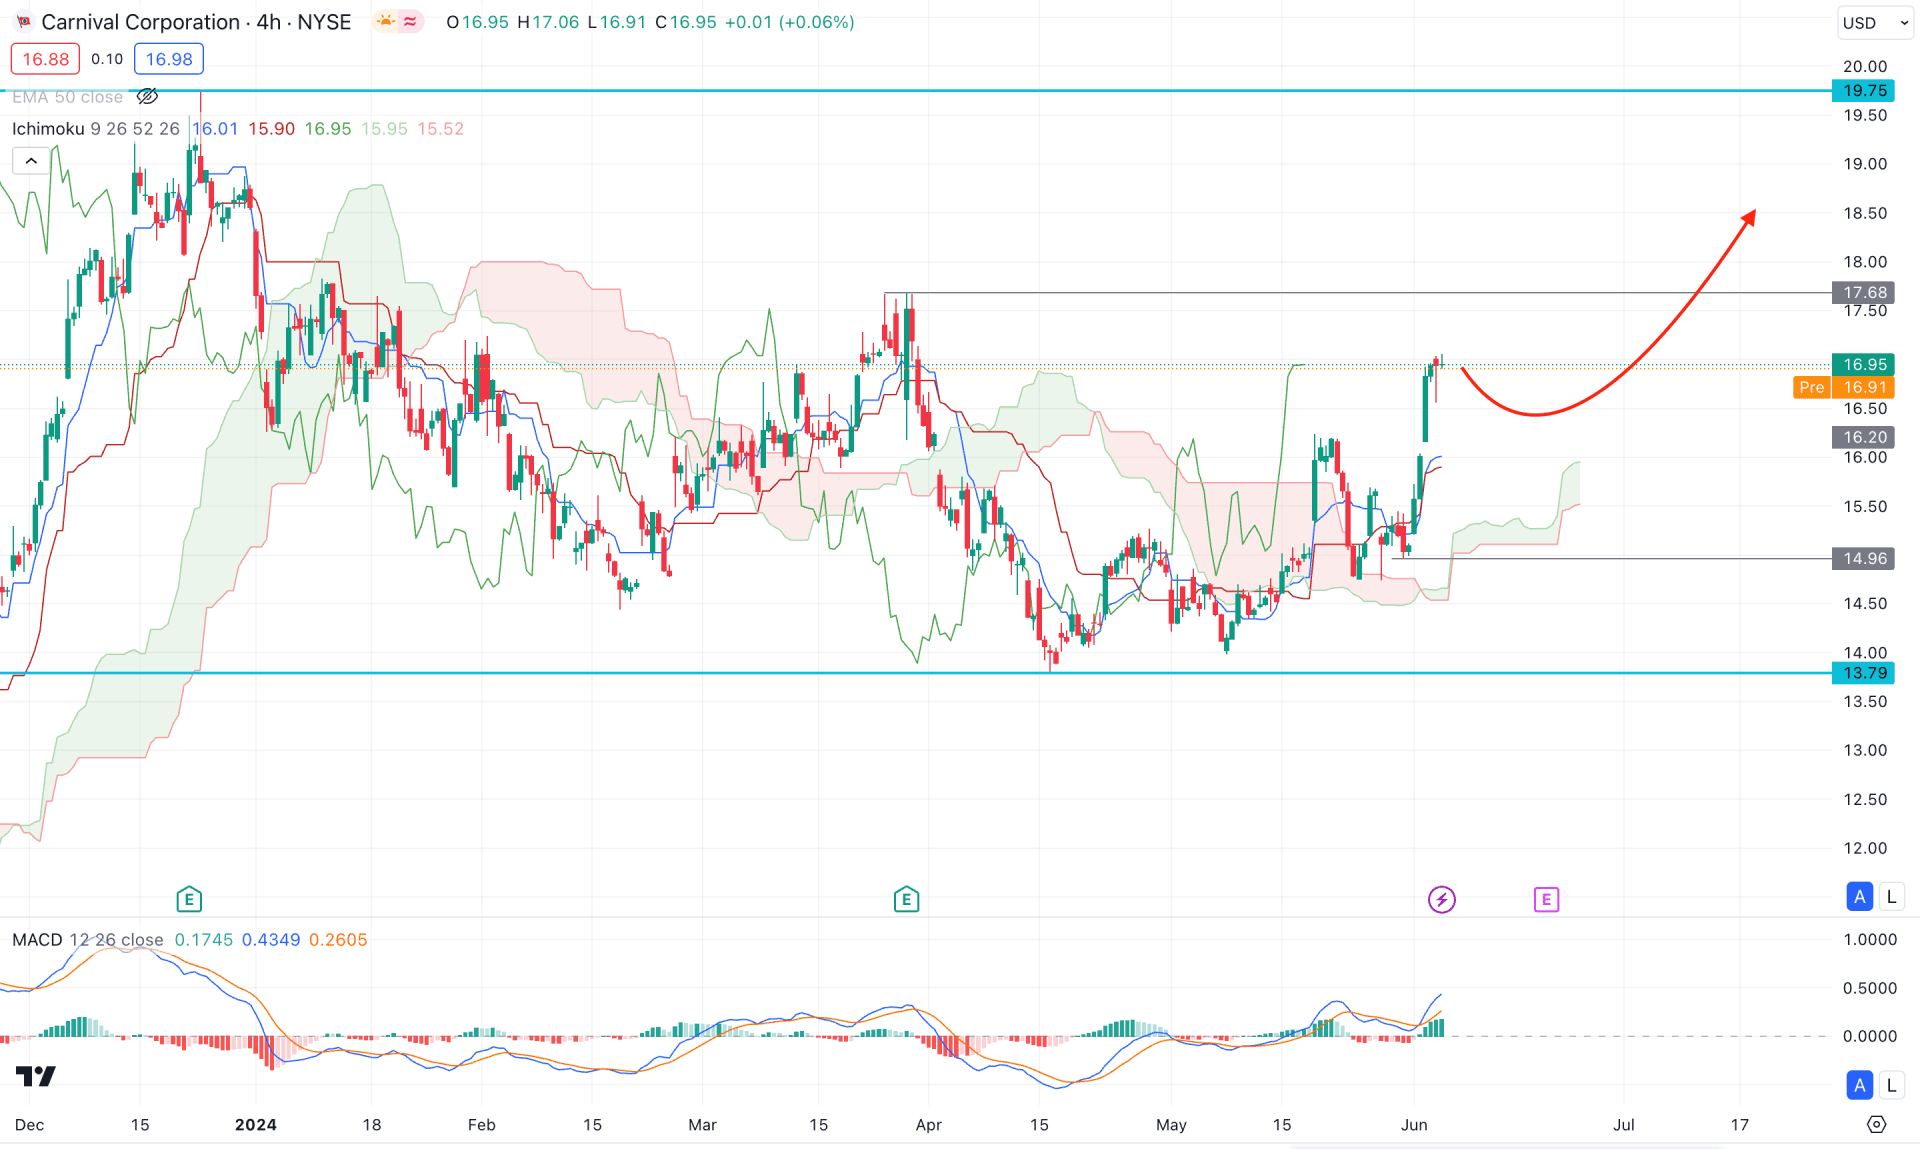
In the H4 timeframe, the recent price failed to hold the bearish momentum below the Ichimoku Cloud low and formed a strong, bullish recovery. Later on, the price keeps moving higher, reaching a new high above the dynamic Kijun Sen level. The future cloud is also supportive of bulls, where the Senkou Span A aimed higher above the Senkou Span B.
In the indicator window, the MACD Histogram maintained the buying pressure while the Signal line was at the overbought area.
Based on the H4 Ichimoku Cloud analysis, the CCL is more likely to extend the buying pressure towards the 20.00 psychological level. However, a failure to hold the price above the dynamic Kijun Sen support and a bearish reversal below the Cloud low could lower the price below the 13.79 support level.
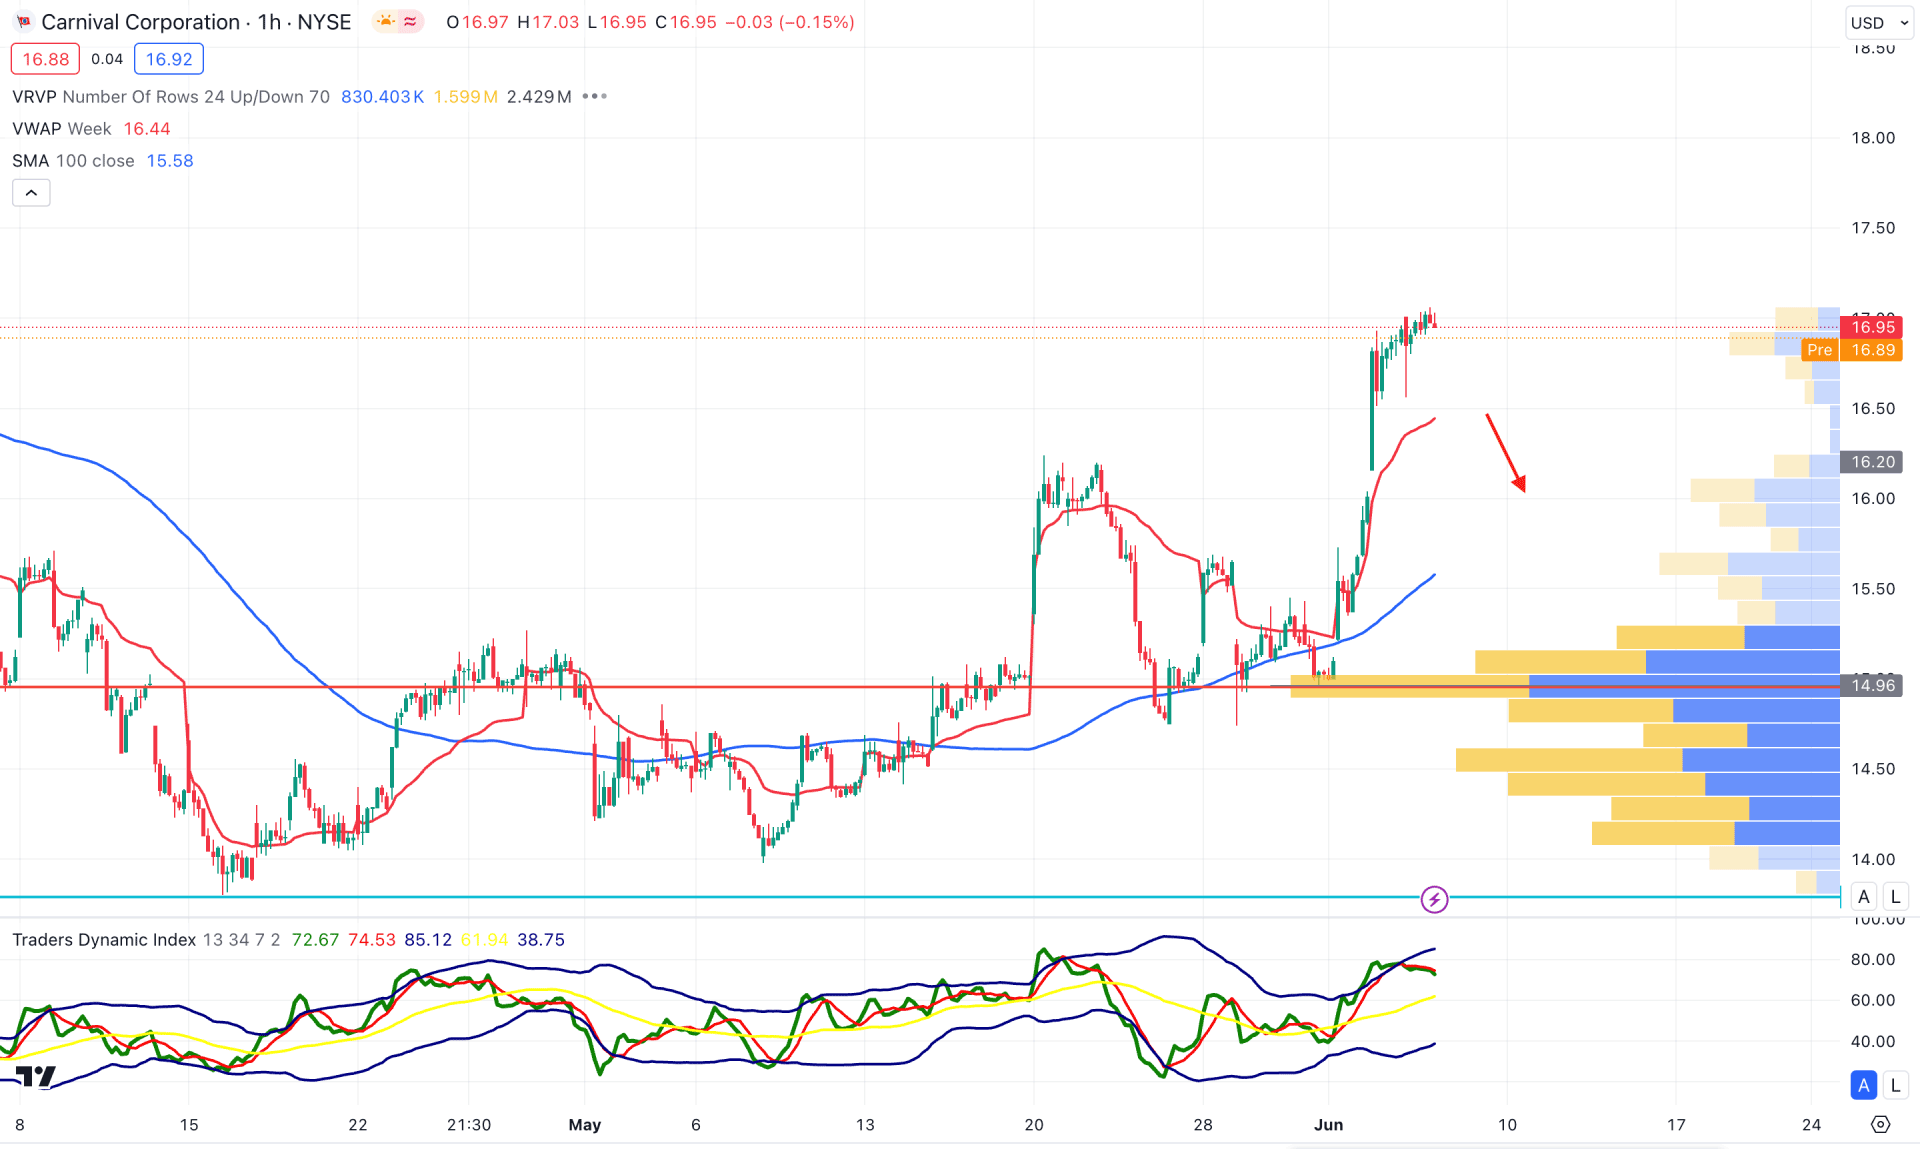
In the hourly chart, CCL trades bullish, where the major support level is the 100 Simple Moving Average line. Moreover, the visible range high volume line is below the current price, suggesting a strong intraday buying pressure from institutional investors.
In the indicator window, the Traders Dynamic Index (TDI) has reached the overbought level and became flat, suggesting a peak to the existing bullish trend. Moreover, the weekly VWAP is below the current price with a bullish slope, suggesting a buying pressure.
Based on this structure, a sufficient downside correction is pending, as the current price reached the bullish liquidity zone. A valid rebound with a bullish pressure at the 16.00 to 14.96 zone could open a bullish opportunity, targeting the 20.00 area. However, a break below the 14.00 line might extend the loss below the 10.00 level before offering another long signal.
Based on the current market structure, the industry demand is solid to make this stock a buy, supported by the technical price pattern shown in the daily chart. In that case, a valid buying pressure from the intraday price could be an early opportunity to join the long-term rally.


