

Published: September 16th, 2026
As oil futures challenged $110 per barrel this week, the cruise and airline industries, which are both significantly impacted by fuel prices, continued to react inversely.
Despite geopolitical unpredictability, high fuel prices, and short-term demand pressure in some regions of Europe, CCL anticipates generating over $7 billion in modified EBITDA in fiscal 2026. With sales, yields, EBITDA, net income, and customer deposits hitting all-time highs, the company's fiscal second-quarter results supported the forecast. Due to ongoing commercial performance and increased cost-efficiency initiatives, Carnival also surpassed its March 2026 target for adjusted net profit by $100 million.
The yield pressure is significantly mitigated by cost restraint. It is currently anticipated that cruise expenses, excluding gasoline, will rise by about 1.3% on a normalised basis. However, increased cost control will result in an increase in ship costs.
On the other hand, fuel expenditures for Carnival Corporation increased by almost 30% due to extreme energy market volatility. Due to the fact that Carnival does not normally hedge its fuel risk, the company was fully impacted by these rising commodity prices, which resulted in a 3.9% decline in gross margin yields in the 2nd quarter (Q2).
Let's see the further price prediction from the CCL technical analysis:
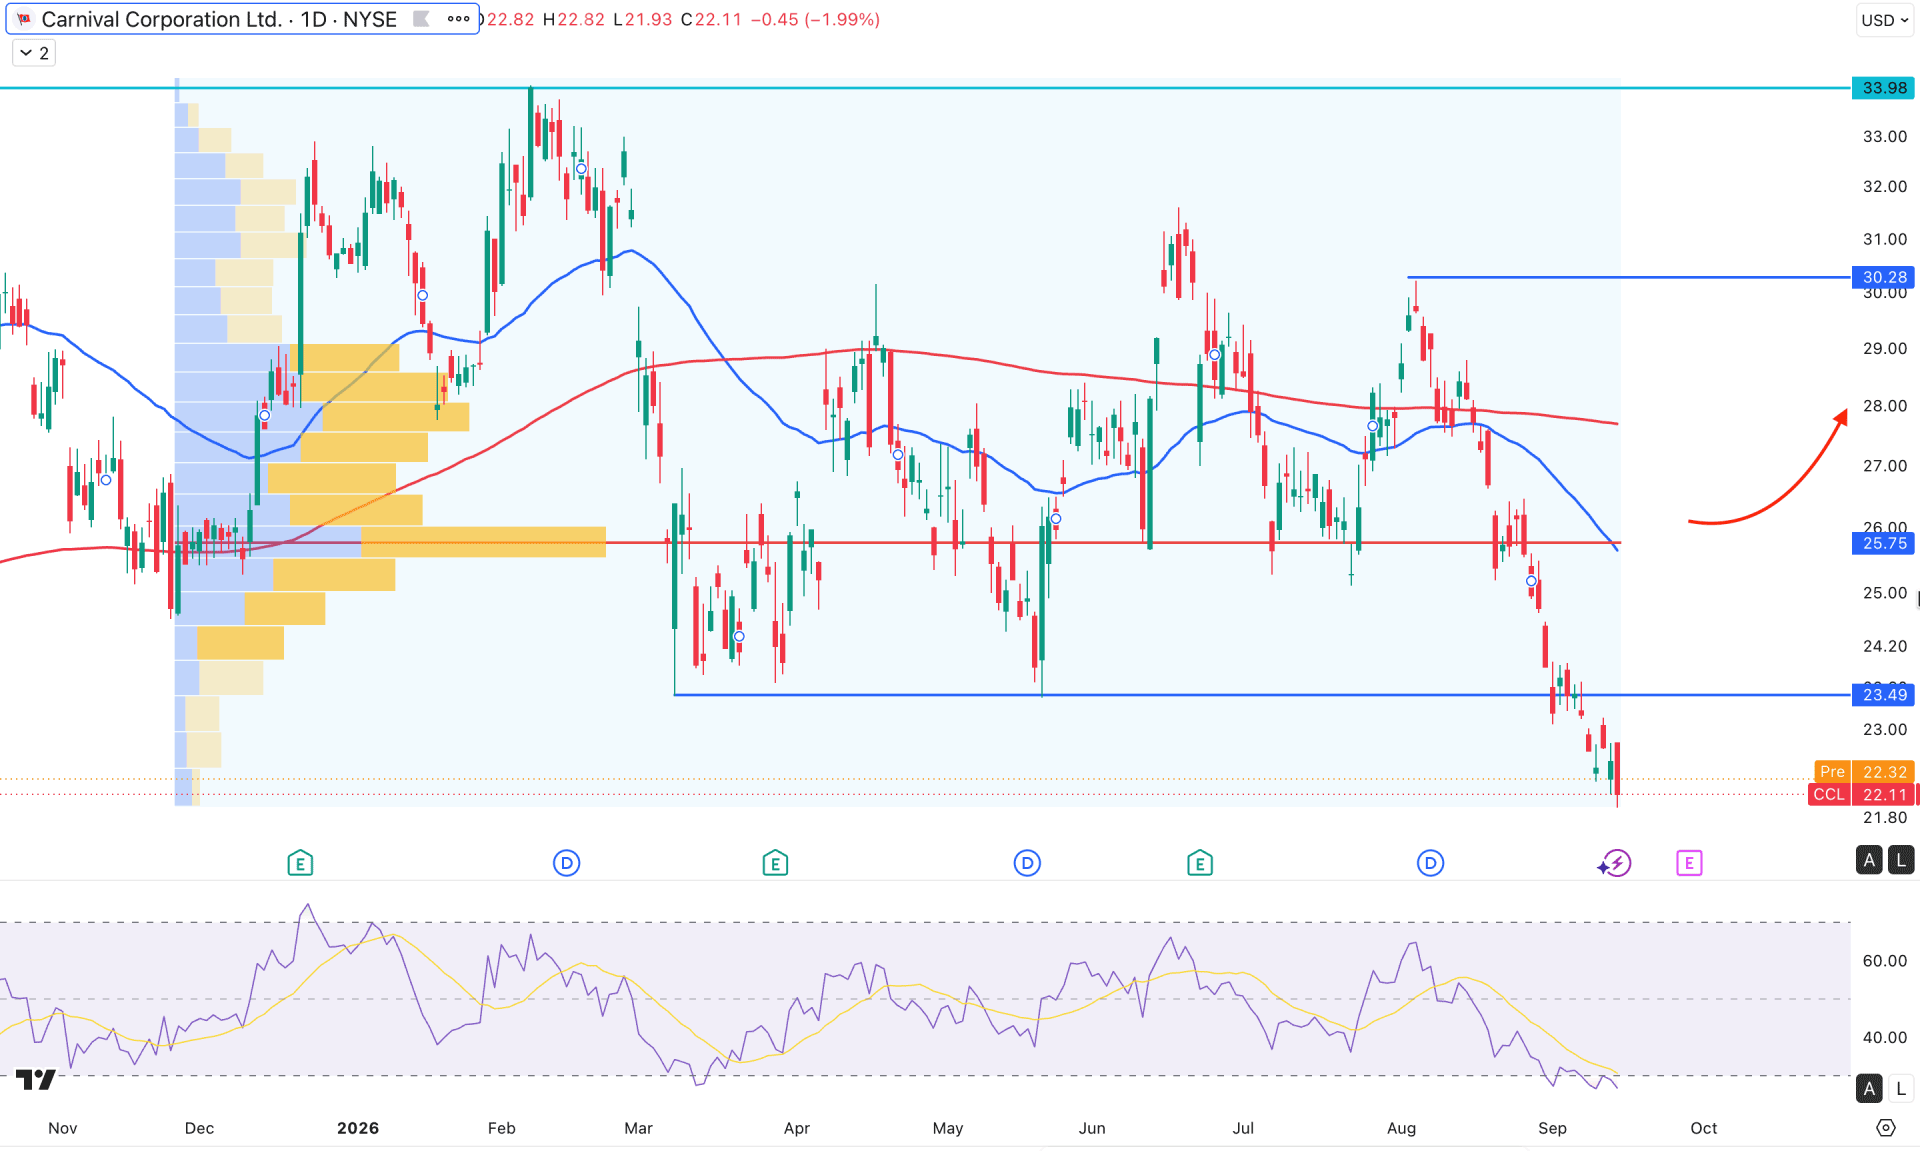
On the daily chart, Carnival stock(CCL) is trading at a deeper discount within a range-bound market. As the existing market momentum is bullish, the current violation of the 23.49 support level could be a liquidity grab before extending the buying pressure. However, the price is still below the range low. Therefore, sufficient confirmation is needed before anticipating a bullish rebound.
Looking at the higher timeframe, the existing market momentum is extremely volatile, as multiple indecision candles are visible on the monthly chart. Moreover, the existing monthly close is bearish, eliminating the gains recorded over more than 12 months. The weekly timeframe is also showing a bearish structure, as six consecutive bearish weekly candles are visible.
In terms of volume, sellers are still dominating the price, as the largest activity level seen since November 2025 is at 25.75,, which is above the current price.
Due to extensive selling pressure within the range-bound market, the price is trading at a yearly low, with a bearish crossover formation in the dynamic lines. The 200-day SMA and 50-day EMA are showing bearish push, where the entire structure is above the current price. As it is the first sign of a death-cross formation, a proper validation is still pending after a bullish correction.
In the Relative Strength Index, the price has already reached an extreme bearish condition, as the RSI has reached its lowest level in two years.
Based on this market outlook, the ongoing momentum is bearish on the daily chart, creating a new swing low below the existing 23.49 support level. As the gap between the high-volume resistance at 25.75 and the 50-day EMA has expanded, it is creating the possibility of a decent bullish correction.
On the bullish side, a recovery of buying pressure above the 23.49 level could be the first sign of a bullish continuation, but proper validation might come after overcoming the 25.75 level. The resistance level to watch is 30.28,, and overcoming this line could increase the possibility of moving beyond the 33.98 level.
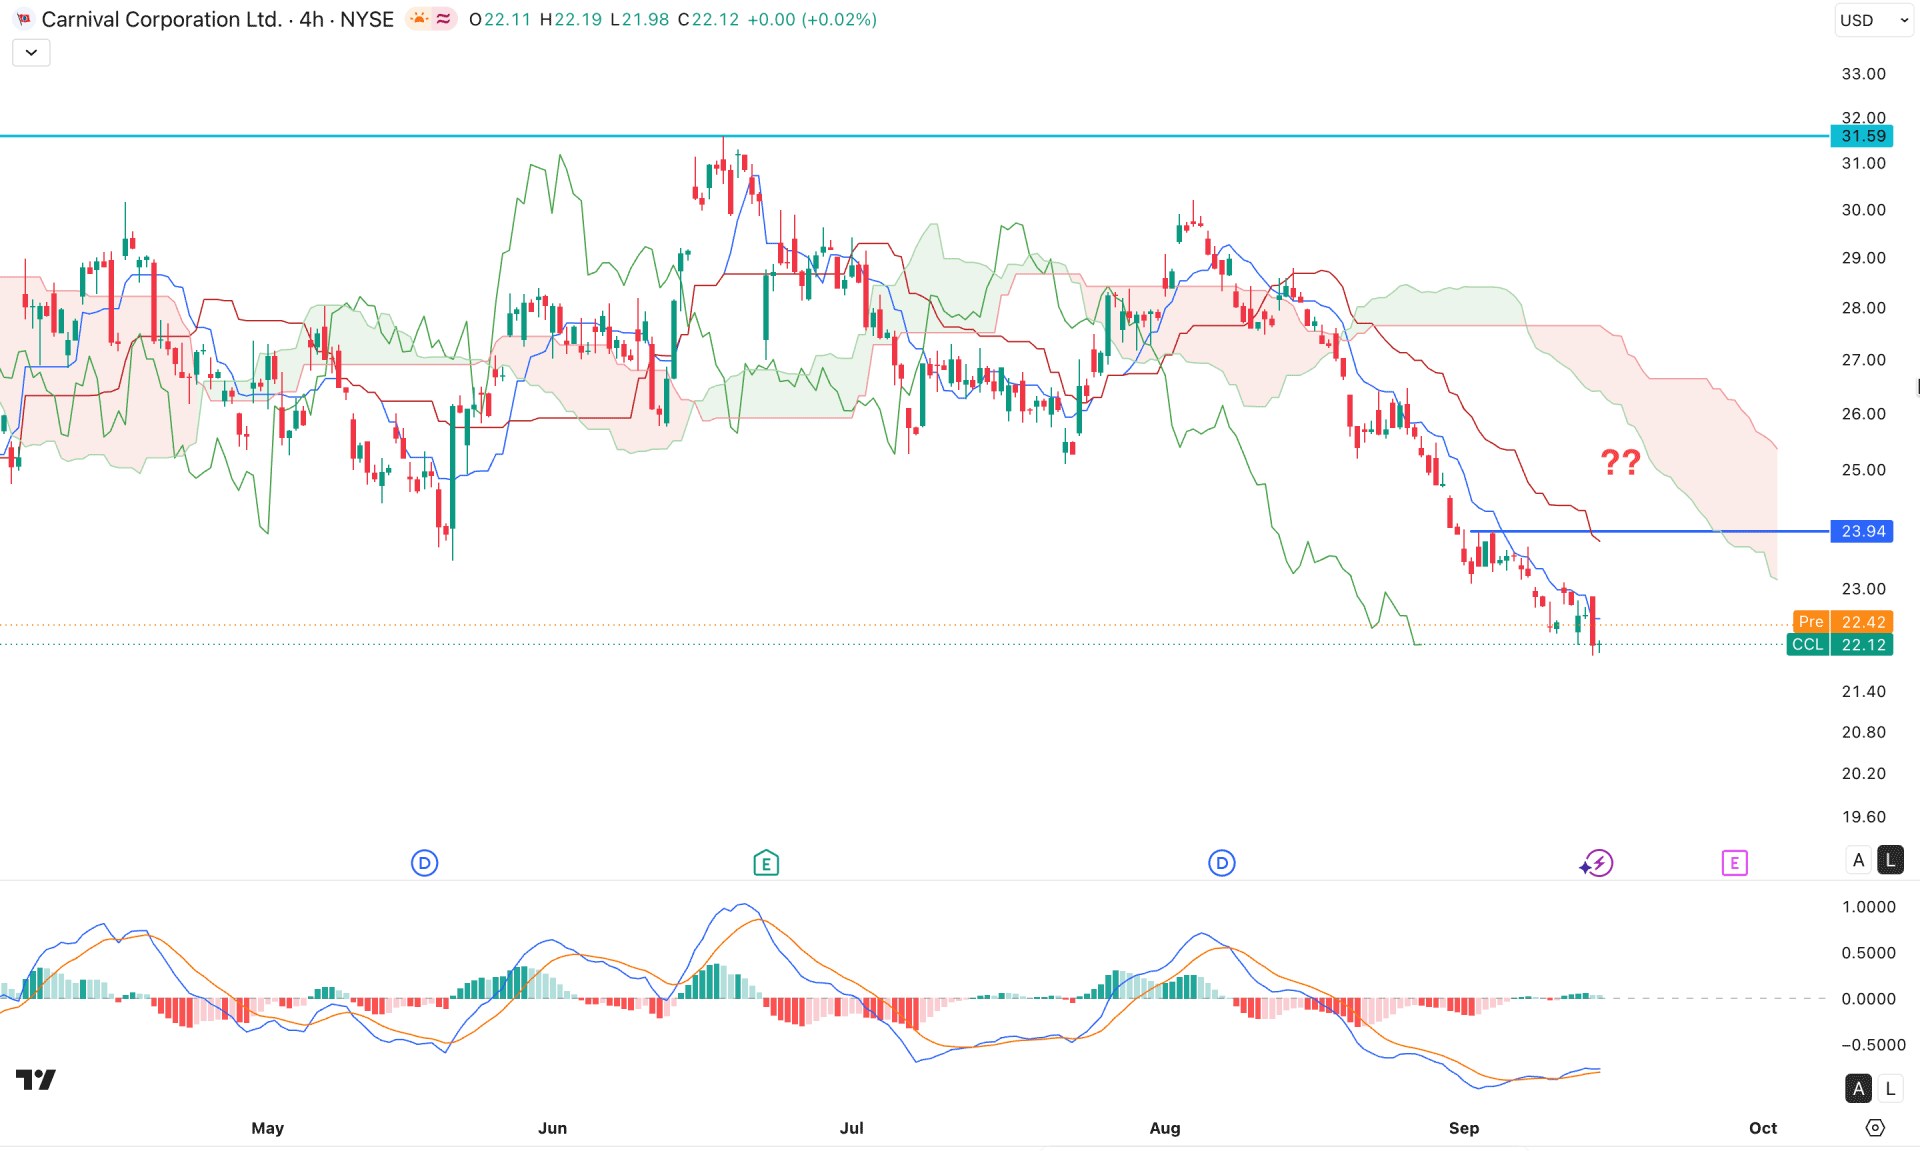
In the four-hour timeframe, CCL stock has been trading below the Ichimoku Cloud for a considerable period, signaling active bearish pressure. As it is below the cloud, the future cloud has started to move downward, creating a gap that signals strong downside momentum.
However, the MACD indicator shows a different story, creating a possible bullish rebound point. Although the price keeps moving down, the signal line failed to maintain the bearish momentum and formed a divergence. Moreover, the Histogram rebounded above the neutral area and is moving higher with positive momentum.
Based on the four-hour structure, the price is trading within a bearish continuation structure and is likely to form a new swing low. However, the downside pressure remains valid as long as it trades below the 23.94 swing-high level.
A recovery above this line could initiate a moderate correction and test the 30.20 resistance line before offering another trading opportunity.
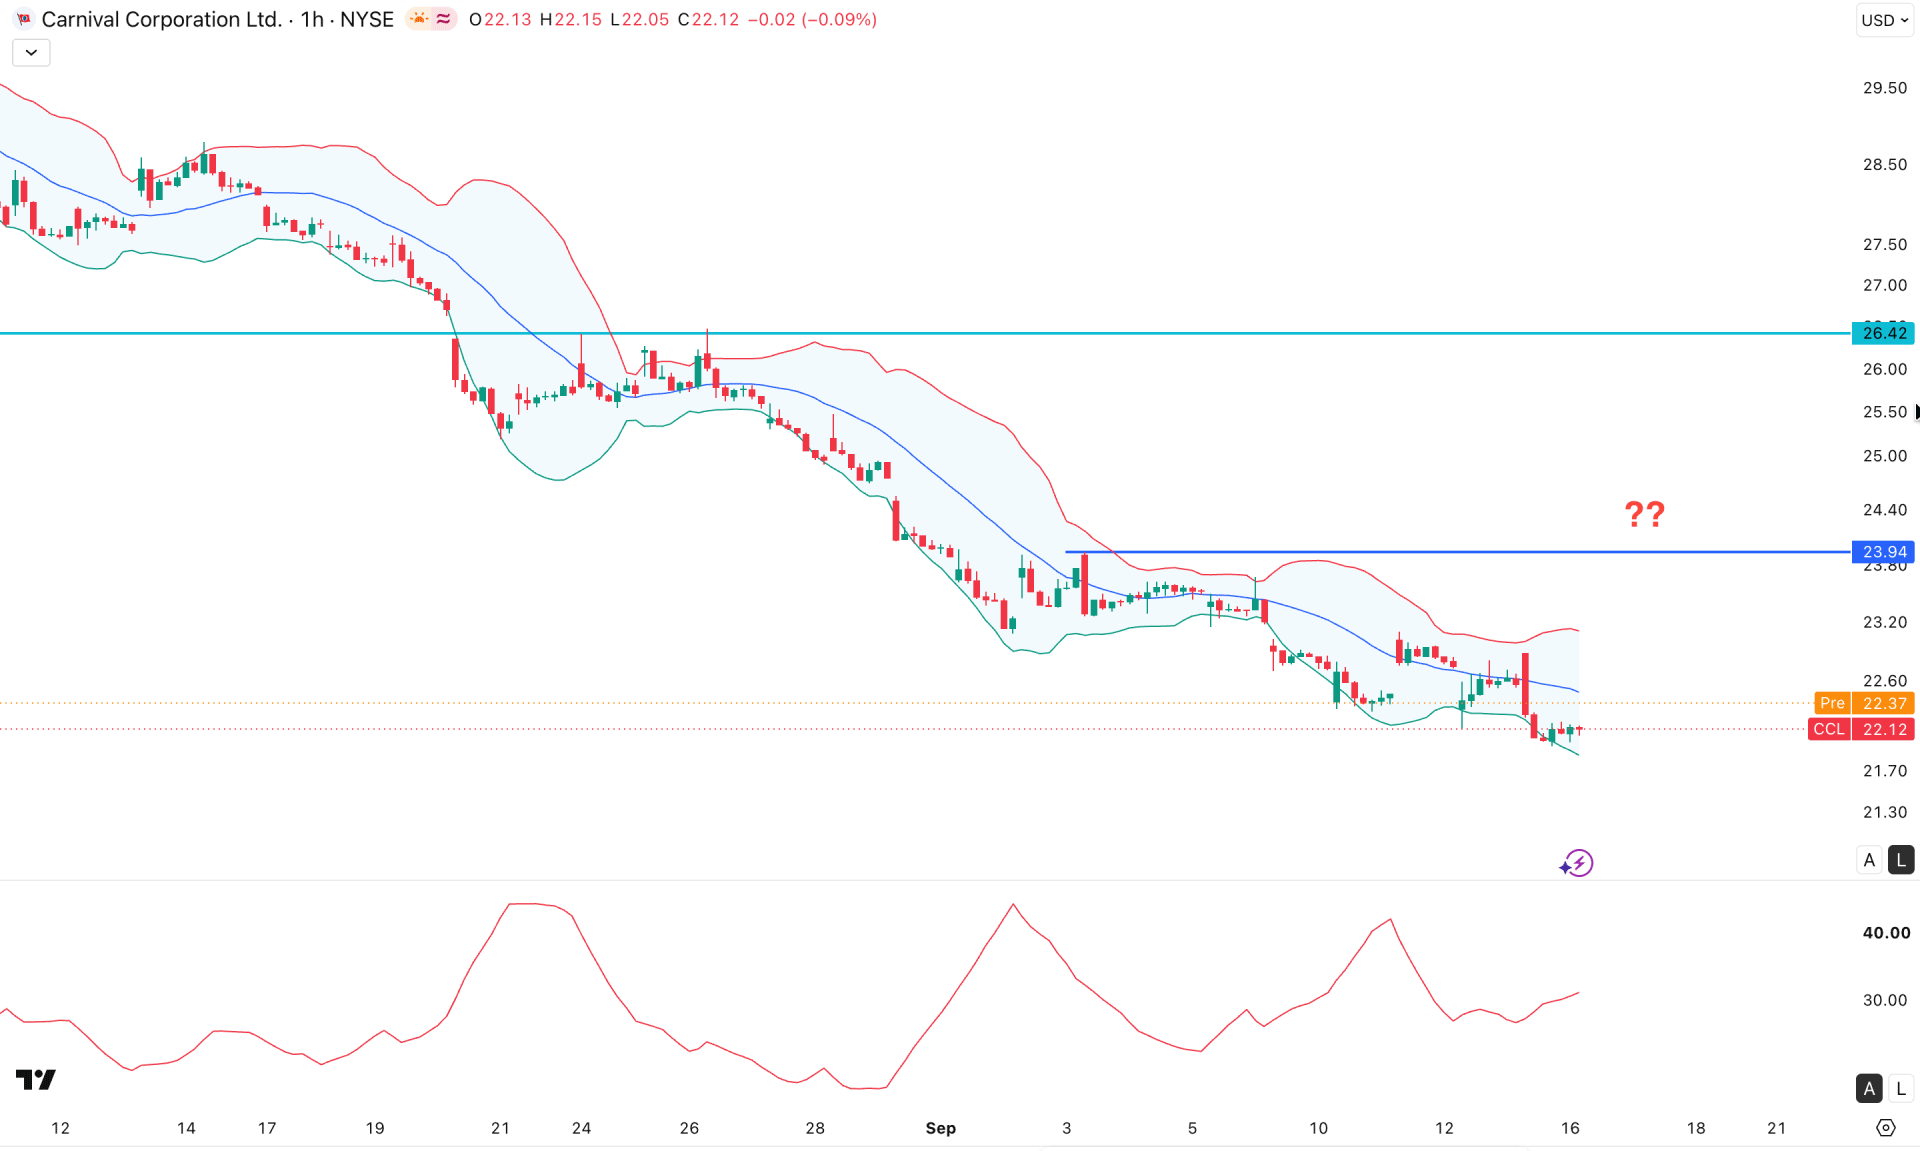
On the hourly timeframe, CCL is trading within a bearish continuation momentum, as the price is testing the lower Bollinger Band with no significant bullish rebound. As a result, the bearish possibility remains valid as long as the price remains below the middle Bollinger Band line.
In the indicator window, the Average Directional Index shows a rebound and has moved above the 30.00 level, signaling a strong trend-trading opportunity.
Based on the market structure, the short-term resistance level to watch is 23.94. As long as the price remains below the 23.94 resistance line, the primary expectation would remain on the sellers' side.
On the contrary, the price is trading in a liquidity zone from the higher timeframe, where sufficient sell-side liquidity is available. In that case, a recovery above the 23.94 level would be the primary sign of a bullish rebound, which might encourage the price to create a new swing high above the 30.17 level.
Based on our market structure, Carnival Corporation stock is trading within a bearish structure. A bullish rebound needs valid confirmation from the key price area. As a bottom has not yet formed and the price is still continuing to push lower below the range support, further bearish movement is possible. Investors should closely monitor the daily chart, as a rebound above the crucial near-term resistance could invalidate the bearish structure at any time.


