
Published: November 16th, 2023
Carnival is anticipated to incur a loss of $0.13 per share for the current quarter, representing an increase of 84.7% compared to the corresponding period last year. Consensus earnings projections for the current fiscal year indicate a value of -$0.07, representing an increase of 98.5% compared to the prior year.
Consensus sales projections for the current quarter of $5.3 billion for Carnival represent a substantial increase of 38.1% year-over-year. Approximate adjustments of +76.6% and +12.9% are indicated for the current and subsequent fiscal years, amounting to $21.49 billion and $24.26 billion, respectively.
The last quarterly results for Carnival revealed $6.85 billion in revenue, an increase of 59.2% year-over-year, and $0.86 EPS, compared to -$0.58 the previous year. The results surpassed analysts' estimates of $6.72 billion, as revenue and earnings per share unexpectedly increased by 2.06% and 17.81%, respectively. In the past four quarters, Carnival has outperformed consensus EPS estimates consistently and revenue estimates on three separate occasions.
In other metrics, Return on Equity is coming to the positive zone, where the latest quarterly report shows an improvement from -49 to -21. Moreover, the short-term current and quick ratio shows a positive sentiment, while the debt to equity of 4.69 suggests that the company has more business expansion opportunities.
Let’s see the upcoming price direction based on the CCL technical analysis:
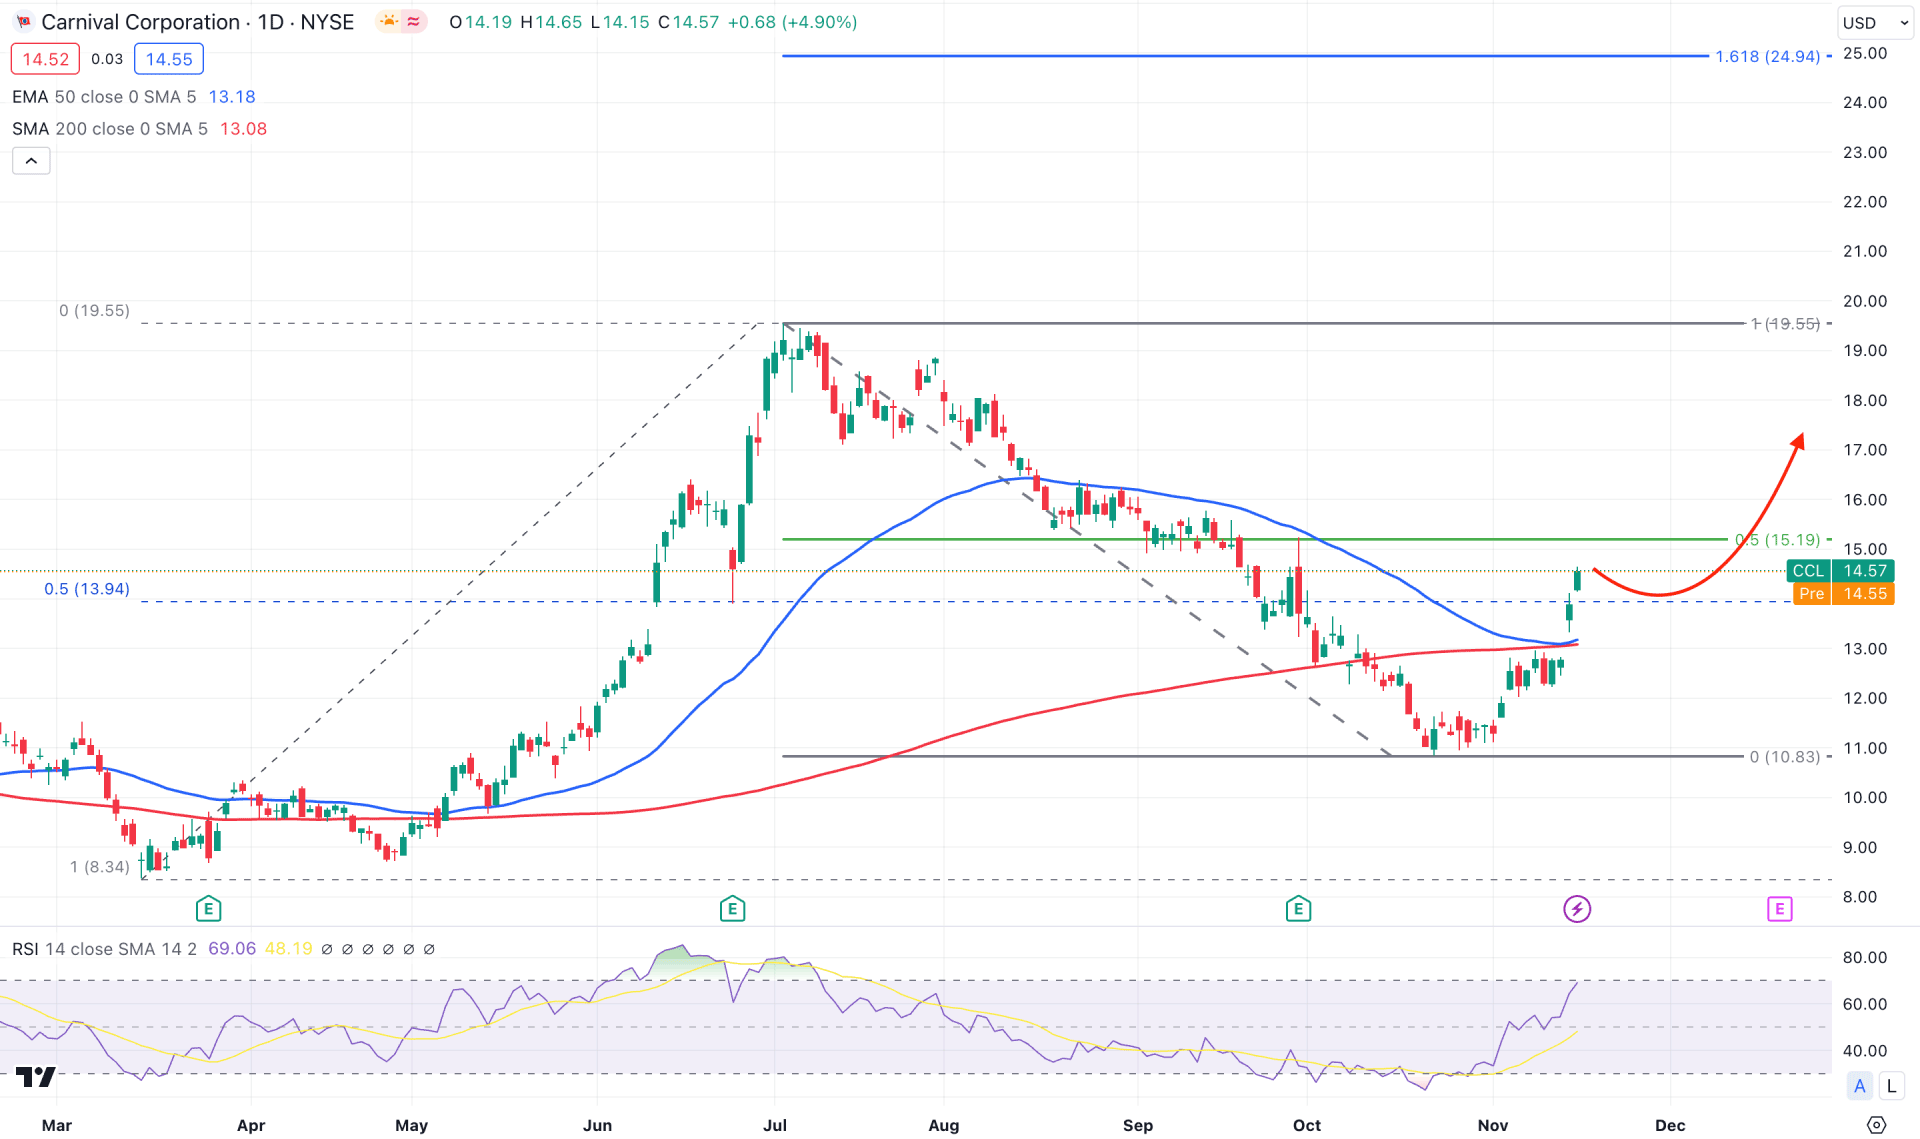
In the daily price of CCL, the recent price shows sufficient downside correction and found support at the 10.83 static level. As bulls have formed a strong recovery from the bottom and had a daily close above the dynamic 200 SMA, we may consider the upcoming price direction bullish.
The monthly candle indicates a bullish range breakout and retest in the higher timeframe, while the weekly price is strongly bullish with a descending channel breakout. Therefore, as long as the price trades above the weekly channel support, we may consider it a stable trend.
In the daily chart, the 50-day EMA approached the 200-day SMA but rebounded immediately. As the current price is above these crucial dynamic levels, investors might expect a bullish possibility from any Golden Cross continuation strategy.
In the secondary window, the 14-day RSI is above the 50.00 line and yet to move above the 70.00 overbought level.
Based on the daily outlook of CCL, a minor bearish correction and an additional bullish rejection from the 50 EMA could be a long signal. In that case, the primary target would be to test the 19.55 swing high. Moreover, a stable market above the 19.55 high could extend the gain towards the 24.94 level, which is the 161.8% Fibo extension level from the current swing.
On the bearish side, if the 50 EMA moves below the 200-day SMA, it would form a death cross. In that case, a bearish daily candle below the 50 EMA could be a short opportunity, targeting the 6.11 low.
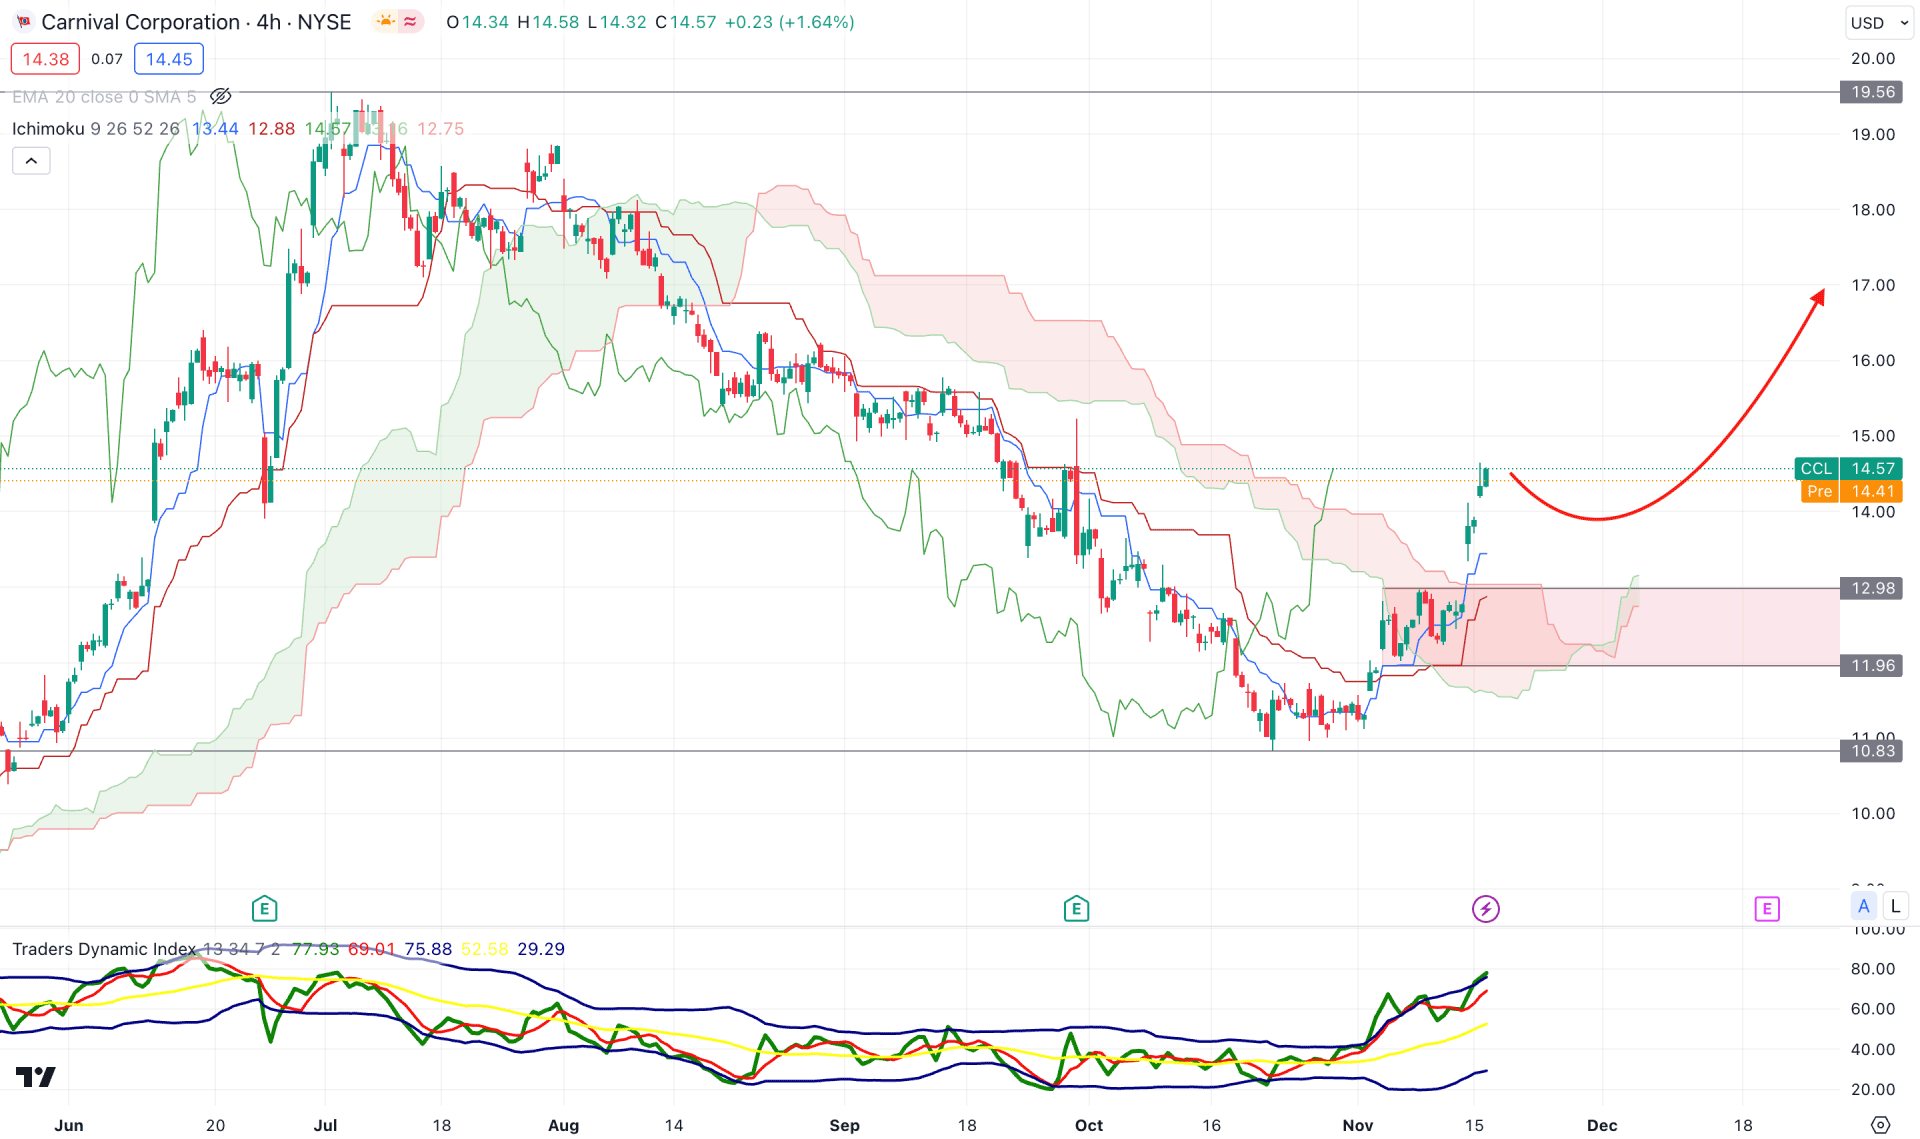
The H4 chart shows a bullish trend change with an Ichimoku Cloud breakout. Moreover, the future Cloud is bullish, as both lines show an upward direction.
The ongoing bullish trend is visible in the secondary window as the Traders Dynamic Index (TDI) remains steady above the 50.00 line.
Based on this structure, a minor downside correction is possible towards the 12.98 to 11.96 demand zone. In that case, a downside correction and an additional bullish rejection from the dynamic Kijun Sen could be a long signal targeting the 20.00 psychological level.
On the bearish side, extensive selling pressure below the 11.96 level is needed, but a daily candle below the 10.83 low would invalidate the long signal.
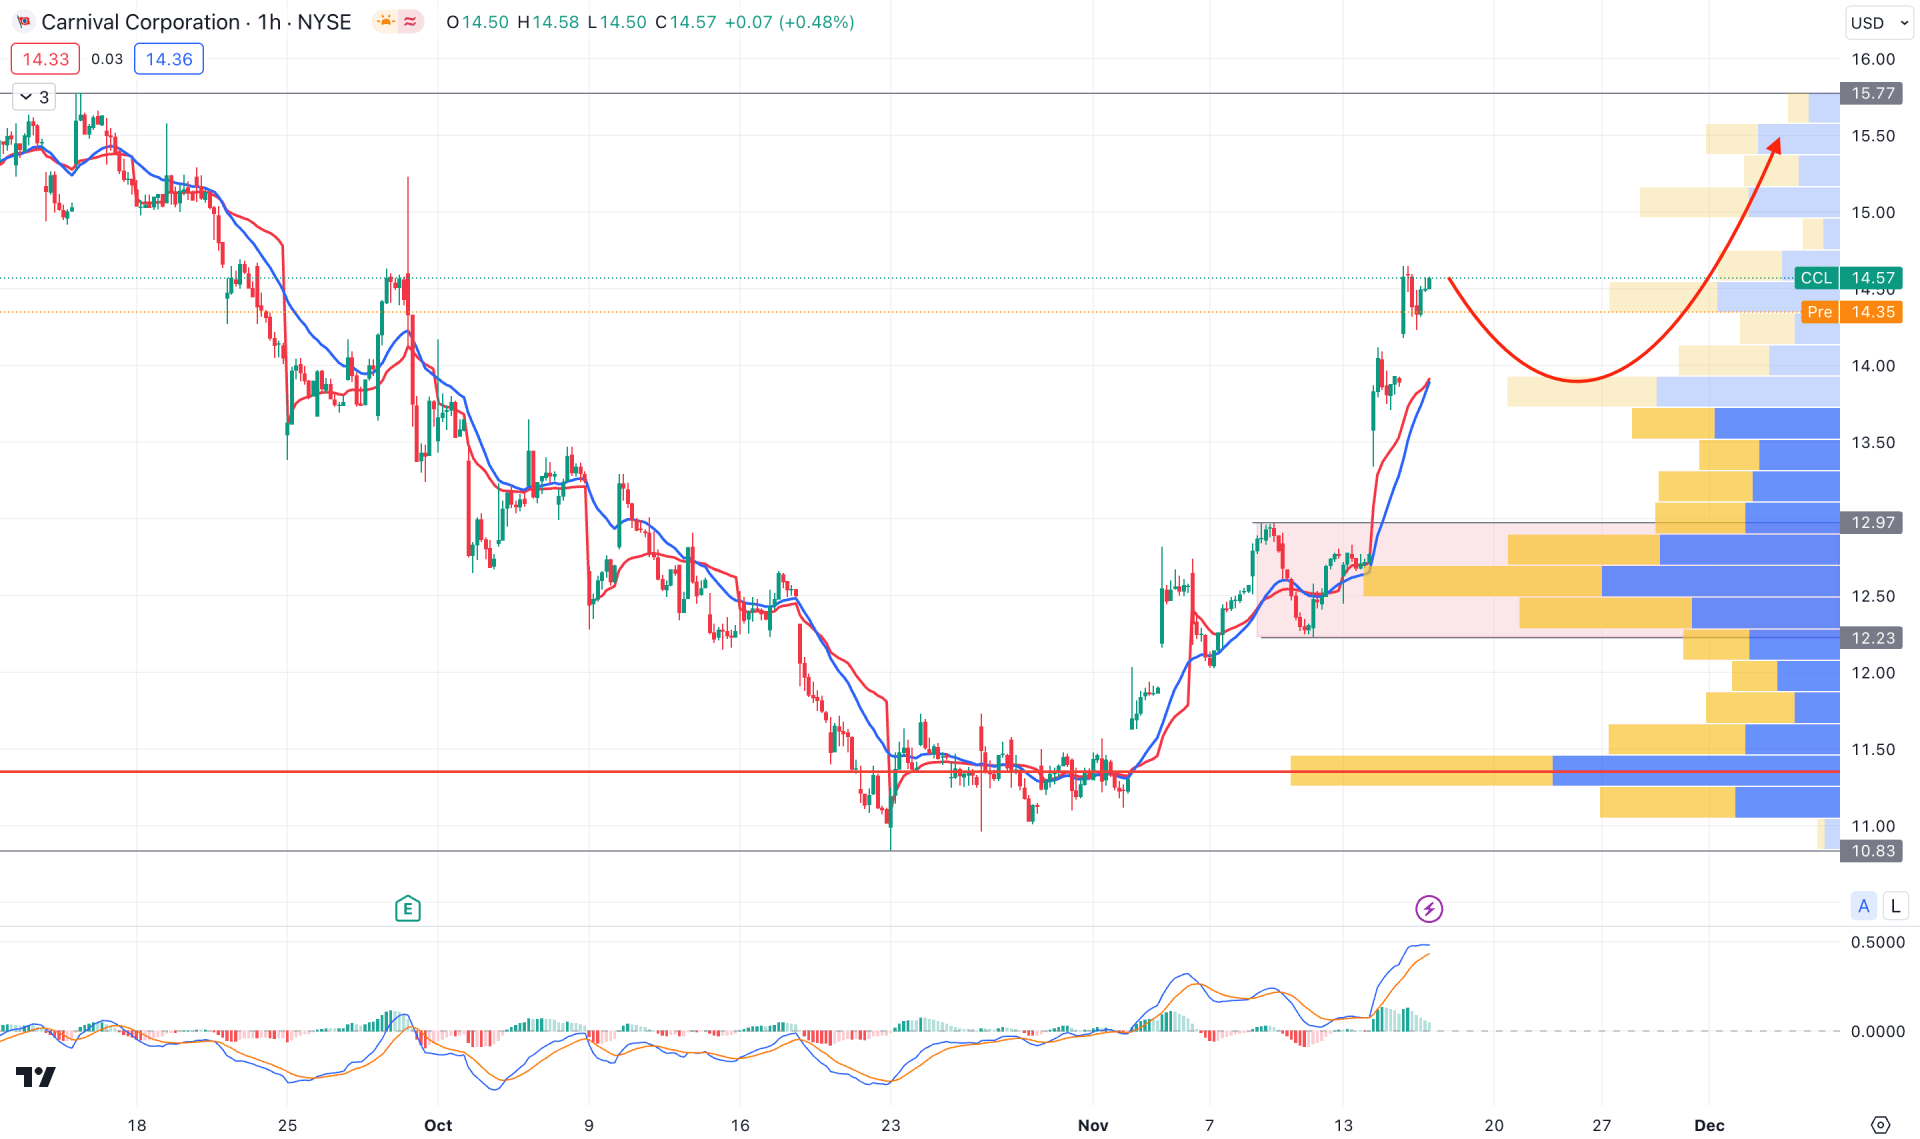
In the H1 timeframe, the overall market momentum is bullish as the current price trades above the visible range high volume level. Moreover, the upward pressure from the 10.83 bottom came with a rally-base-rally formation, where the 12.97 to 12.23 level would be a strong buyers zone.
In the indicator window, the MACD Histogram started to lose momentum while the Signal line was above the neutral level.
Based on this structure, investors might see immediate bullish pressure after the market opens, which can increase the price towards the 16.00 level. However, a downside correction and additional buying pressure could come from the 12.97 to 11.00 area.
On the other hand, breaking below the 11.00 psychological level could be a short opportunity, targeting the 6.00 level.
Based on the market structure of CCL, the bullish continuation is potent as it trades at the long-term discounted zone. However, investors should closely monitor the intraday chart to find the best area for taking a long trade.


