Published: June 26th, 2024
Carnival Corporation (CCL) shares experienced a significant increase in intraday trading on Tuesday due to the cruise operator's unexpected quarterly profit and the subsequent increase in its guidance.
The company's second-quarter adjusted earnings per share (EPS) of $0.11 exceeded analysts' expectations of a $0.02 loss per share. Revenue increased by 17.7% to $5.78 billion, surpassing expectations. Revenue, operating income, adjusted earnings before interest, taxes, depreciation, and amortization (EBITDA), and booking levels were all set at records in the second quarter. Furthermore, the total customer deposits attained an all-time high of $8.3 billion.
Carnival attributed the strong results to the timing of expenses between quarters, increased onboard expenditures by passengers, and higher ticket prices.
According to CEO Josh Weinstein, the organization anticipates "an ongoing surge in demand for 2025 and beyond." Carnival anticipates a full-year adjusted EBITDA of $5.83 billion, representing a $200 million increase from its previous projection.
Carnival anticipates a 6.2% year-over-year increase in capacity and an adjusted EPS of $1.15 for the fiscal third quarter, which is higher than the $1.11 per share anticipated by analysts.
Carnival substantially increased its adjusted EPS forecast for the fiscal year 2024 from $0.98 per share to $1.18.
The upbeat quarterly report with a positive outlook could signal a decent buying opportunity for this stock. However, the more precious outlook might come from the CCL multi-timeframe analysis:

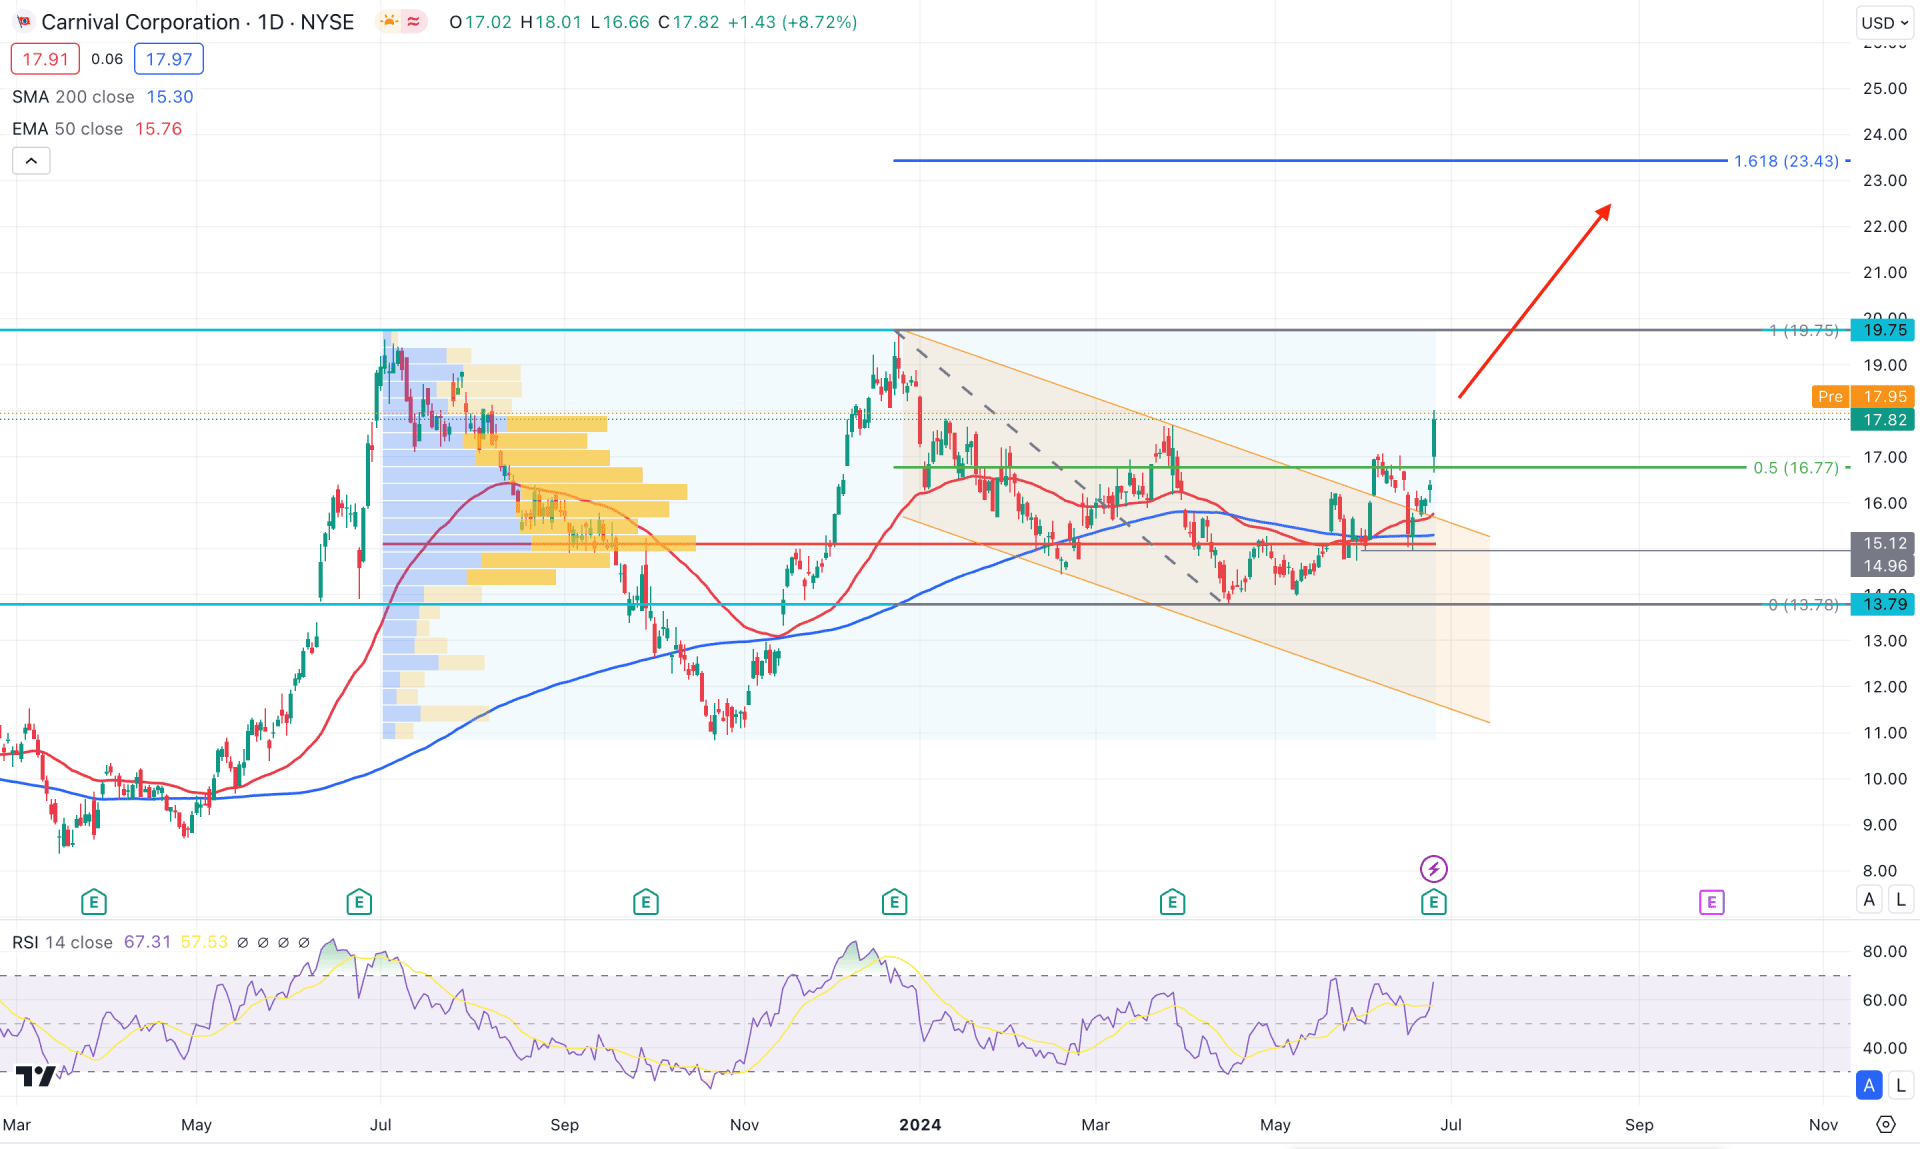
In the daily chart, Carnival stock (CCL) showed a decent channel breakout, supported by rising moving averages and upbeat earnings reports. Investors should closely monitor how the price trades in the intraday chart, which might validate the long-term bullish opportunity.
In the higher timeframe, the weekly price is consolidated within a bullish pennant and the current price trades above the pennant resistance. Moreover, the monthly candle shows a bullish continuation, taking the price above four months' high.
In the volume structure, institutional activity is seen on the buyers' side as the current high volume level since July 2023 is below the current price. Moreover, the current price shows an impulsive buying pressure, which might indicate an additional buying pressure in the main price.
In the main price chart, the 200-day Simple Moving Average is below the 50-day EMA, while both MA lines are below the current price. It is a sign that the buying pressure is potent, and a Golden Cross continuation strategy could work as a trading opportunity.
In the indicator window, the current Relative Strength Index (RSI) showed a rebound from the 50.00 level and reached the peak at the 70.00 overbought zone.
Based on CCL's daily market outlook, a bullish continuation is highly possible. The main aim is to test the 23.43 level, which is the 161.8% Fibonacci Extension level from the immediate swing. Moreover, a bullish daily candle above the 19.75 level with a consolidation could signal a bullish accumulation, extending the buying pressure above the 30.00 psychological level.
On the bearish side, a failure to move above the 19.75 resistance level with a bearish exhaustion could signal selling pressure. In that case, a downside continuation below the high volume line could lower the price below the 6.17 level.

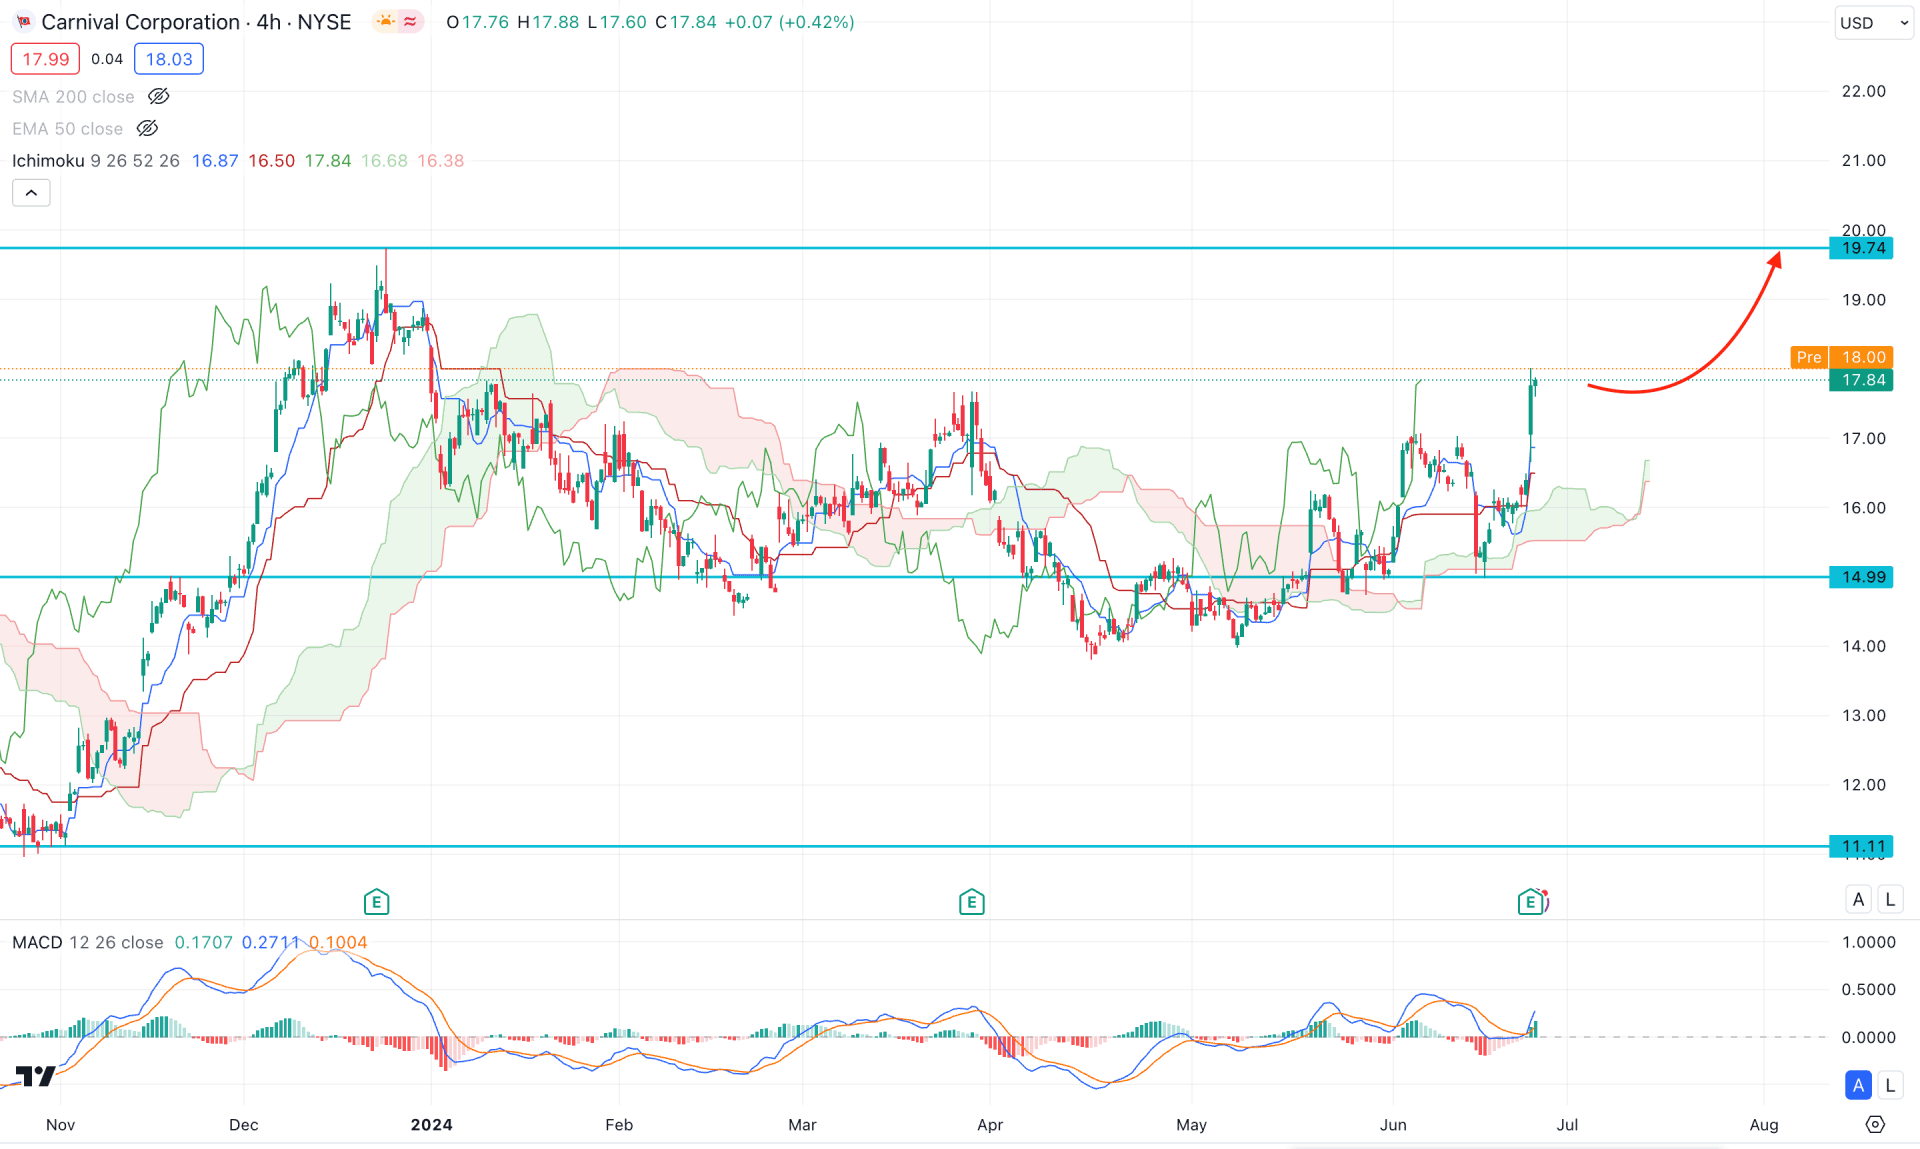
In the H4 timeframe, the current price is trading above the Ichimoku Cloud level, indicating a stable bullish recovery. In the future cloud, the Senkou Span A and Senkou Span B aimed higher, signaling an active buying pressure in the market.
In the indicator window, the MACD Indicator suggests a buying pressure where the current Histogram is stable above the neutral level. Moreover, the Signal line failed to break below the zero point and became flat.
Based on this outlook, the upward continuation is solid as long as the current price trades above the dynamic Kijun Sen level. In that case, the primary target for the bullish continuation is the 19.74 level. A bullish break above this line could extend the buying pressure above the 20.00 area.
On the bearish side, a decent correction might happen toward the Ichimoku Cloud support. However, a break below the 14.99 support level could be an alarming sign to bulls, which might lower the price below the 11.11 support level.

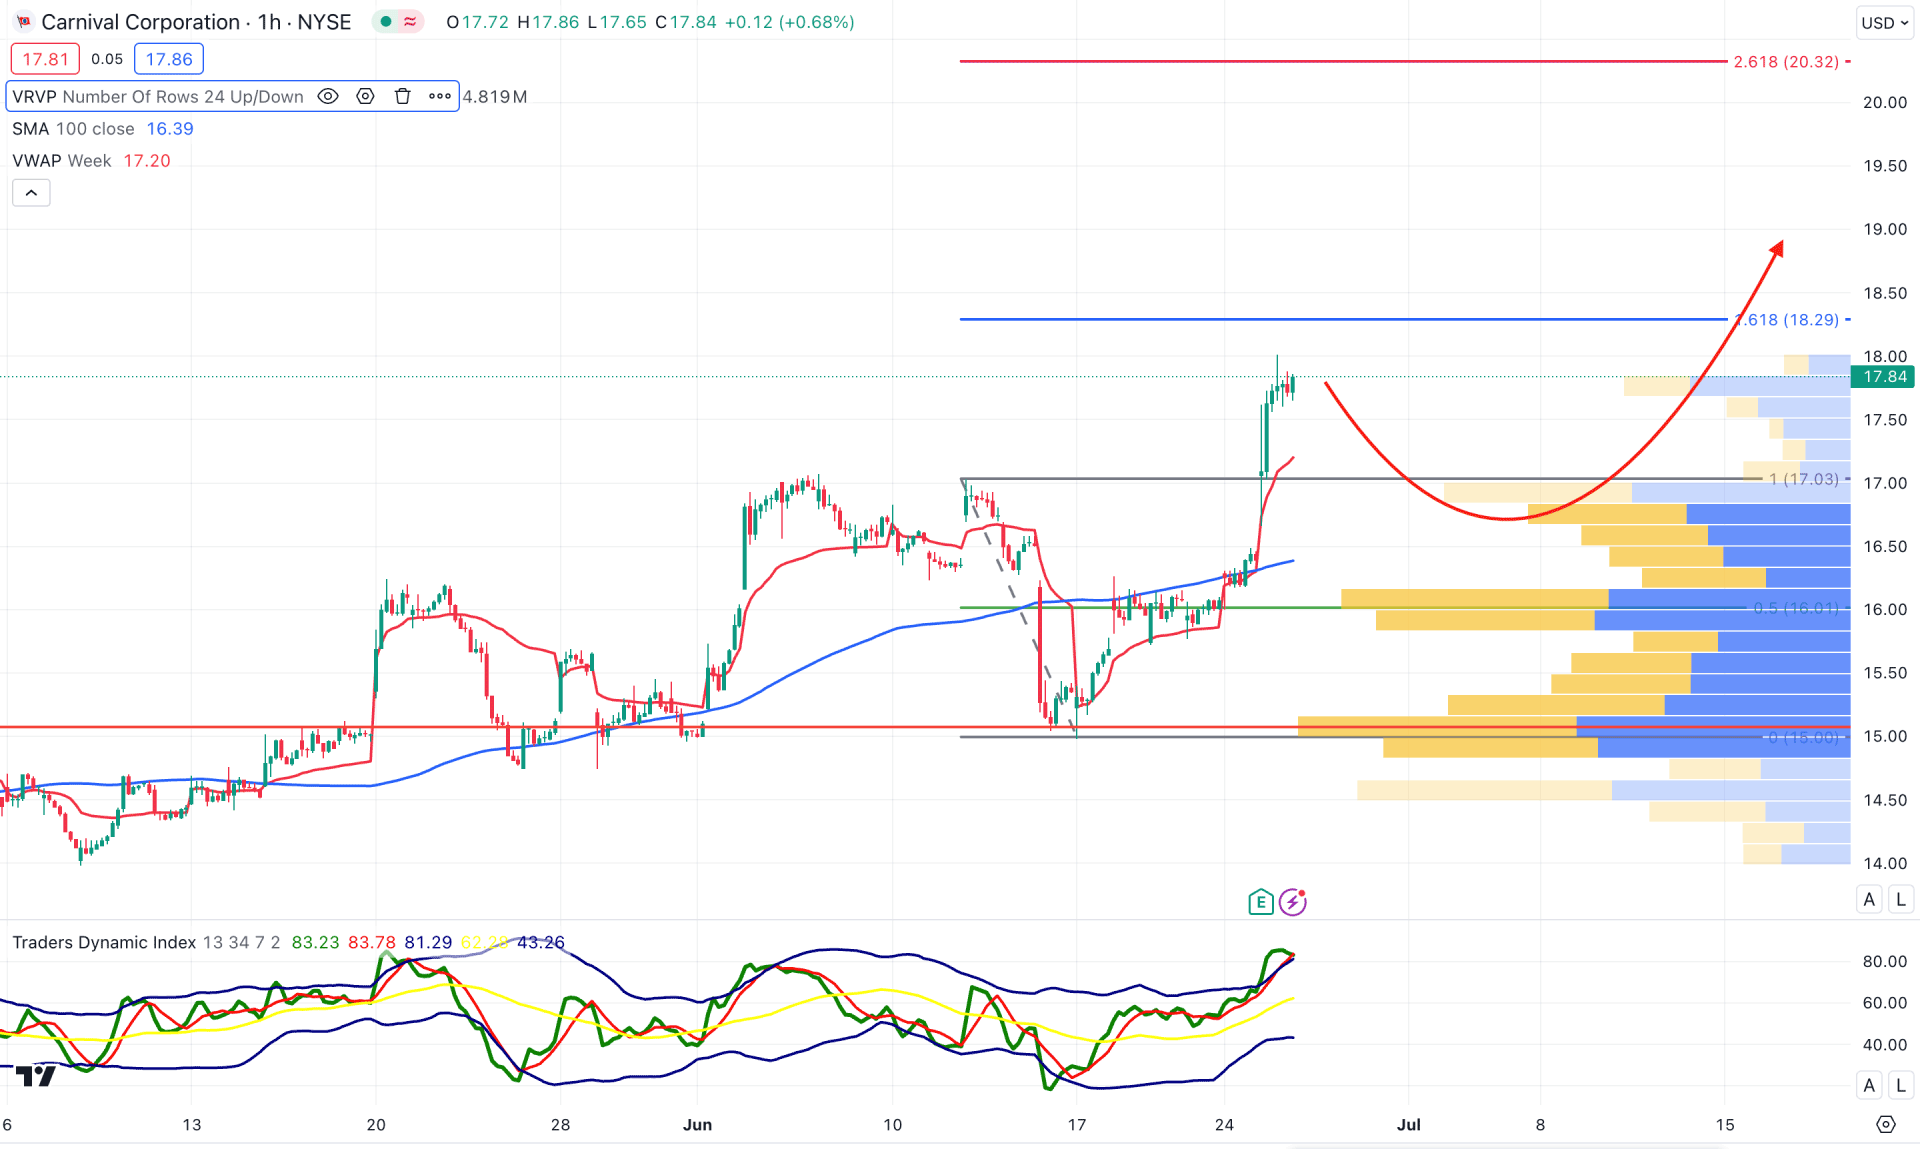
The recent price is already at the intraday high in the hourly time frame due to the upbeat quarterly earnings report, which might signal a decent bullish trend continuation after a considerable correction.
The ongoing buying pressure is overextended above the 100 SMA line and visible range high volume level, suggesting a pending downward correction. The traders' Dynamic Index (TDI) shows the same outlook. The current level is in the upper bands' area, signaling active buying pressure.
Based on the H1 structure, any bullish rejection from the 17.03 to 15.00 area could be a decent long opportunity, targeting the 18.29 level. However, an immediate bearish counter impulsive pressure with an hourly close below the 16.00 level could lower the price towards the 14.00 psychological level.
Based on the ongoing buying pressure, CCL is more likely to extend the buying pressure, aiming for the 20.00 level. The daily price has already shown a bullish breakout, which might offer adding positions from the intraday price.