Published: May 6th, 2021
Cardano (ADA) showed a remarkable recovery from the 2018 crypto market crash that took almost 99% of its early gain. Later on, positive fundamental news regarding the Cardano ecosystem gathered investors’ sentiment. As a result, the price started to move higher from the 2020 low of 0.0184 and made an all-time high at 1.5587.
Cardano founder Charles Hoskinson said that they want to focus on the NFT marketplace. They have already negotiated with some prominent NFT marketplaces about porting Cardano into it.
However, the key point of investors will be how the Cardano smart contracts update facilitates developers in the creation of auctions, crowdfunding, and NFTs. Despite the strong bullish pressure, the price became volatile near the all-time high of 1.5587. So, what might happen in the future? Let’s see the price direction from the Cardano technical analysis:
Since the beginning of 2021, Cardano continued its bullish pressure with a massive speed and became volatile from March. Therefore, the excessive volatility after a long bullish run is a primary indication of price reversal.
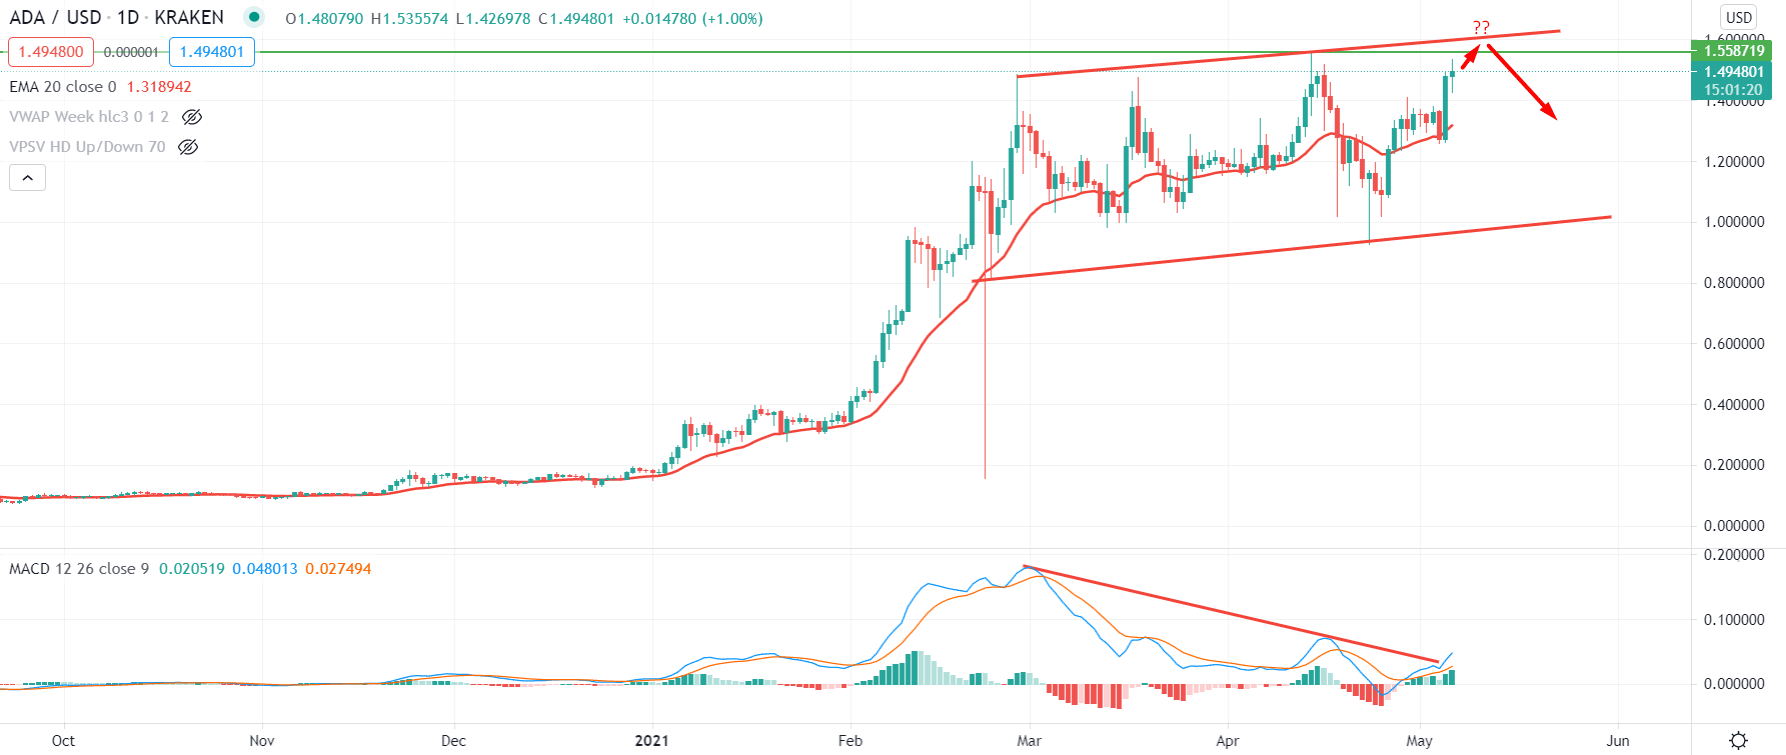
In the above image, we can see the daily chart of Cardano, where the price made an all-time high on 14 April 2021 and moved to the channel support at 0.925. Later on, the price moved higher and remained stable above the dynamic level of 20 EMA. Moreover, the price was carried by the dynamic level and made a strong bullish daily close.
Therefore, the price has a higher possibility to break above the all-time high and test the 1.600 psychological level. Moreover, the bullish daily close above 1.60 level may take the price higher towards 1.950 level, the 161.8% Fibonacci Extension level of 14 March high to 23 April Low.
On the other hand, the price is near the channel resistance with a potential regular divergence with MACD. Therefore, if the price fails to break above the 1.600 level and make a strong bearish daily close below it, we expect the current correction to extend towards the 1.000 level.
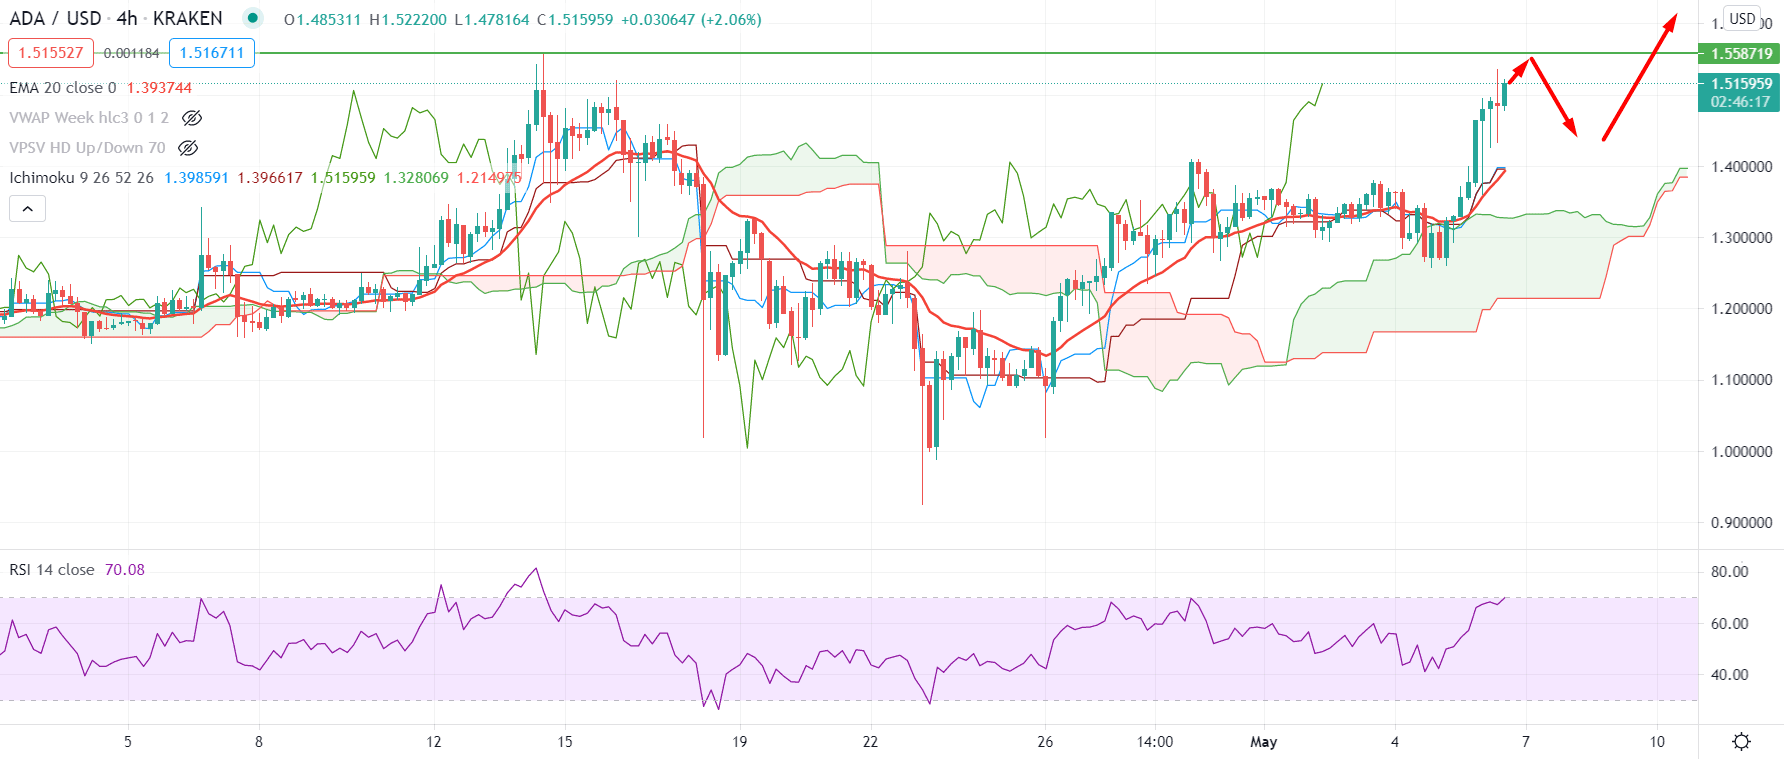
According to the Ichimoku Kinko Hyo in the H4 timeframe, the price is trading above dynamic Tenkan Sen and Kijun Sen, where the future cloud became thin. As a result, if the price rejects the 1.5587 level, it may come lowers towards the Kumo Cloud support at 1.3200.
We can see that the price moved above the Kumo Cloud tested the cloud support before moving higher in the above image. However, based on the most recent candles, the price is volatile and just below the 1.5587 all-time high. Moreover, the RSI moved above the 70 levels and is aiming higher.
As a result, any bullish rejection from 1.5580- 1.600 level with a bearish H4 close may take the price down towards 1.3200 support level in this market condition. Otherwise, a strong break above the 1.600 level may extend the price higher towards 1.700 even 1.900.
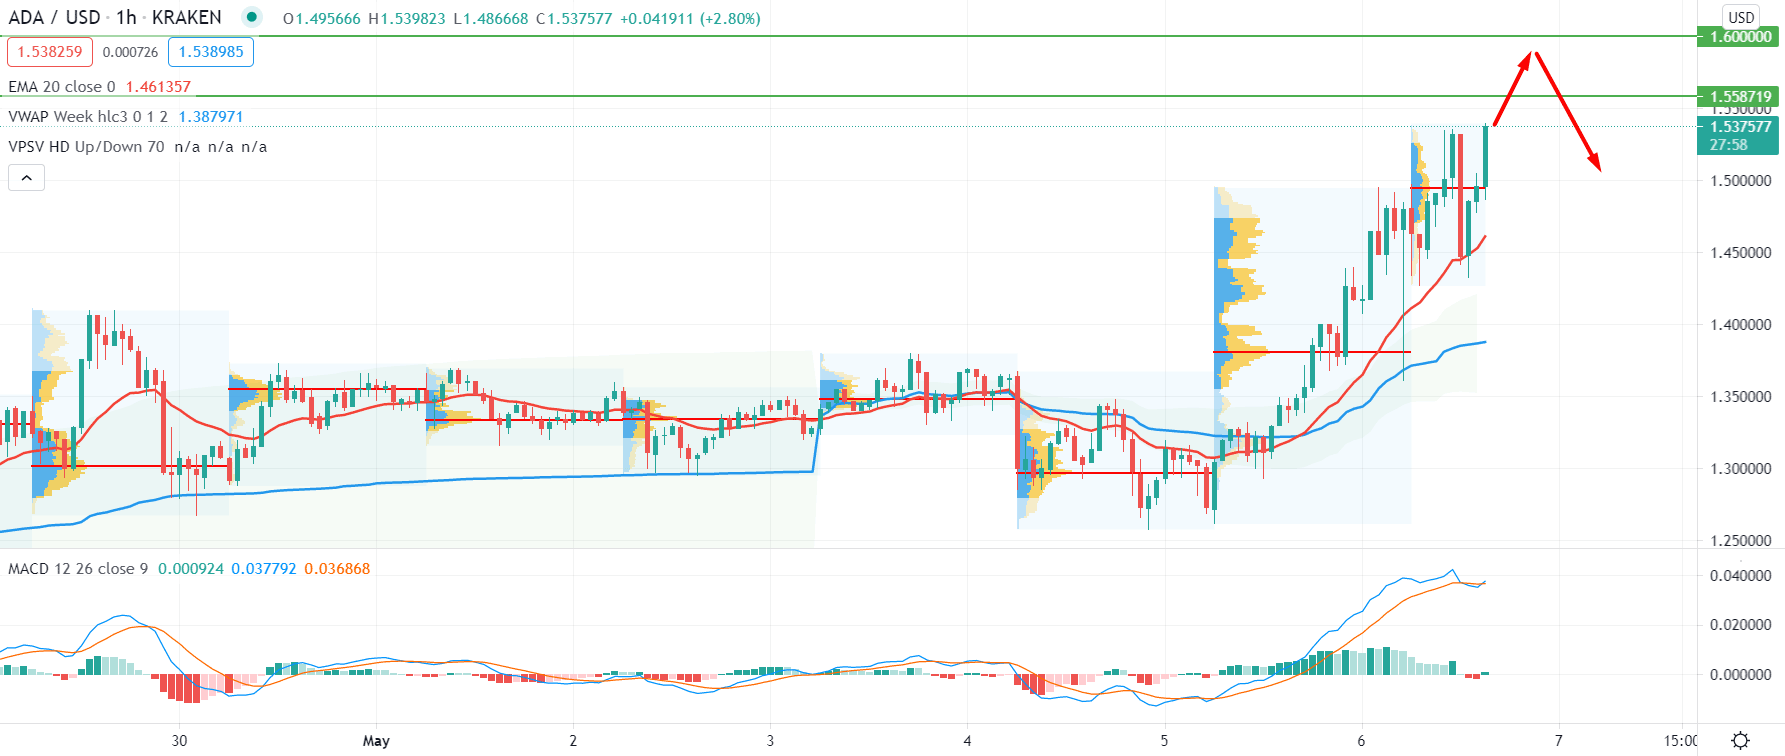
In the H1 timeframe, the price is trading above the intraday high volume level of 1.500. Therefore, as long as the price is trading above the 1.500 level, we may expect more bullish pressure.
We can see the ADA H1 chart in the above image, where the price is trading above the dynamic 20 EMA and vwap. The price tried to break below the 1.500 level in the recent chart but failed to sustain due to the 20 EMA carry.
The overall condition in the intraday chart shows a strong bullish possibility in the chart that may take the price towards a 1.600 psychological level. On the other hand, a strong H1 close below the 1.500 high volume level may invalidate the current bullish pressure. In that case, the primary target would be 1.320 cloud support.
As of the above discussion, we can say that the Cardano (ADA) has a higher possibility to continue the bullish pressure towards 1.600 psychological level. However, a strong bearish daily close with intraday selling pressure below the 1.500 level may alter the current market structure with the target of 1.00.


