
Published: January 28th, 2026
Canton Network continues to garner attention as institutional funding for crypto adoption showed positive signs.
The Canton Network cryptocurrency ecosystem is intended to serve as an institutional financing platform that combines scalability, privacy, and adherence in a framework that is both public and permissioned.
Notably, Canton Network's reputation as a settlement-quality blockchain has been bolstered by public remarks from significant financial and blockchain technology actors.
Canton Network aims to overcome delivery failures, excess posts, and excessive trade operational expenses that continue to plague off-chain platforms by providing real-time on-chain collateral movement.
Collateral may be financed, utilized, and optimized intraday thanks to Canton Network's rapid delivery versus settling payments. Capital that had been imprisoned overnight can therefore continue to be productive.
Instead of batch-based uncertainty, this change promotes continuous precision, afterwards collateral mobility, and intraday repo markets.
Let's see the upcoming price direction of this coin from the technical analysis:
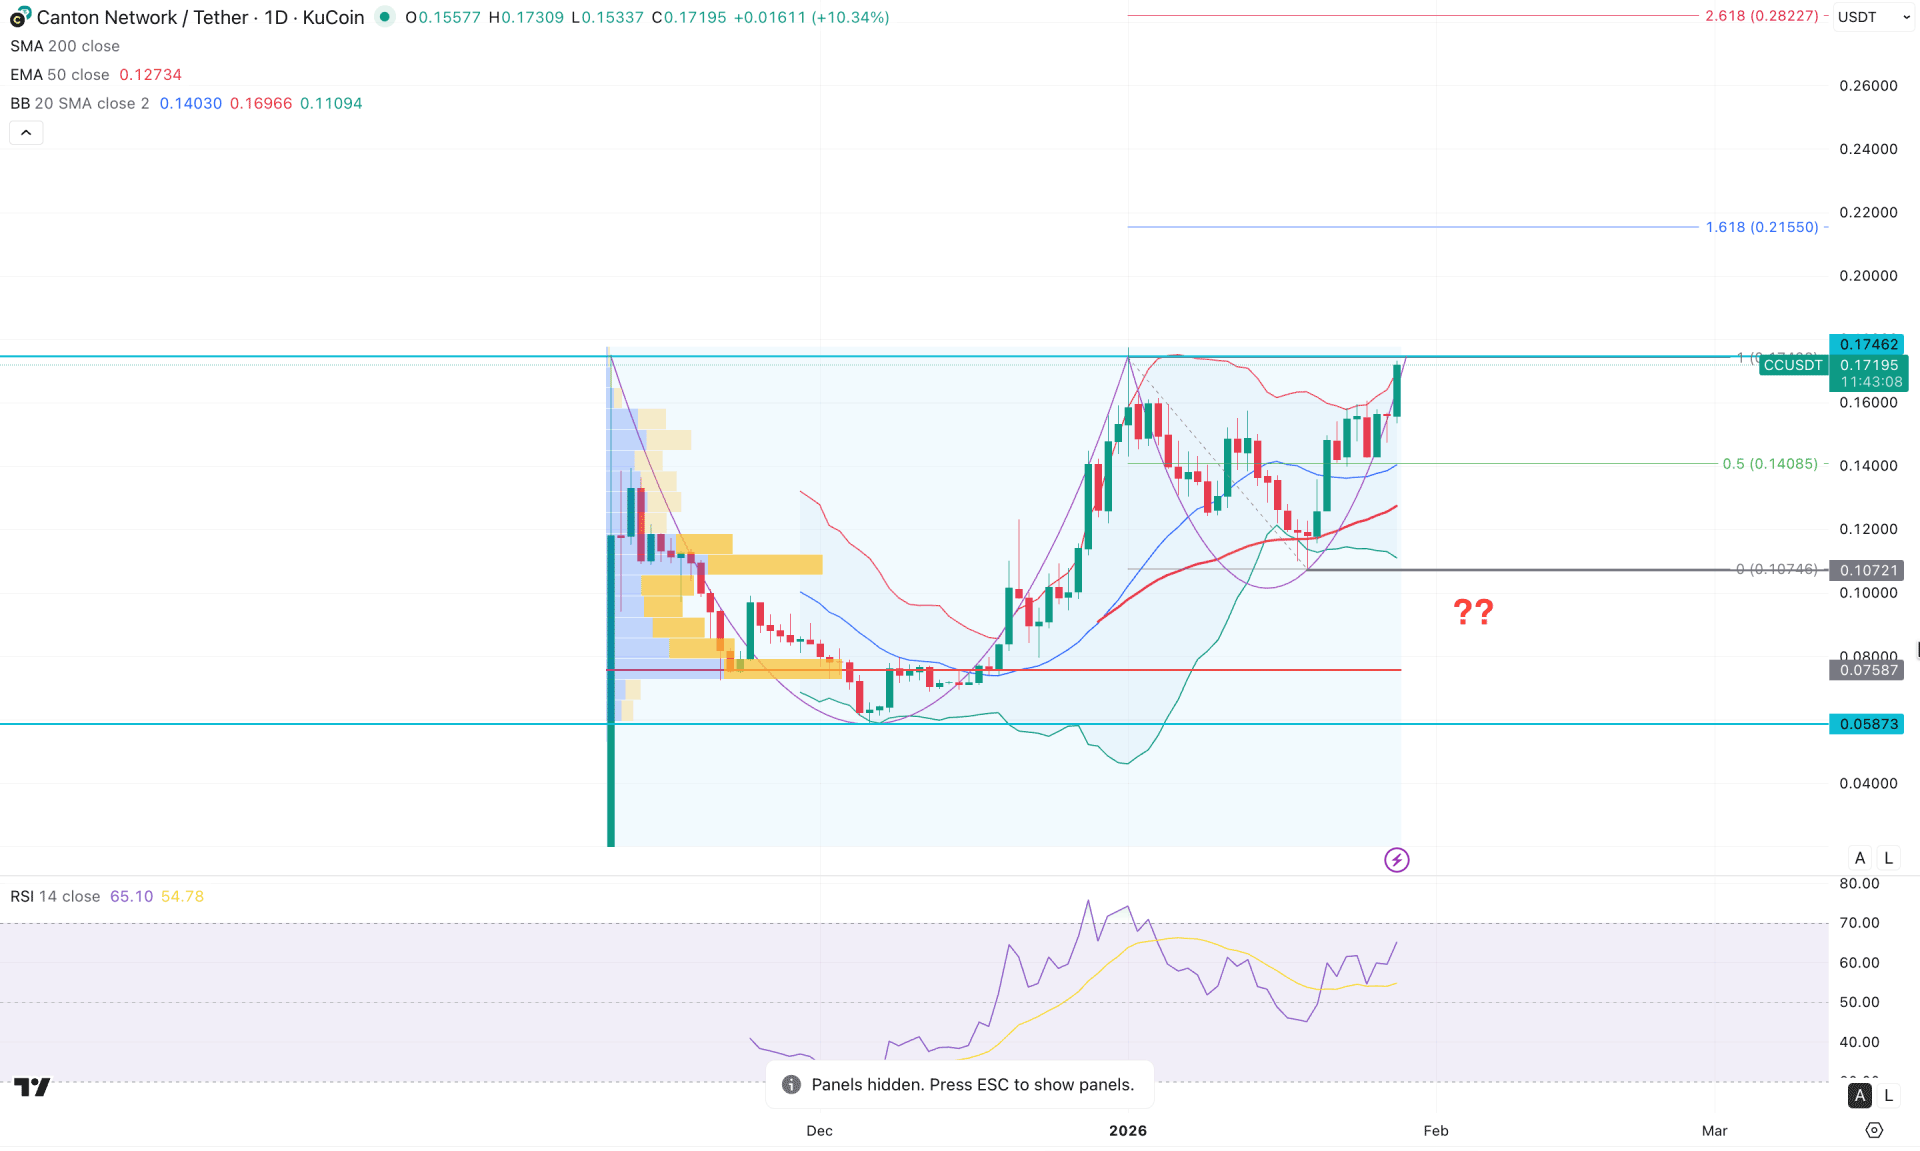
On the daily chart of CC/USDT, the price has shown a strong bullish rebound since its listing. After forming a top at 0.1746, the price has surged nearly 750%, moving aggressively into the premium zone. As the current price is trading near the top, this area presents a potentially favorable opportunity for investors.
Looking at the higher timeframe, the price is trading within a strong bullish trend. A bullish continuation candlestick pattern is visible on the weekly chart. Moreover, the current price is trading above the previous weekly high of 0.1607, which signals confluence buying pressure. As long as the price remains above the 0.1413 weekly flip zone, the bullish pressure is expected to persist.
In terms of volume, buying interest remains supportive. The highest volume activity since inception is located near the 0.0758 level, which is significantly below the current price. Although the price has recently reached the peak and is attempting to break above the 0.1746 level, no significant high-volume spike is visible at the top. This suggests sustained buying pressure with a lower probability of aggressive profit-taking.
On the main price chart, a strong bullish rebound is confirmed by a daily close above the middle Bollinger Band, pushing the price toward the upper Bollinger Band, which is now acting as resistance. Currently, the price is hovering near the upper Bollinger Band, signaling a potential short-term downside correction.
The 50-day EMA is sloping upward and is acting as a crucial dynamic support just below the 0.1400 level. In the secondary indicator window, the Relative Strength Index (RSI) is also bullish and is approaching the 70.00 overbought level. As long as the RSI holds above the 50.00 neutral line, the primary trading bias remains toward long positions only.
Based on the overall market structure, CC/USDT has a higher probability of extending its bullish momentum, potentially forming a cup-and-handle pattern breakout. To validate this bullish breakout, a daily close above the 0.1743 level is required, possibly after a minor downside correction. Any bullish rejection from the middle Bollinger Band or the 50-day EMA could present a long opportunity, with the ultimate target at the 0.2822 level.
On the bearish side, the price is currently trading in the premium zone, where failure to sustain buying pressure could become a challenge. An immediate bearish signal would be a daily close below the 50-day EMA, which could increase the probability of a decline toward the 0.0758 demand zone.
Furthermore, a breakdown below the 0.1027 level followed by consolidation could significantly increase bearish momentum, exposing the price to a deeper correction toward the 0.0400 area.
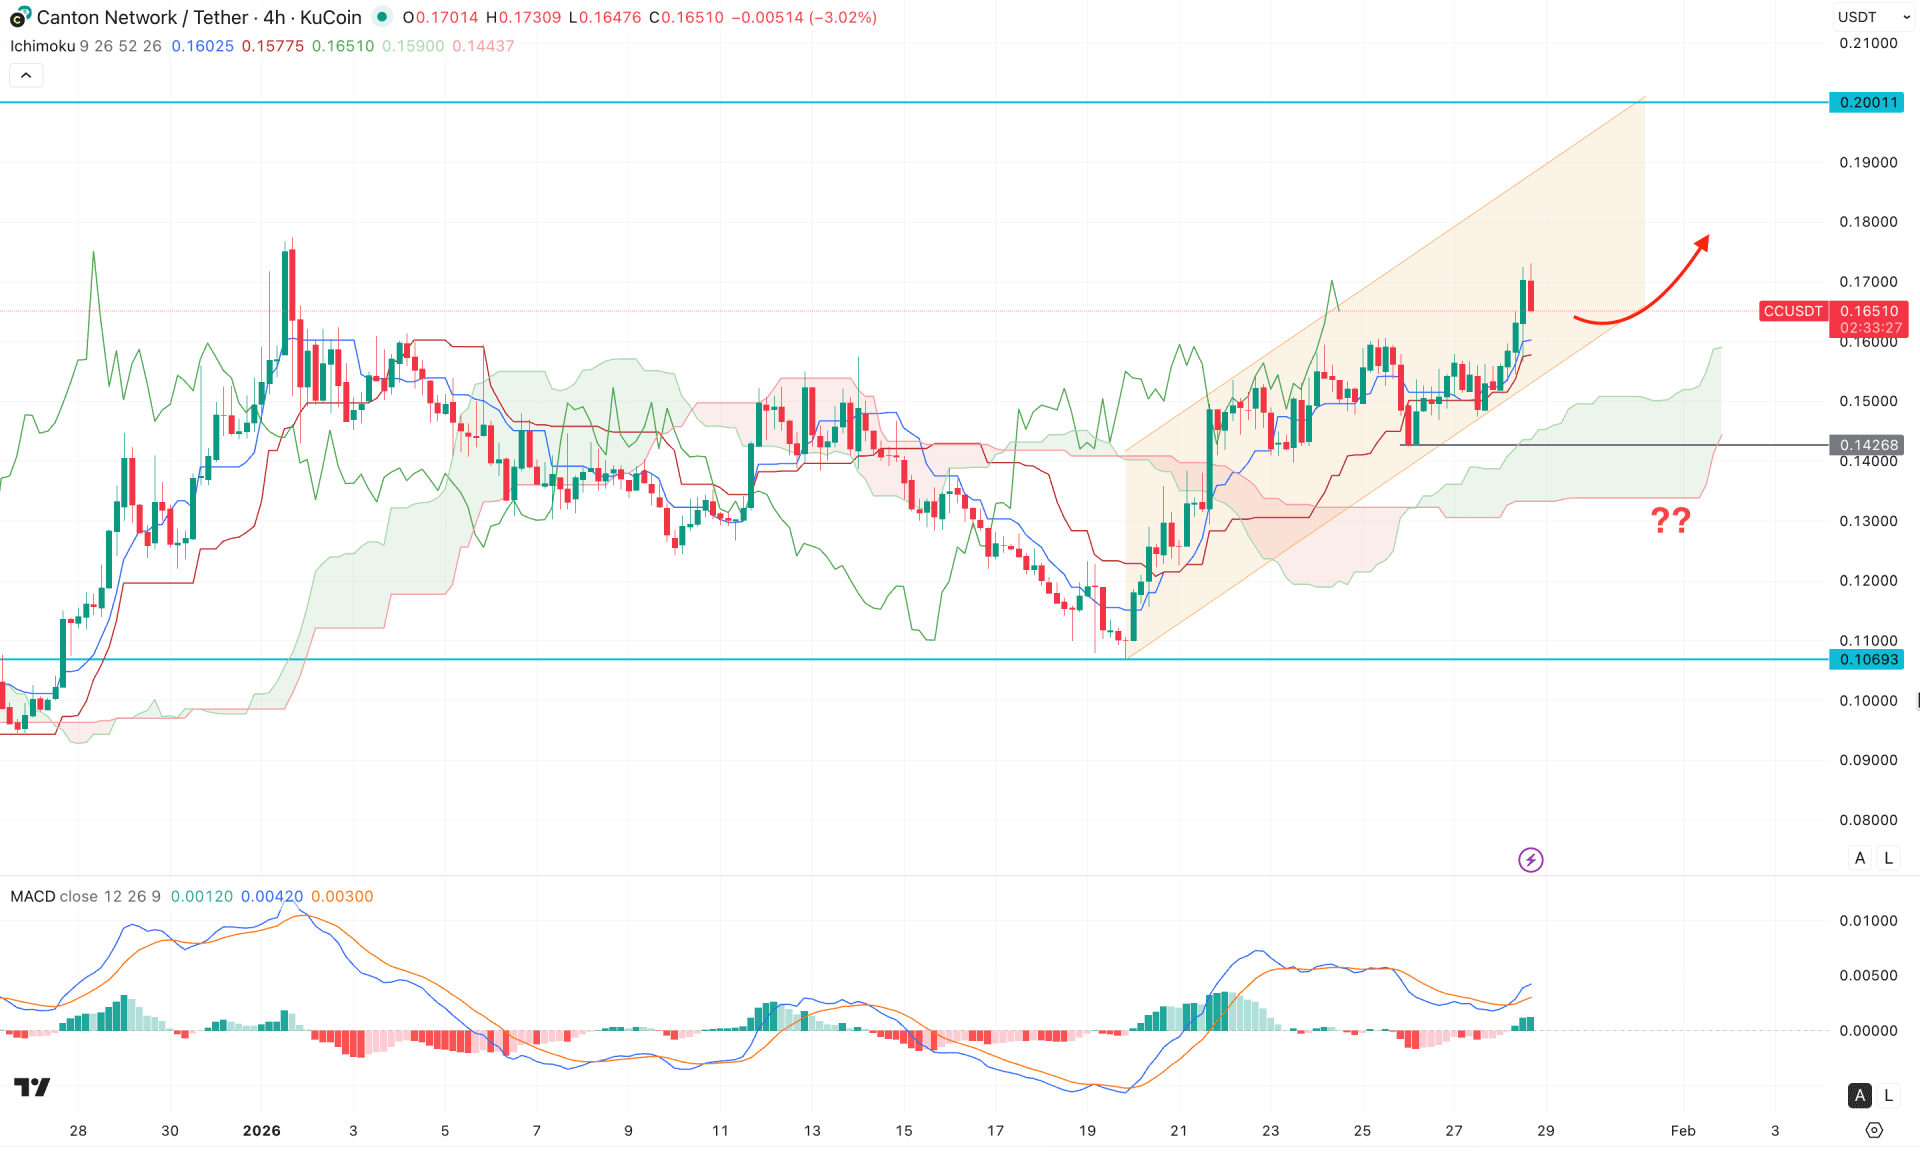
On the H4 timeframe, the price is trading bullishly within an ascending channel, where the most recent price action shows strong buying pressure from the channel support. Moreover, the current structure is positioned above the cloud support, suggesting a potential bullish trend.
In the secondary indicator window, the MACD histogram has flipped into positive territory, with a potential bullish crossover on the signal line. This indicates that buyers are active in the market and aligns with the bullish outlook suggested by the future cloud.
Based on the H4 market structure, a potential bullish extension could drive the price toward the 0.2000 resistance level.
On the other hand, buying pressure remains valid as long as the price stays above the cloud area. Any immediate selling pressure accompanied by a break below the ascending channel and multiple four-hour candle closes below the cloud support could present a potential short opportunity.
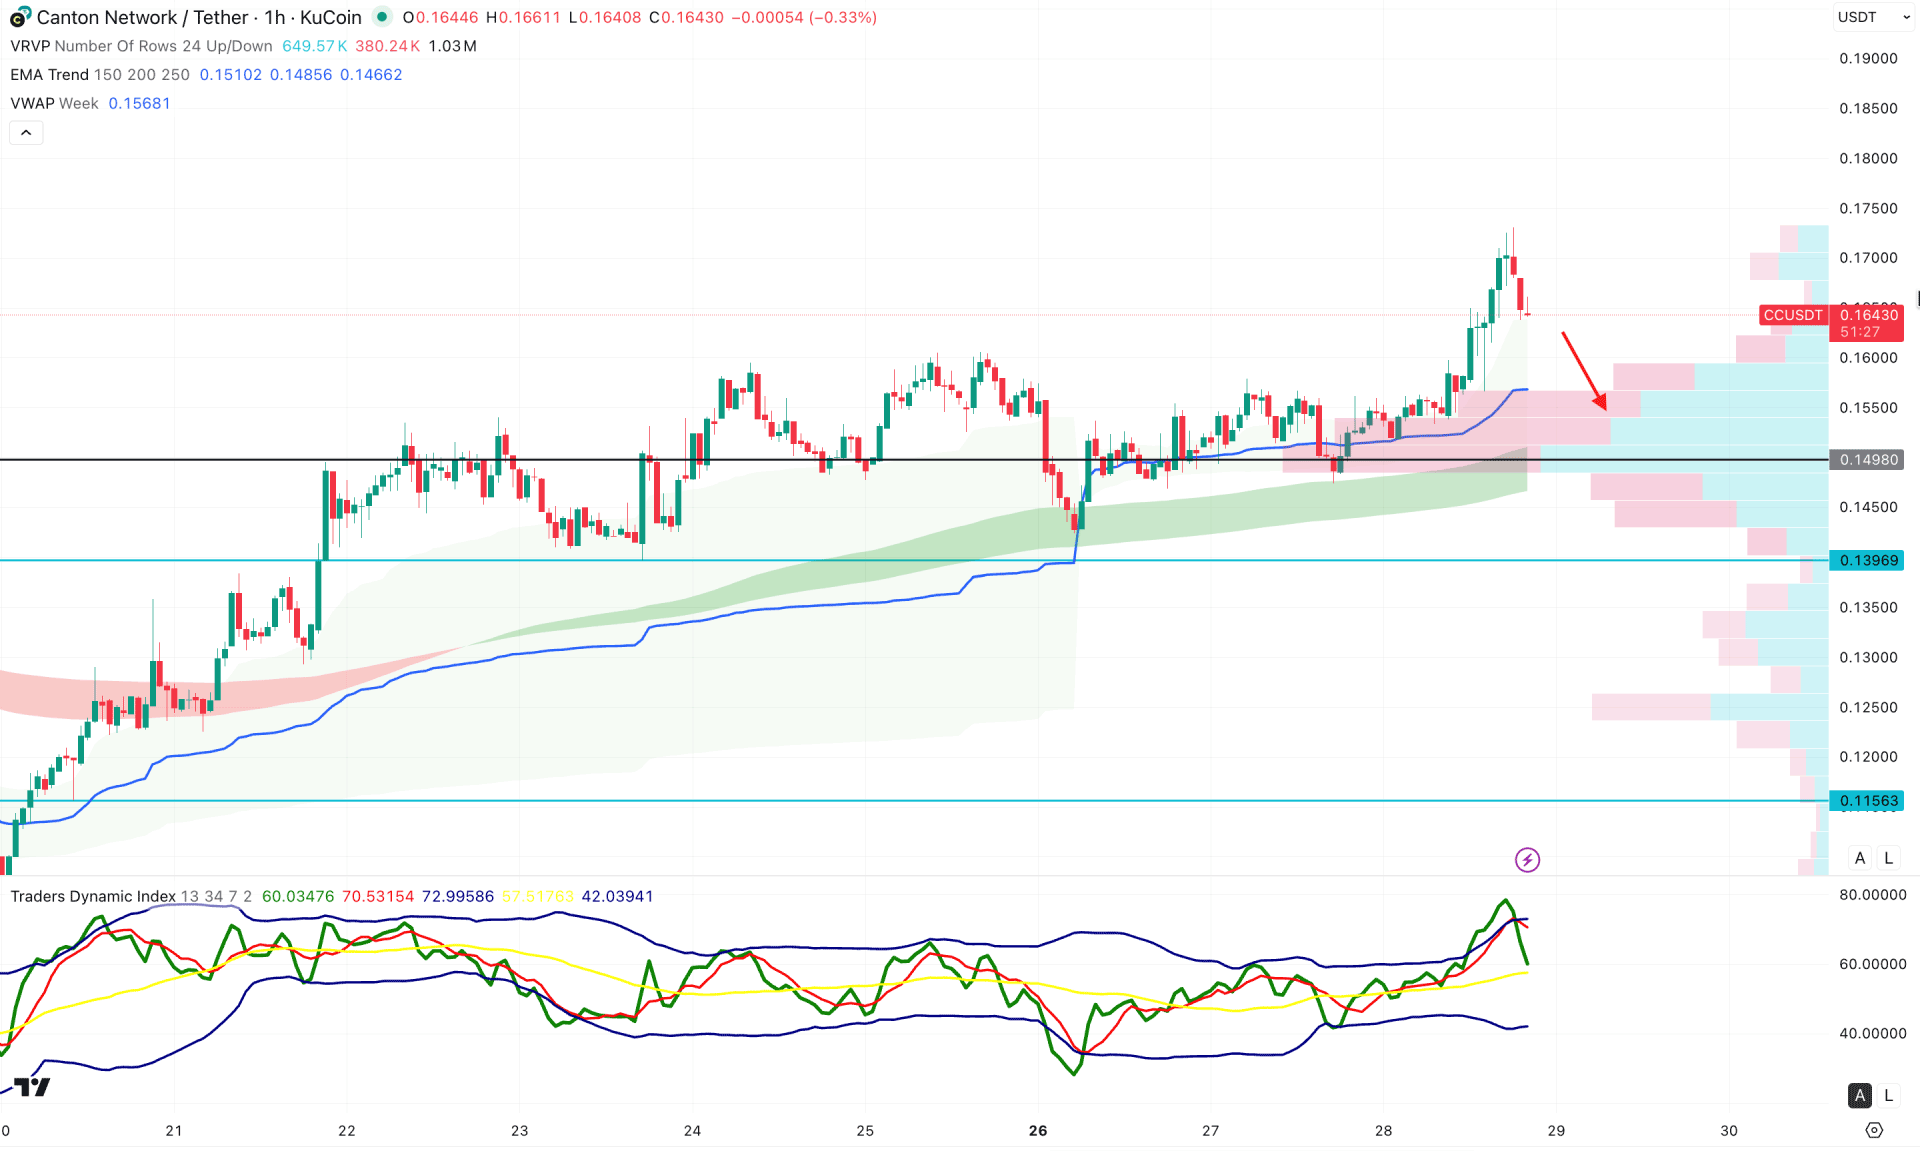
In the hourly timeframe, CC/USDT is trading at the bullish overextended area as the current price is hovering at the session high level. Moreover, the existing buying pressure is supported by the rising EMA wave and weekly VWAP line. As long as these dynamic lines remain below the current price, the primary aim for this pair would be on the bullish side.
On the other hand, the Traders Dynamic Index (TDI) has reached the bullish peak, suggesting a potential top formation. However, a proper validation might come after taking the TDI line below the 50.00 satisfactory line.
Based on this outlook, a minor downside correction is possible even if the entire structure is bullish. However, bearish pressure with a valid H1 close below the 0.1498 high volume line could lower the price towards the 0.1250 level.
Based on the overall market structure, CC/USDT has a higher possibility of extending the current bullish pressure, where a proper validation might come from the Cup & Handles pattern breakout. The intraday price is extremely bullish, suggesting an early long signal could come from a decent recovery.


