Published: November 28th, 2024
Over the previous month, Zscaler has returned +10.8%, while the S&P 500 composite has changed +3.8%.
Even though press reports or rumors about a major change in an organization's business prospects typically cause its stock to "trend" and change price instantly, some basic principles always control the buy-and-hold decision.
Zscaler is predicted to report $0.63 in earnings per share for the most recent quarter, representing a -6% decrease from last year.
The current fiscal year's consensus profit projection of $2.87 represents a 10% year-over-year evolution. Over the past 30 days, this estimate has not changed. The average earnings projection of $3.47 for the upcoming fiscal year represents an improvement of +21% from Zscaler's anticipated revenues one year prior.
Even though earnings expansion is perhaps the best measure of a business's financial condition, if a company can't increase its revenues, nothing will happen. After all, without generating more revenue, it is almost impossible for a business to sustain a long-term increase in earnings. Therefore, understanding a company's potential for revenue growth is crucial.
The present quarter's consensus revenue forecast of $605.68 million for Zscaler indicates a +21.9% year-over-year advancement. Changes of +20.6% and +19.3% are indicated by the $3.12 billion and $2.61 billion projections for the current and upcoming fiscal years, respectively.
Let's see the possible price direction of Zscaler stock from the ZS technical analysis:

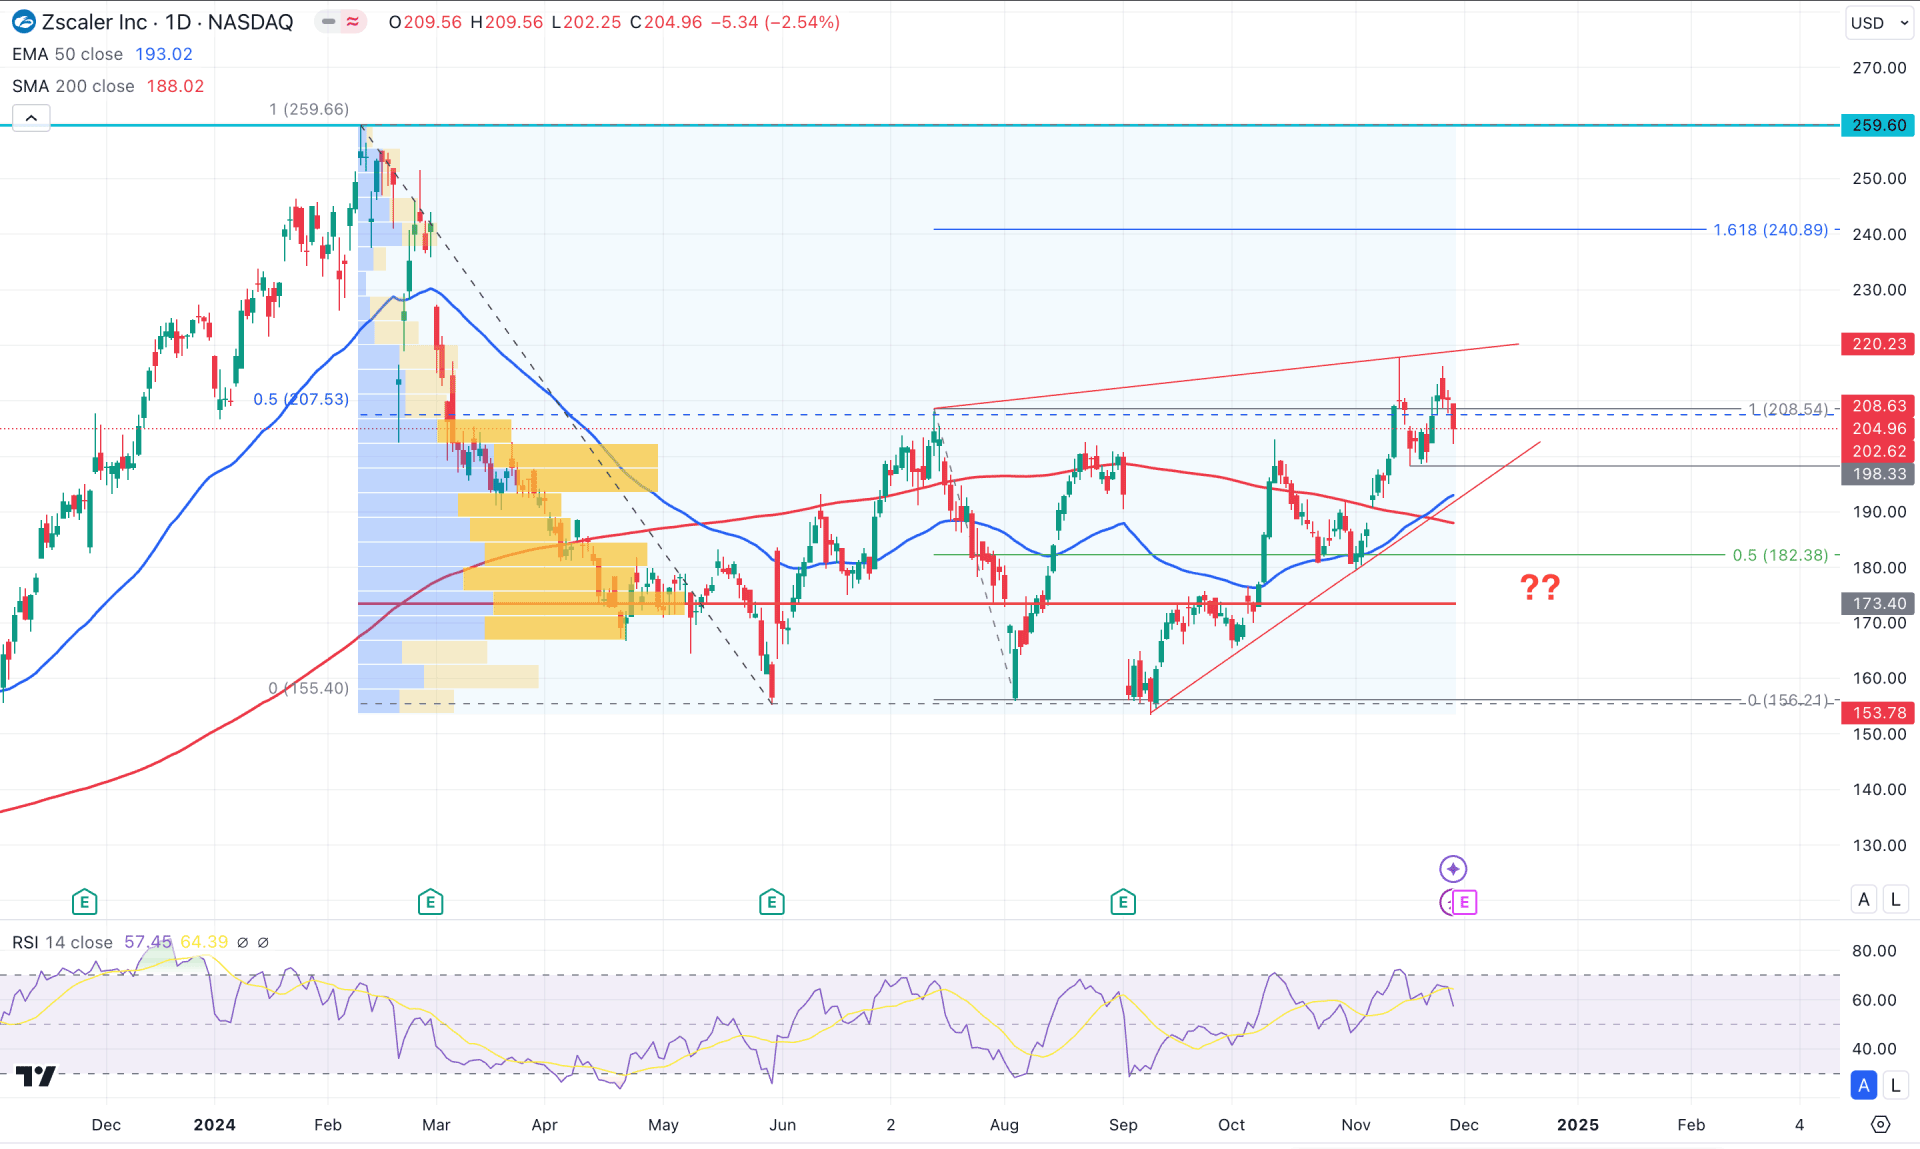
In the daily chart of ZS, the recent price trades sideways after forming a potential bullish triple-bottom breakout. Also, the price is aiming higher from the crucial dynamic line, suggesting a confluence buying pressure.
In the higher timeframe, strong congestion has been seen since May 2024, as the price failed to make any significant swing to low or high. However, the current monthly candle hovers above the crucial July 2024 high, suggesting a bullish continuation. However, investors should monitor how the monthly candle closes above this line as a valid monthly close above it could confirm the trend reversal.
In the volume structure, the most active level since February 2024 is below the current price, working as an active buying pressure from institutions.
In the main price chart, the 200-day SMA is below the current price, with a bullish crossover from the 50-day EMA. As the crossover is considered a valid bullish signal, any long opportunity from the lower time frame would work well in this stock.
Based on ZS's daily outlook, the price trades above the 50% Fibonacci Retracement level from the March-May swing. Investors might need a strong clue before opening a long position because the price is already in a premium zone. The current price is trading at the triangle resistance level, from which a decent downside correction is pending.
In that case, any bullish reversal from the 200.00 to 173.40 zone could offer a long opportunity, targeting the 240.89 Fibonacci Extension level.
On the other hand, there is sufficient sell-side liquidity below the triangle resistance, from which a bullish recovery might come after a stable market reversal. However, an extended selling pressure below the 173.40 high volume line might invalidate the current bullish possibility and lower the price below the 140.00 and even 120.00 levels.

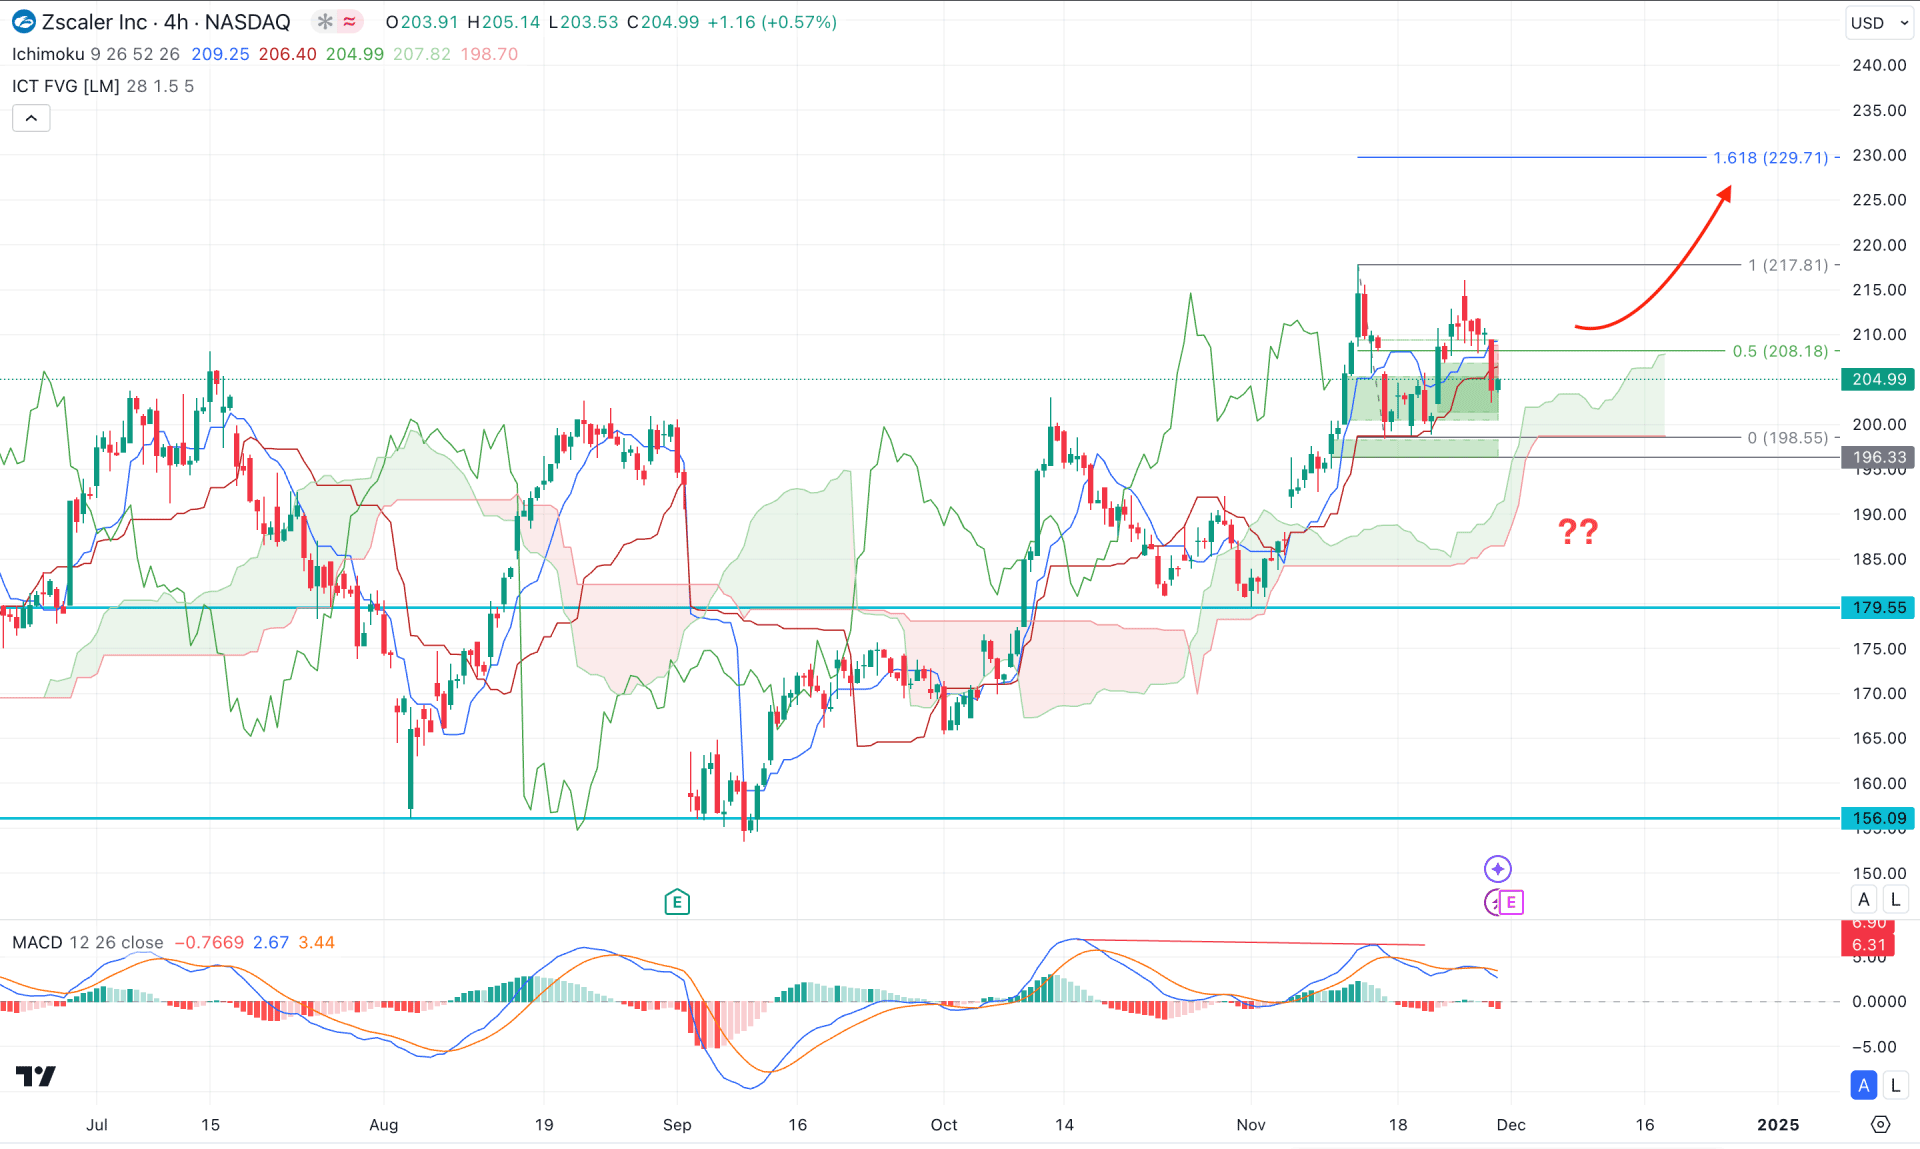
In the H4 timeframe, the ZS is trading sideways above the Ichimoku Cloud zone, suggesting an ongoing bullish trend. However, multiple violations within dynamic lines signal a struggle for bulls.
In the Futures Cloud, an ongoing buying pressure is present from the dynamic Senkou Span A line. However, the Senkou Span B line remains flat below the A, signaling a neutral momentum on a long-term basis.
In the indicator window, the potential divergence with a red Histogram signals a possible top formation at the 217.81 high. However, it is not enough to consider it a bearish reversal as more clues are pending from the price chart.
Based on the H4 outlook, an immediate support level is at the 198.55 level, which is below the current price. Moreover, a potential imbalance is visible below the static support, setting the bottom at the 196.33 level. Primarily a bullish continuation is present as long as the current price hovers above the 196.33 low; any valid buying pressure with an H4 close above the Kijun Sen level might extend the price towards the 229.78 Fibonacci Extension level.
On the other hand, the current selling pressure below the Kijun Sen level signals a struggle for bulls, which might result in a trend reversal after coming below the cloud zone.

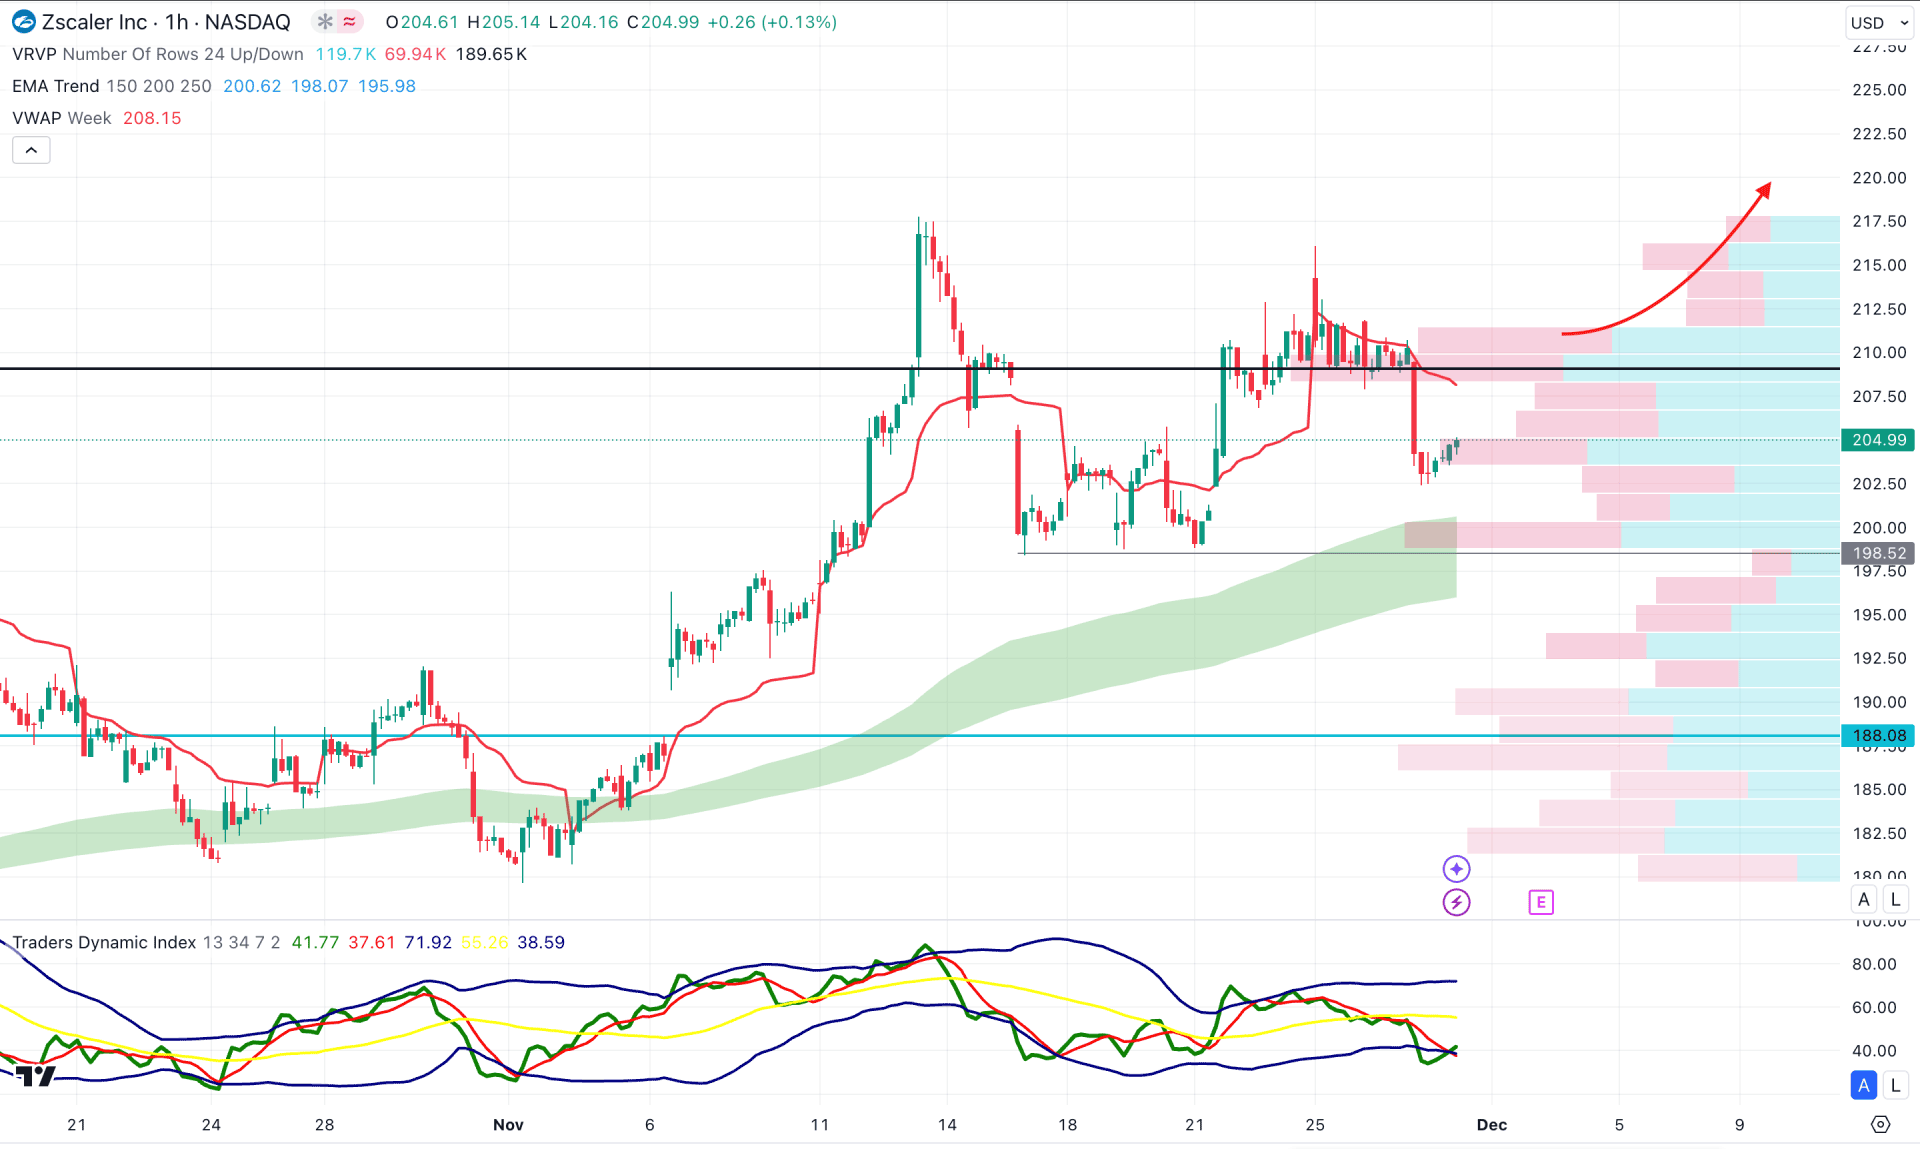
In the hourly time frame, the ZS price shows a mixed sentiment, where the visible range high volume line is above the current price. However, an upward surge is present from the MA wave, signaling a long-term bullish trend.
In the indicator window, the Traders Dynamic Index (TDI) reached the lowest level in a month, signaling active sellers' presence in the market.
Based on the hourly outlook, the potential double top formation could offer a decent short opportunity after having a validation below the 198.52 level. However, the MA wave is working as a major support level, which could limit the selling pressure at any time. In that case, a bullish rebound with an hourly candle above the 209.08 level could resume the existing bullish trend.
Based on the ongoing market momentum, ZS is more likely to extend the bullish trend as the recent price hovers above the multi-month high after a range breakout. Although the major market trend is bullish, investors should remain cautious about the intraday market momentum, where a bottom formation is still pending.