Published: August 8th, 2024
In August, platinum prices fell to $920 per troy ounce, not far from their lowest point since early April. This decline was accompanied by a decline in other commercial precious metal prices and a gloomier demand forecast.
The dire prognosis for the world's biggest manufacturing sector was further confirmed when the Chinese government chose not to announce any particular stimulus measures in response to declining overall demand in the Chinese economy.
Pessimism was heightened shortly after the official and wider Caixin Chinese manufacturing PMIs reported factory activity reductions at the beginning of the third quarter.
The ISM PMI also consistently indicated weakening in US factories. Despite serious supply issues, this caused platinum prices to follow the drop in base metal long futures at the beginning of August.
Based on the CME FedWatch tool, the chance of a US Federal Reserve (Fed) interest rate drop of 50 basis points (bps) in September has increased to 72.0% from 11.8% one week ago. The US Dollar may face pressure in the foreseeable future due to expectations of further rate reduction.
Concerns about a future US recession have increased in response to weaker job data from July. According to data, US nonfarm payrolls (NFP) were lower than anticipated on Friday. In the meantime, the US rate of unemployment reached its highest point since November 2021 in July.
Let's see the complete outlook of this instrument from the XPTUSD technical analysis:

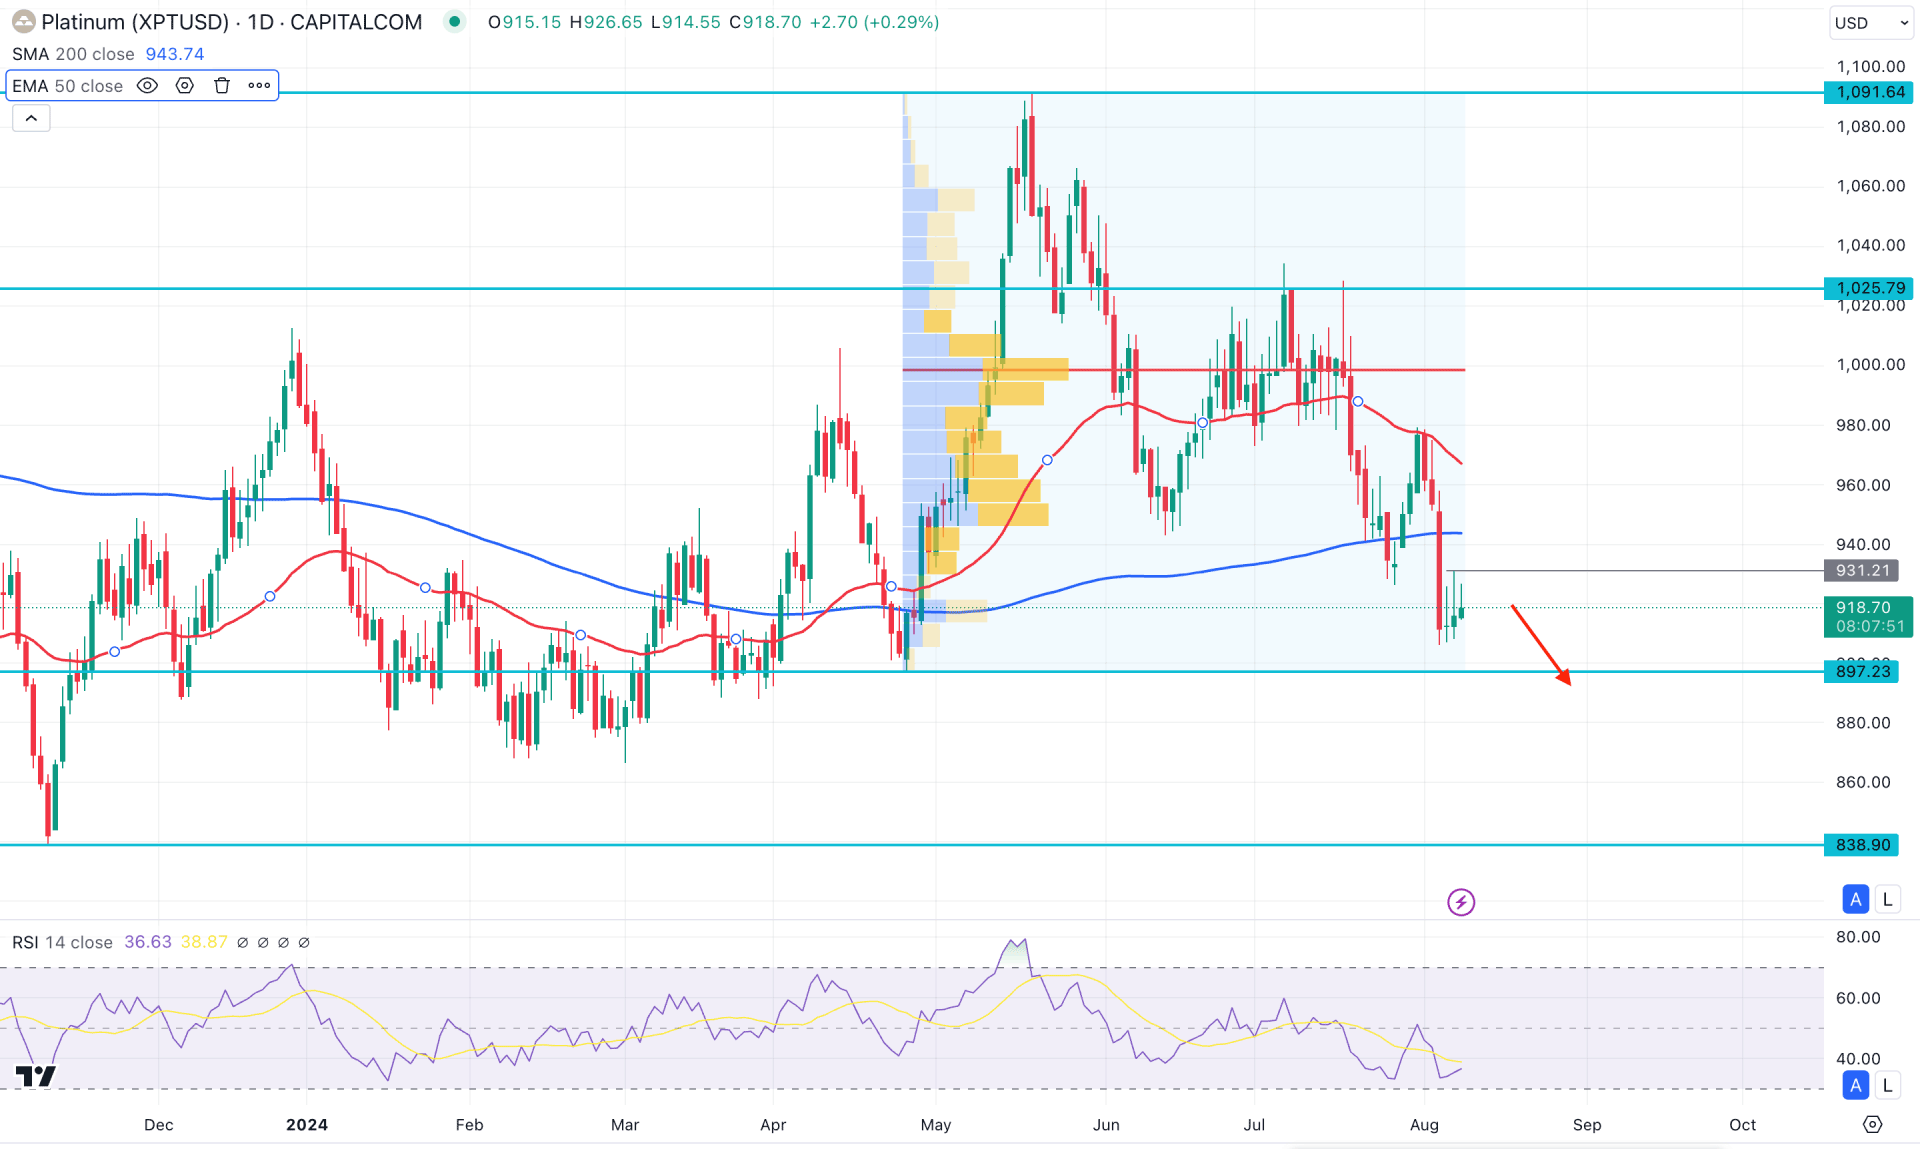
In the daily chart of XPTUSD, the recent price shows extensive selling pressure, initiated from the May 2024 top. As a result, the price came below the dynamic 200 day Simple Moving Average, creating a possibility of a potential death cross formation.
In the higher timeframe, congestion is visible, where the monthly chart suggests a potential symmetrical triangle formation. Therefore, the long-term bull run from the solid platinum industrial demand needs a proper breakout above the 1097.00 level before forming a long-term buying pressure.
In the daily chart, the recent bearish daily candle is below the dynamic 200-day Simple Moving Average, which suggests stable selling pressure. Primarily, we may expect the downside pressure to extend in this pair, but more confirmation might come if the 50-day EMA moves below the 200-day SMA.
In the volume structure, the selling pressure is also valid as the current high volume line since May 2024 is at the 998.17 level. In that case, the downside pressure might extend until the 1000.00 psychological line is broken.
Based on the daily market outlook of XPTUSD, a sufficient upward correction might appear from the current price, where the near-term resistance is at the 931.21 level. In that case, a bullish break with a daily candle above the near-term resistance level could extend the buying pressure toward the 1000.00 psychological line. Moreover, a bearish liquidity sweep from the 897.23 to 860.00 zone with a daily candle above the 50-day EMA could open another long opportunity.
On the bearish side, a bearish rejection from the 50-day EMA could be a potentially bearish signal, which could lower the price towards the 838.90 level.

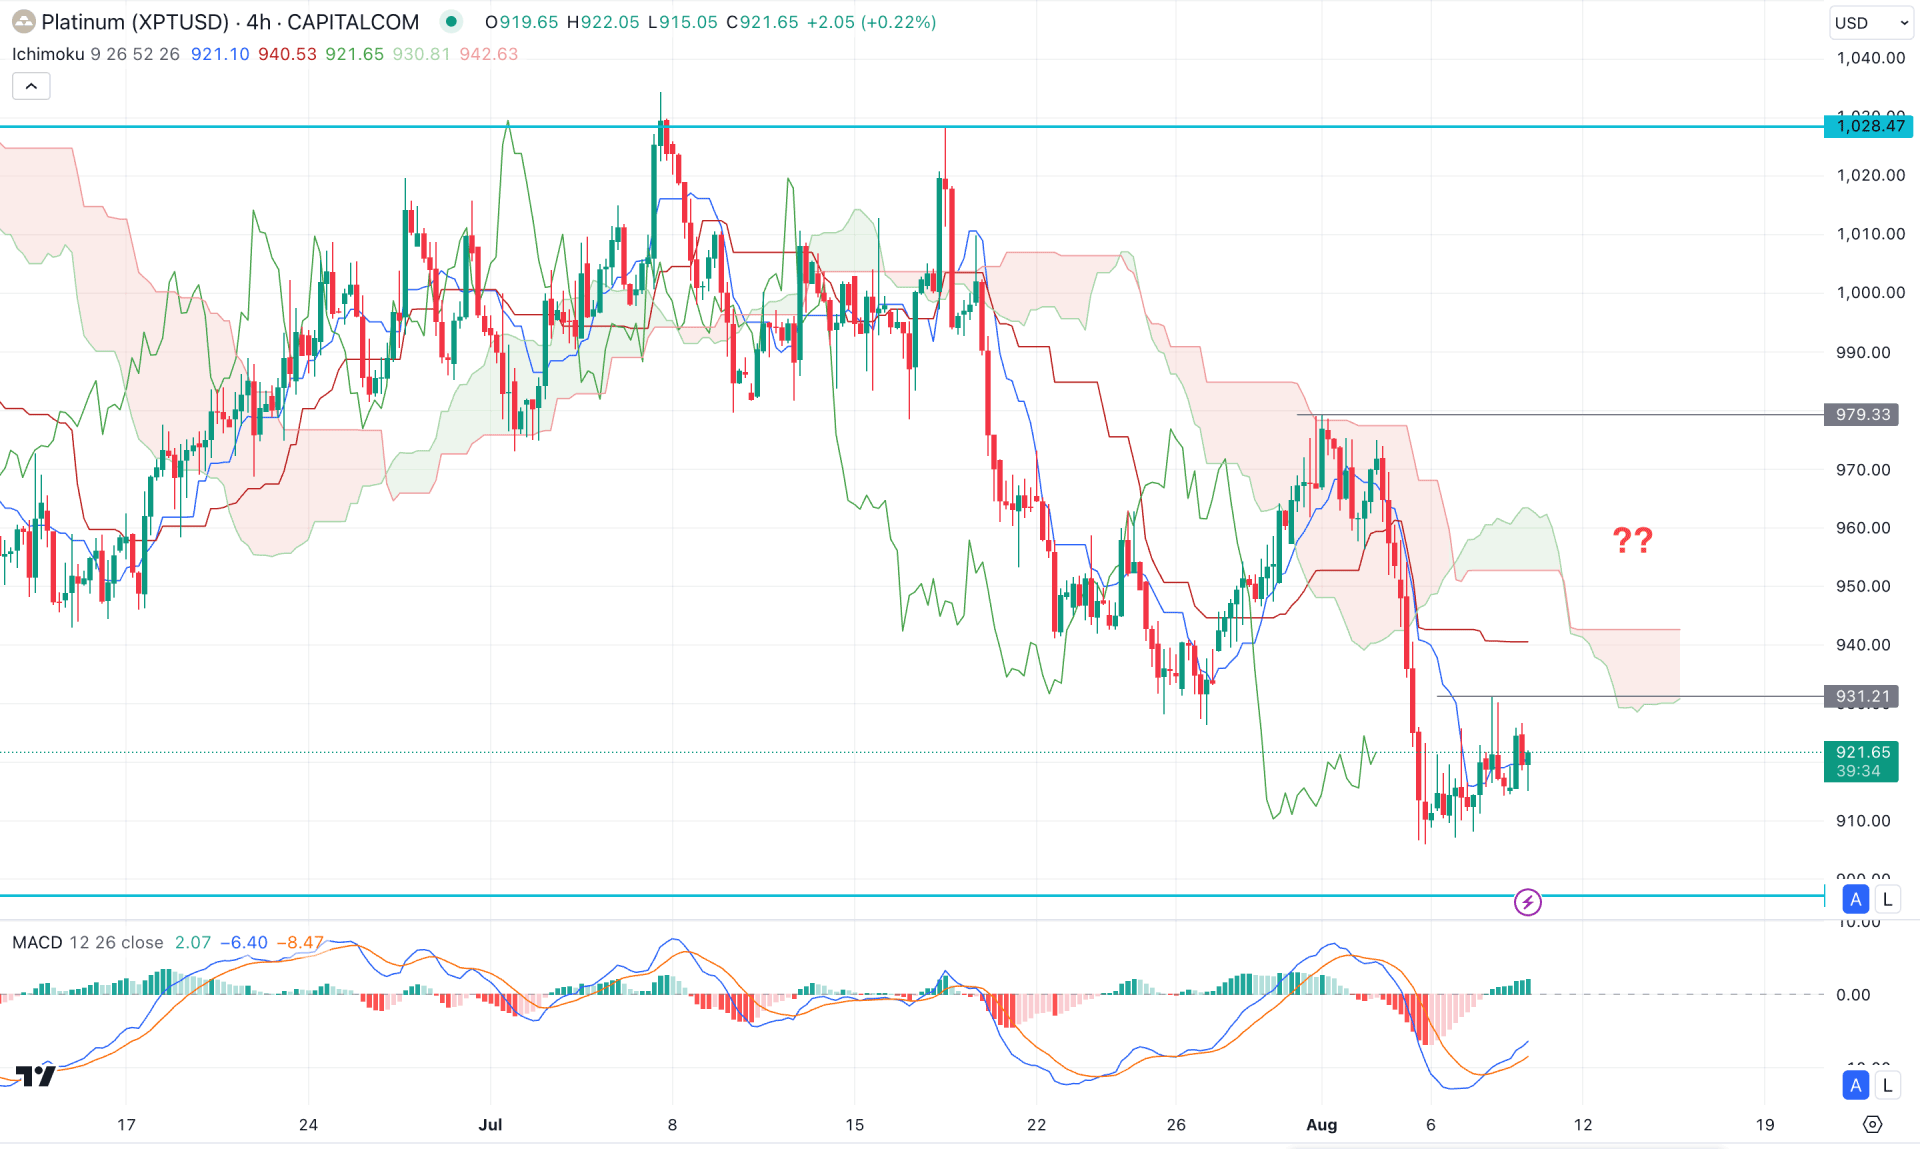
In the H4 timeframe, extensive selling pressure is visible below the Ichimoku Cloud, with a new low formation below the 926.30 level. Moreover, the Kijun Sen level is working as resistance as it hovers above the 931.21 existing high.
In the indicator window, a bullish breakout is visible from the MACD Signal line, while the Histogram maintains the upward pressure.
Based on this outlook, a bullish break above the Cloud resistance could be a potential long signal, aiming for the 1000.00 psychological level. However, a downward continuation is possible, from where a valid bearish rejection from the Kijun Sen level could find support from the 900.00 area.

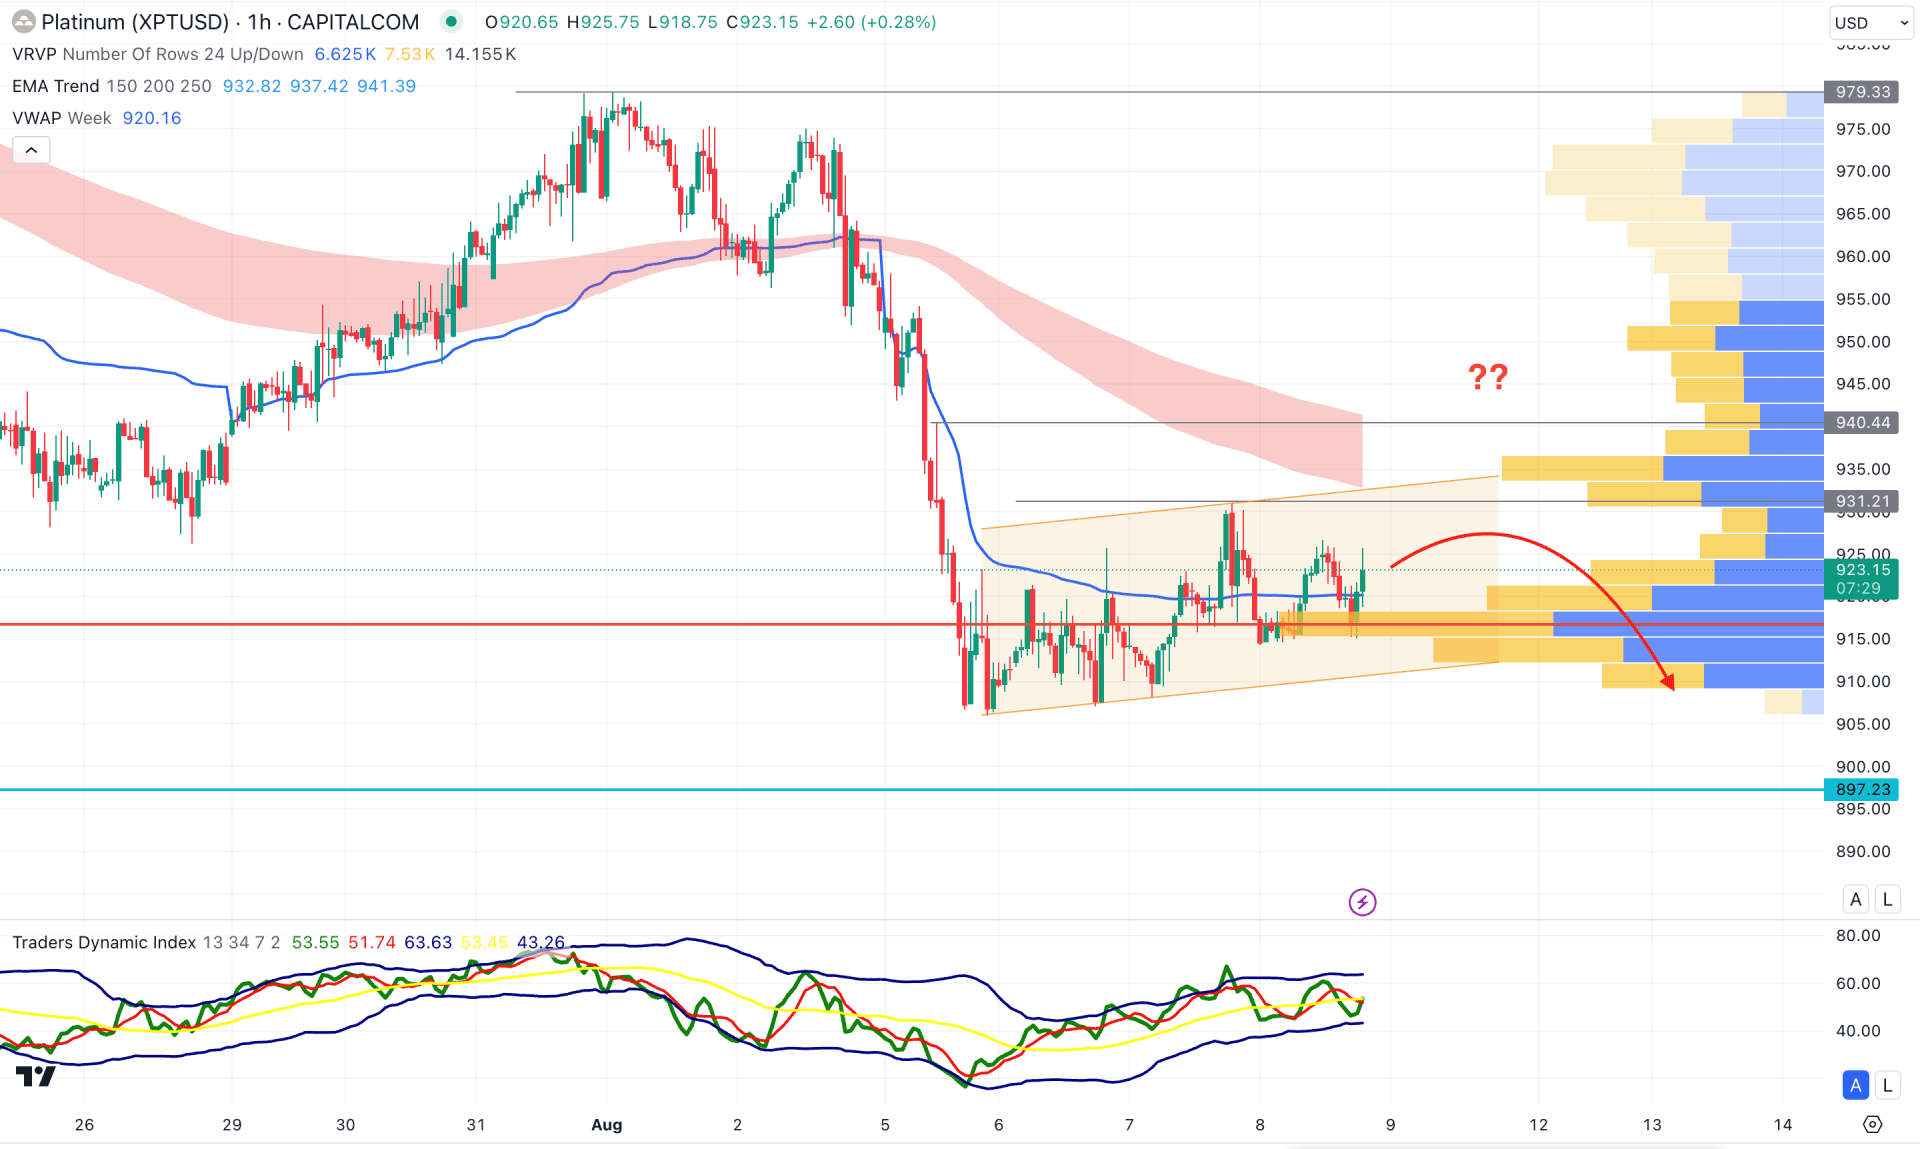
In the hourly time frame, the current price trades sideways after making a bottom at the 906.05 level. Moreover, the visible range high volume line is closer to the current price, which needs to break before extending the selling pressure.
In the indicator window, the Traders Dynamic Index (TDI) showed a rebound and moved above the 50.00 neutral point.
Based on this outlook, an upward continuation with a valid bearish rejection from the 930.00 to 940.44 zone could be a potential bearish continuation signal. However, a bullish break above the 950.00 level might extend the buying pressure towards the 980.00 area.
Based on the current multi-timeframe analysis, Platinum (XPT) is trading under prolonged selling pressure. In that case, investors might find it a bearish continuation signal after having a valid price action.