
Published: November 13th, 2025
The Gold price (XAUUSD) continues to rise, reaching almost $4,195. Ahead of the decision to end the US government closure, which would provide economic certainty and set the stage for the Federal Reserve's (Fed) next action, the precious metal surged to its highest point since October 21.
On the other hand, the US central bank may lower interest rates the following month in anticipation of the conclusion of the government shutdown and the return of economic data. The yellow metal may then receive some support as a result.
According to the CME FedWatch tool, the markets are currently pricing in a nearly 64% chance that the Federal Reserve will lower rates in December. Lower interest rates could help the non-yielding metals sector by reducing the potential cost of owning gold.
Raphael Bostic, president of the Atlanta Fed, stated on Wednesday that he supports keeping interest rates at their current level until there's "clear evidence" that price inflation is returning to the Fed's 2% target. Currently, traders will look to the Fedspeak for additional hints. In the short run, any hawkish comments made by Fed officials could raise the US dollar and drop the price of commodities denominated in USD.
Let's see the complete price outlook from the XAUUSD technical chart:

In the daily chart of XAUUSD, the major market momentum is bullish, as the price continues to push higher after forming a bottom at the 3920.46 level. As the current bullish continuation remains solid, the price has a higher likelihood of extending beyond its previous all-time high level. However, the upcoming FOMC Rate decision with geopolitical uncertainty could work as a key price driver for Gold.
Looking at the higher timeframe, the monthly chart shows a clear bullish continuation momentum as no significant top or selling pressure is visible. However, the price is trading at the premium zone, where taking long positions requires additional attention. The weekly timeframe shows some hope as the current price is aiming higher from a bullish inside bar breakout. As the current price is hovering above the 4112.07 weekly flip zone, a strong bullish continuation is possible.
In terms of volume, the bullish pressure is solid as the largest activity level since August 2025 is below the current price. As a bullish rectangle breakout is visible from the high-volume area, investors might rely on the ongoing buying pressure. However, the gap between the current price and the high volume line has expanded, suggesting a potential downside recovery as a mean reversion.
In the main price chart, the bullish impulsive trend is visible as the 50-day EMA and 200-day SMA are below the current price. Moreover, both lines are aiming higher, signalling a trend continuation momentum, while some downside pressure might come from the mean reversion.
In the secondary indicator window, the Relative Strength Index (RSI) has rebounded to a position above the neutral 50.00 level, signalling buying pressure in the main chart.
Overall, the XAUUSD price is heading upwards with no solid barrier from sellers. In that case, the price has a higher possibility of moving up and creating a new high. The ultimate target of the bull run would be the 4699.34 Fibonacci Extension level.
On the bearish side, an extended downside pressure with a daily close below the 50-day EMA could halt the current buying pressure and test the 200-day SMA line with corrective pressure.
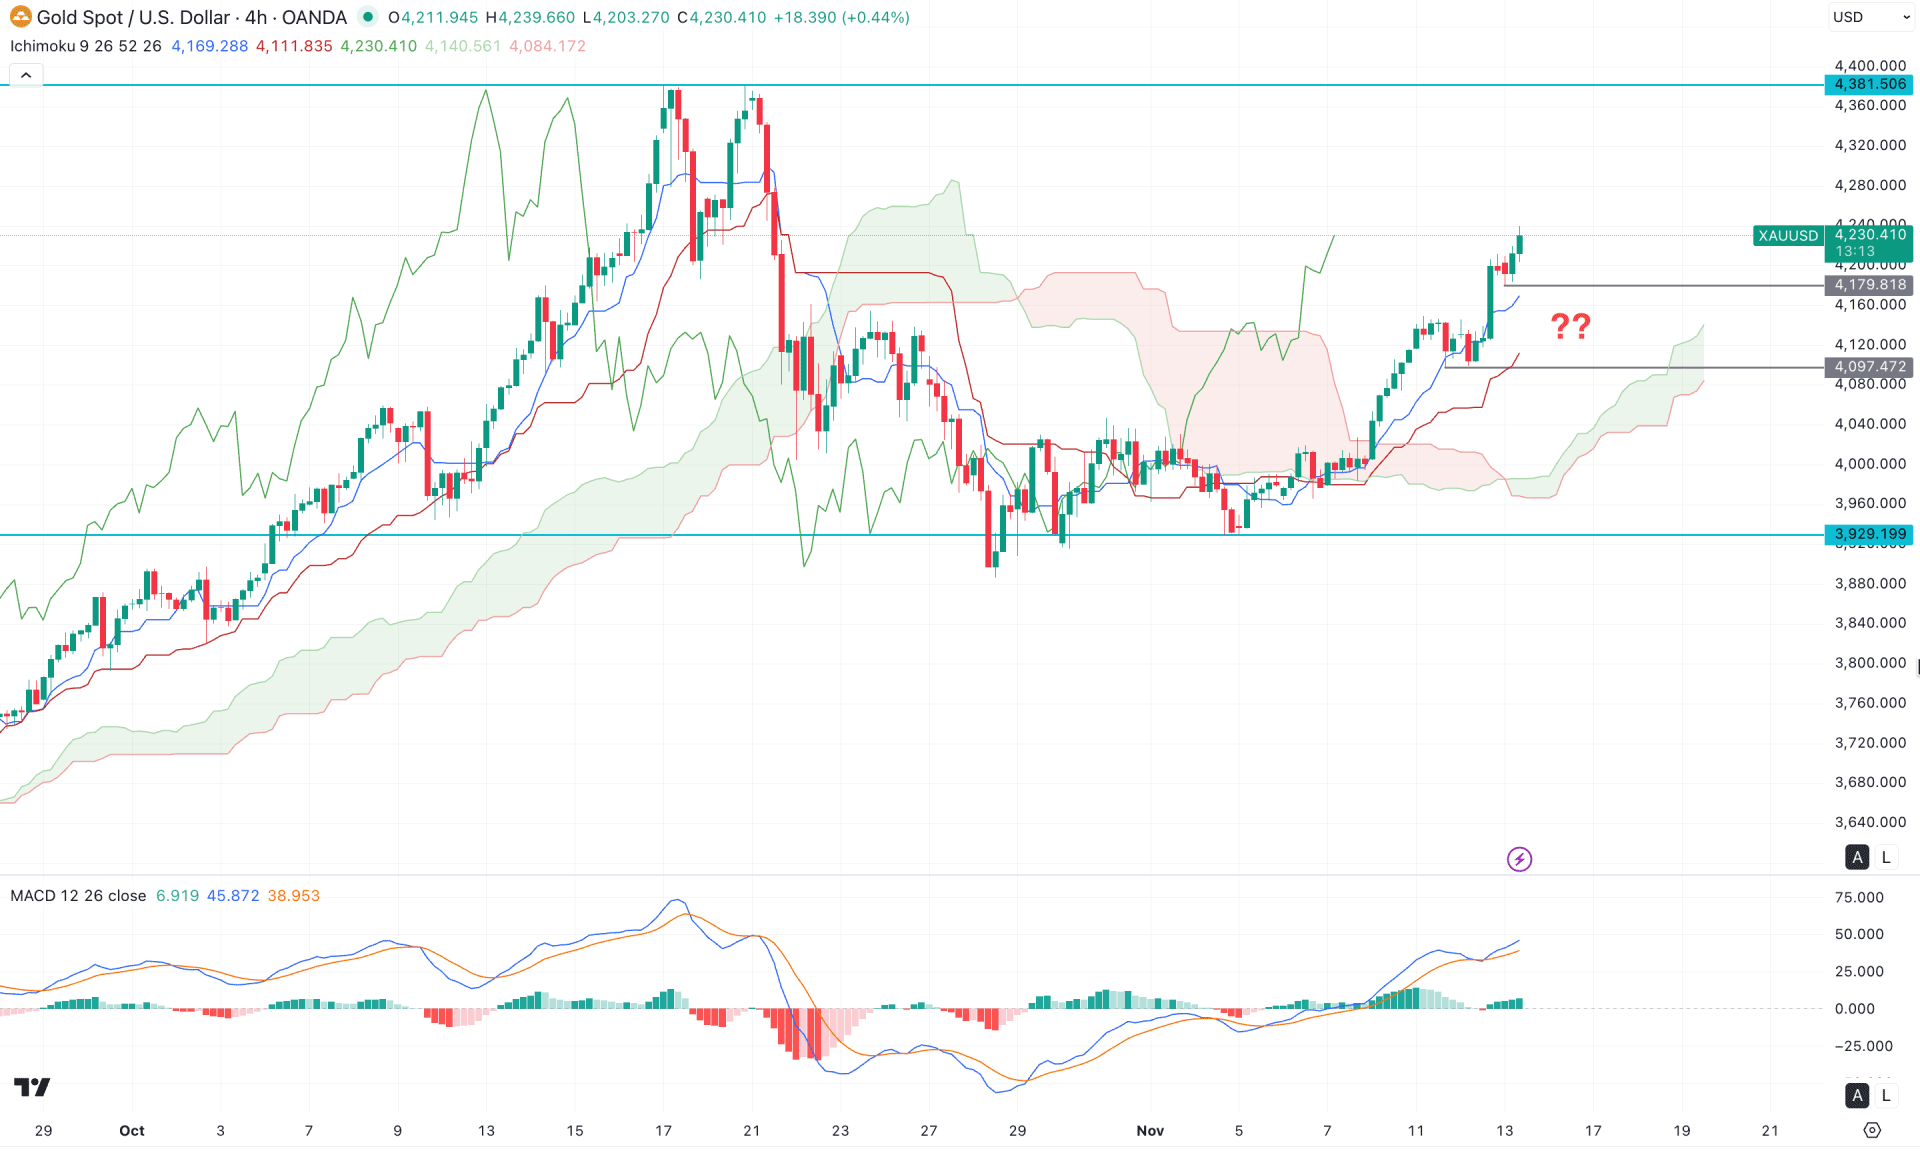
In the four-hour timeframe, the current price is trading above the Kumo cloud area, indicating a bullish continuation momentum. As the price continues making consecutive higher highs, the primary focus should be on looking for a long entry from a reliable correction.
In the future cloud, both lines are sloping upward, signalling stable buying pressure in the market, while the dynamic levels remain below the current price with a bullish inclination.
In the secondary indicator window, the MACD histogram has flipped to the positive area and formed multiple positive particle alignments. Moreover, the signal line is heading upward with a bullish continuation, and there are no signs of a top formation.
Based on this market structure, investors should closely monitor the price action above the 4179.8 support level. A minor correction is pending, and any bullish reversal from the dynamic Tenkan-Sen level could provide a long opportunity. On the bullish side, the immediate resistance is located near the 4300.00 psychological level, followed by the 4391.50 level.
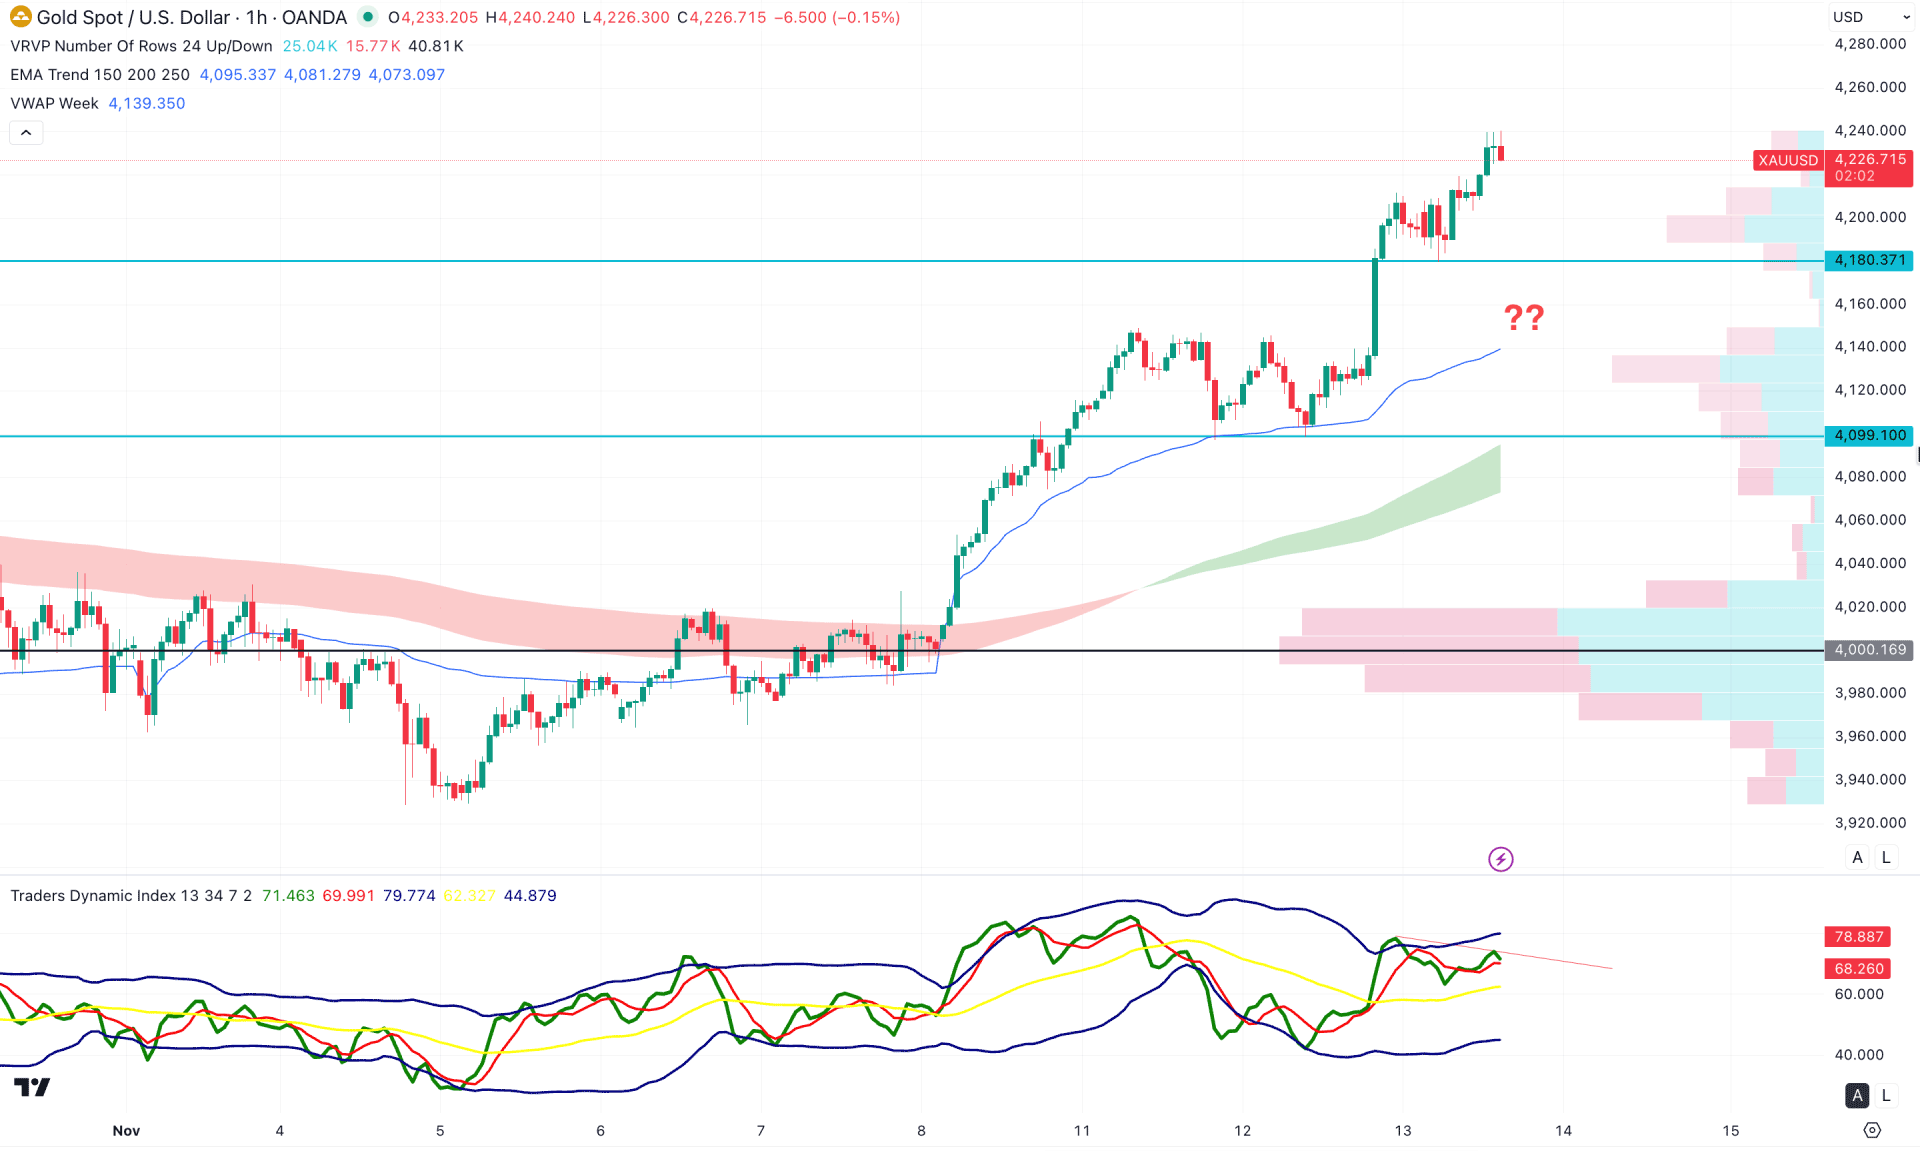
In the hourly timeframe, the XAUUSD price is trading within an intraday buying pressure, where a significant downside recovery is pending.
The weekly VWAP and EMA waves are below the current price with a bullish slope. However, the gap between the current price and dynamic lines signals a potential downside correction as a mean reversion.
In the indicator window, the Traders Dynamic Index (TDI) remains above the 50.00 neutral line, indicating ongoing buying pressure. However, a potential divergence is visible at the top from where a bearish recovery could come.
Based on this structure, a failure to hold the price above the 4180.37 support level could create a short-term bearish pressure, targeting the EMA wave area.
However, any bullish rebound from the weekly VWAP line could resume the existing trend at any time.
Based on the overall market outlook, XAUUSD buying pressure remains solid, and the ongoing fundamental uncertainty could lead to another all-time high in the near future. However, the intraday market momentum is bullish, and a considerable downside correction is pending before a long signal can be created.


