
Published: October 12th, 2021
Waves is a blockchain platform with a multi-purpose facility where people can implement decentralized apps and smart contracts. Since its launch in 2016, this platform has become popular among investors due to its speed and user-friendliness. With time, this platform made several changes with advanced features in its original design.
A Ukrainian-born scientist Alexander Ivanov is behind the Wave project, an active person in the crypto world by releasing instant exchange Coinoat and indexing site Cooleindex. Currently, the company has employees of more than 180 people, located in Moscow and Switzerland.
Currently, there are 106,407,400.00 WAVES in supply with a market cap of $3,159,457,689. In the last 24 hours, the market volume was at $419,954,406.87, which is more than 400% than the previous day. Moreover, the price faced an 11% surge in the last 24 hours, where the trading volume and the price appreciation made this coin an attractive investment opportunity.
Let’s see the upcoming price direction from the Microsoft Stock WAVE/USDT technical analysis:
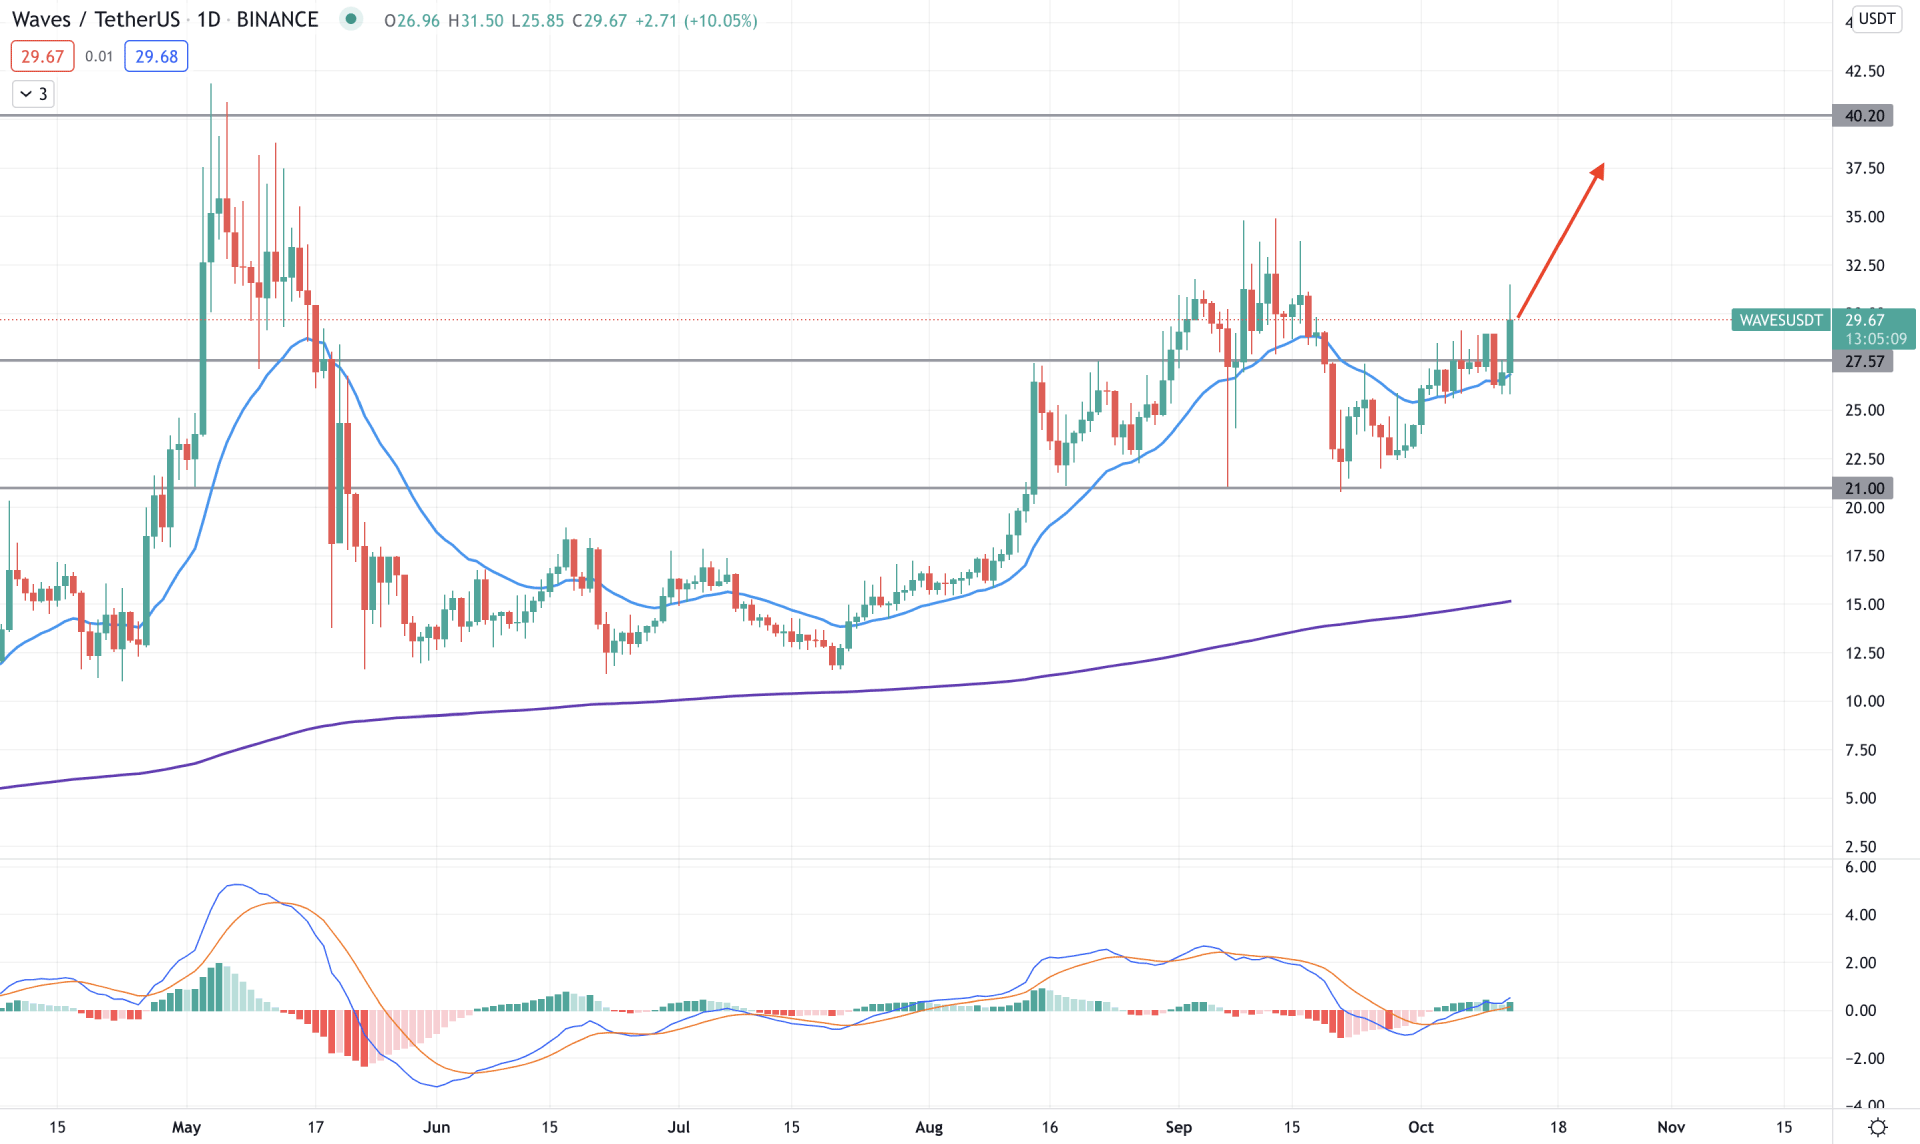
WAVE/USDT has traveled to an all-time high level in May 2021, followed by the broader bullish pressure in the crypto market. Later on, the excessive volatility at the all-time high level pushed the price down towards the 11.79 swing low. However, bears failed to hold the momentum below the 11.79 level that pushed the price up in the second half of 2021.
The above image shows how the price is trading above the 27.57 event level where the market is above the 200 SMA. Moreover, the recent volatility in September tried to hold the bearish pressure below the dynamic 20 EMA but failed. So now the price is stable above the dynamic 20 EMA and static 27.57 level. Meanwhile, the MACD Histogram is bullish and holds a stable position.
Based on the daily context, the overall market direction is bullish as long as the price is trading above the 27.57 event level. In that case, the buying pressure may extend towards the 40.00 level in the coming days. On the other hand, any daily close below the 27.57 level may increase the bearish possibility towards the 21.00 support level.
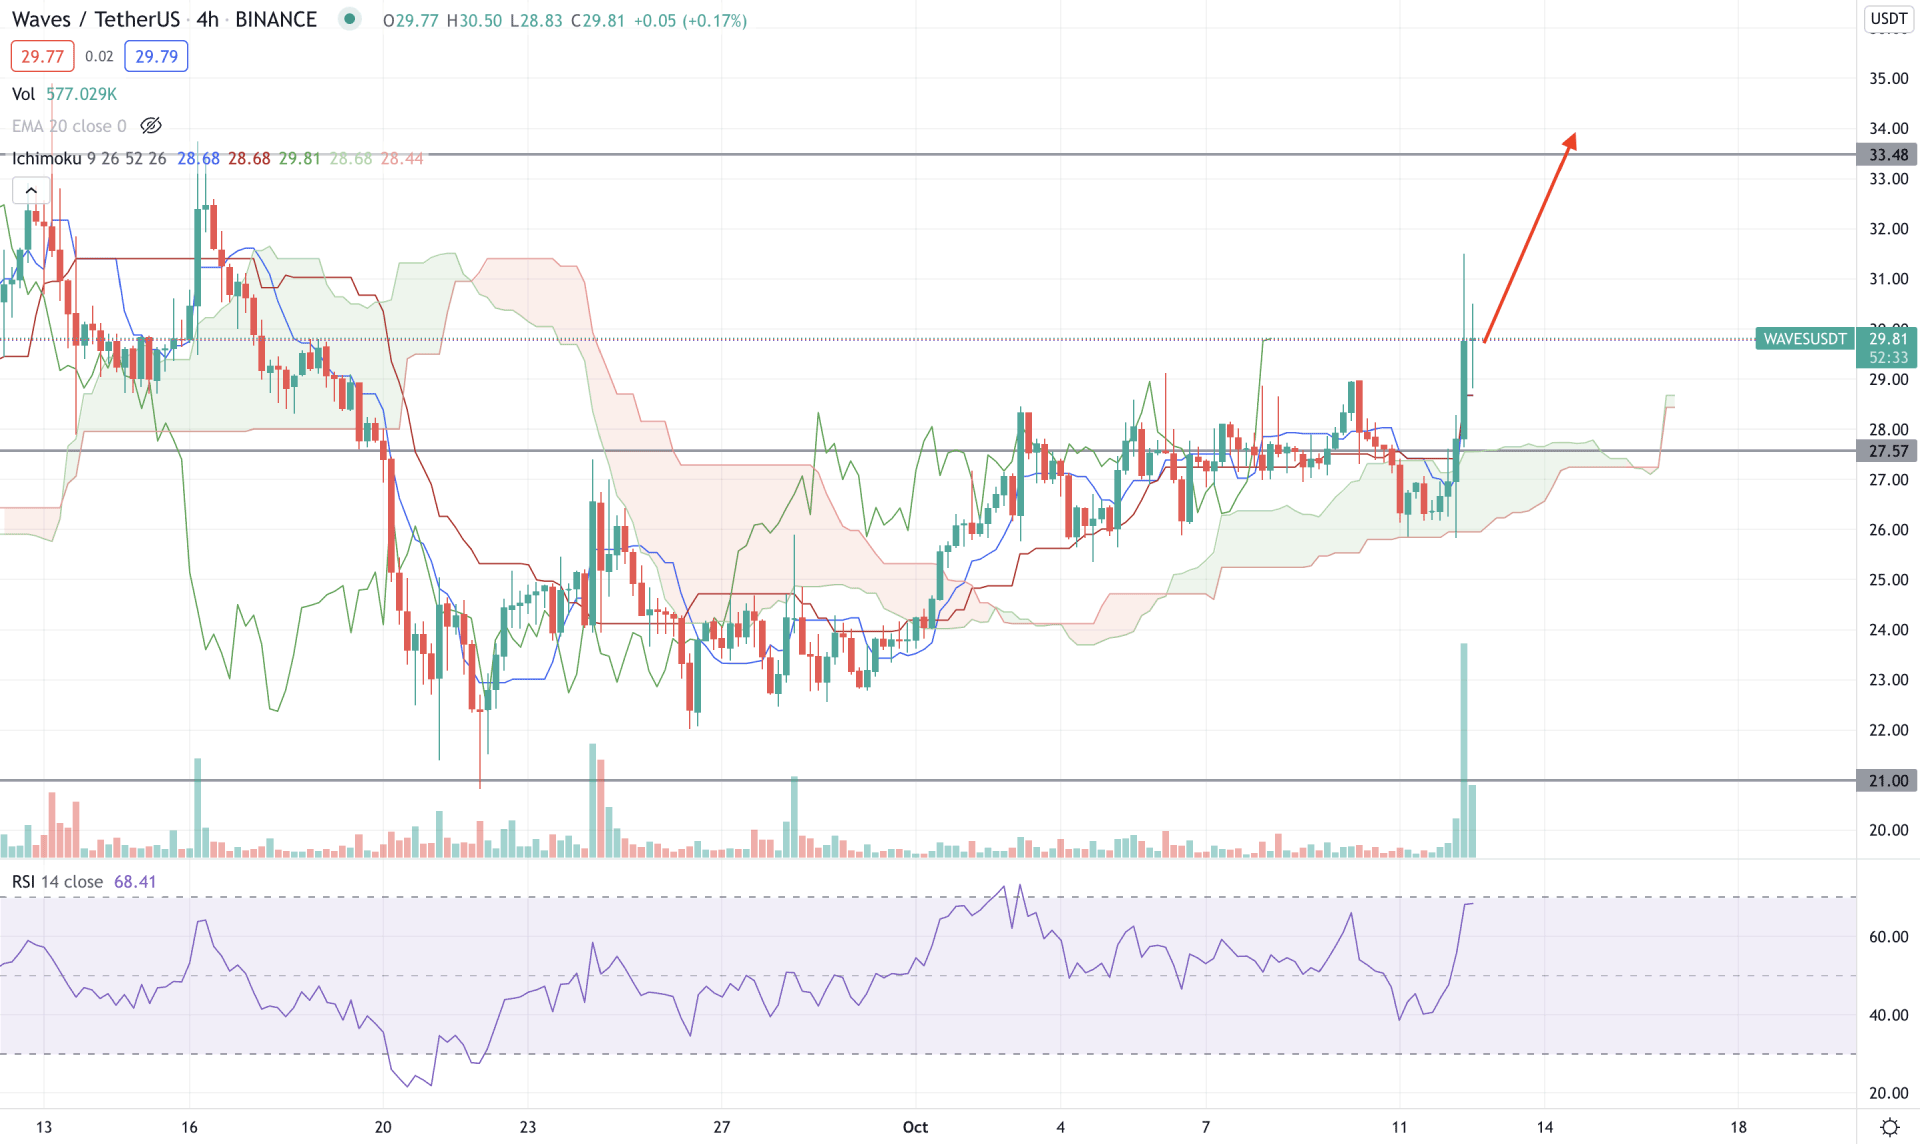
According to the Ichimoku Kinko Hyo, WAVE/USD market sentiment turned bullish as the price showed an impressive bullish pressure today from the cloud support. Meanwhile, the Chikou Span moved above the price while the future cloud turned bullish and spiked higher.
The above image shows how the RSI moved above the 50 levels with a solid bullish momentum while the volume rose higher significantly with the bullish H4 close. Currently, the RSI is below the 70 level, which indicates bullish pressure in the prIn addition, the. The price moved above the dynamic Tenkan Sen and Kijun Sen that increased the possibility of testing the 33.48 resistance level in the coming hours.
On the other hand, bears should wait for an H4 close below the 27.57 event level to consider the upcoming price direction as bearish towards the target of 21.00 level.
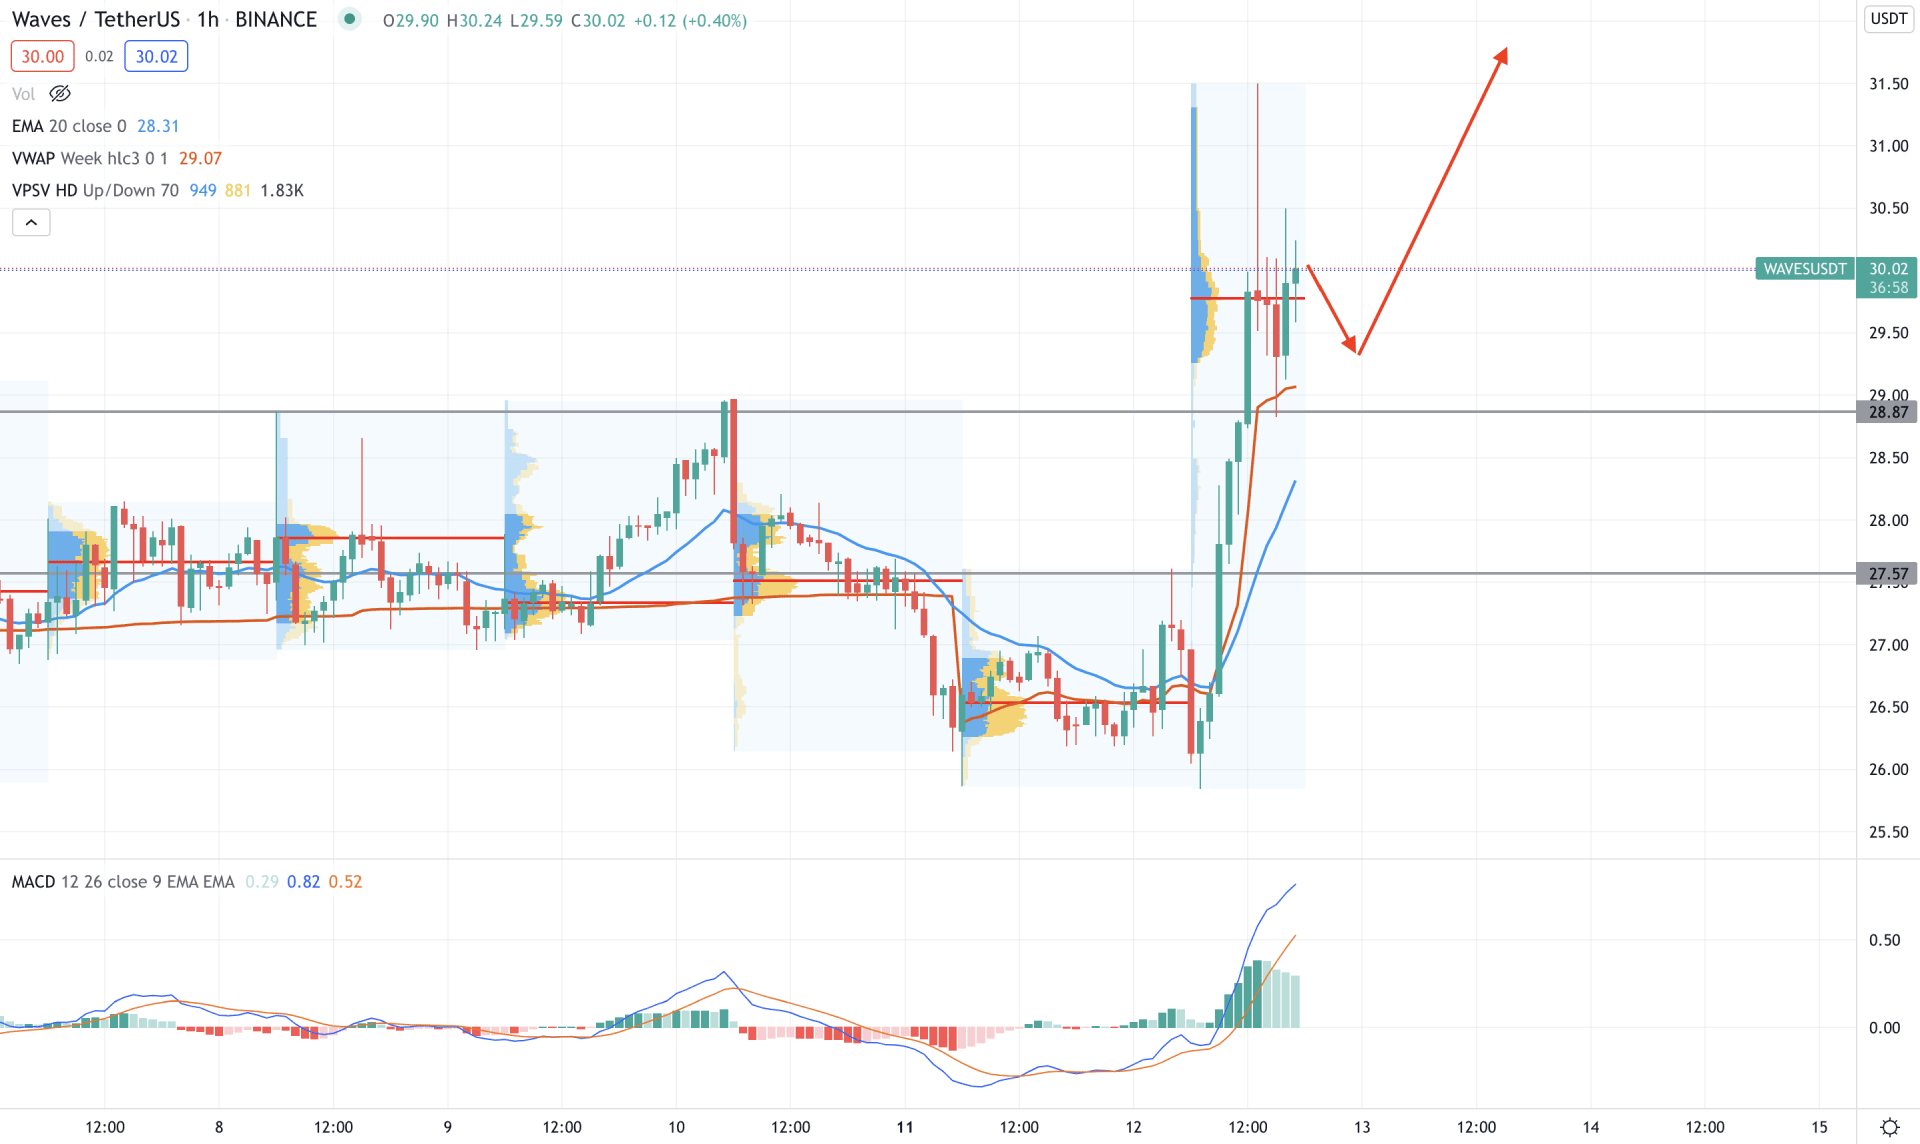
WAVE/USDT showed a solid bullish breakout above the 28.87 level and closed the hourly candle at the 29.80 high volume level in the intraday chart in the intraday chart. Later on, the price became volatile with a spike above the intraday high volume level. However, the current price is still above the dynamic vwap and static 28.87 support level.
The above image shows how the MACD Histogram holds a solid bullish position at the positive zone with a corrective momentum while the dynamic 20 EMA aims higher by increasing the support to the bullish move. Therefore, as long as the price is trading above the dynamic 20 EMA, any bullish rejection would increase the buying pressure towards the 35.00 level in the coming hours. On the other hand, bears may find the current bullish trend invalid if the price exceeds the 27.57 level with a solid bearish H1 candle.
As of the above discussion, WAVE/USDT has a higher possibility of moving up in the coming days as volumes support the current bullish pressure. In that case, the ultimate target of the bull run will be towards the 40.00 level. On the other hand, a stable bearish H4 close below the 27.57 level may alter the current price direction where it may open a room for bears to test the 21.00 level.