
Published: January 11th, 2024
For the current quarter, Visa is expected to disclose earnings of $2.33 per share, which signifies a growth of 6.9% compared to the corresponding period in the prior year.
The earnings estimate gaining consensus for the ongoing fiscal year is $9.90, which signifies an increase of 12.9% year-over-year. The past month has seen no change in this estimation. With no changes in the past month, the consensus earnings estimate for the upcoming fiscal year is $11.15.
In addition to being an essential metric for assessing financial well-being, revenue growth is equally critical for maintaining a profitable business model. The $8.51 billion in sales anticipated by the consensus at Visa for the current quarter represents an increase of 7.2% year-over-year. The projected amounts for the current and subsequent fiscal years are $35.75 billion and $39.28 billion, respectively, which represent increases of 9.5% and 9.9%.
Visa disclosed quarterly revenues amounting to $8.61 billion, reflecting a growth of 10.6% compared to the corresponding period in the prior year. Comparatively, earnings per share (EPS) increased from $1.93 to $2.33 during the same period last year.
Based on the upbeat earnings projection, should you buy the Visa Stock (V)?
Let’s see the complete outlook from the Visa technical analysis:
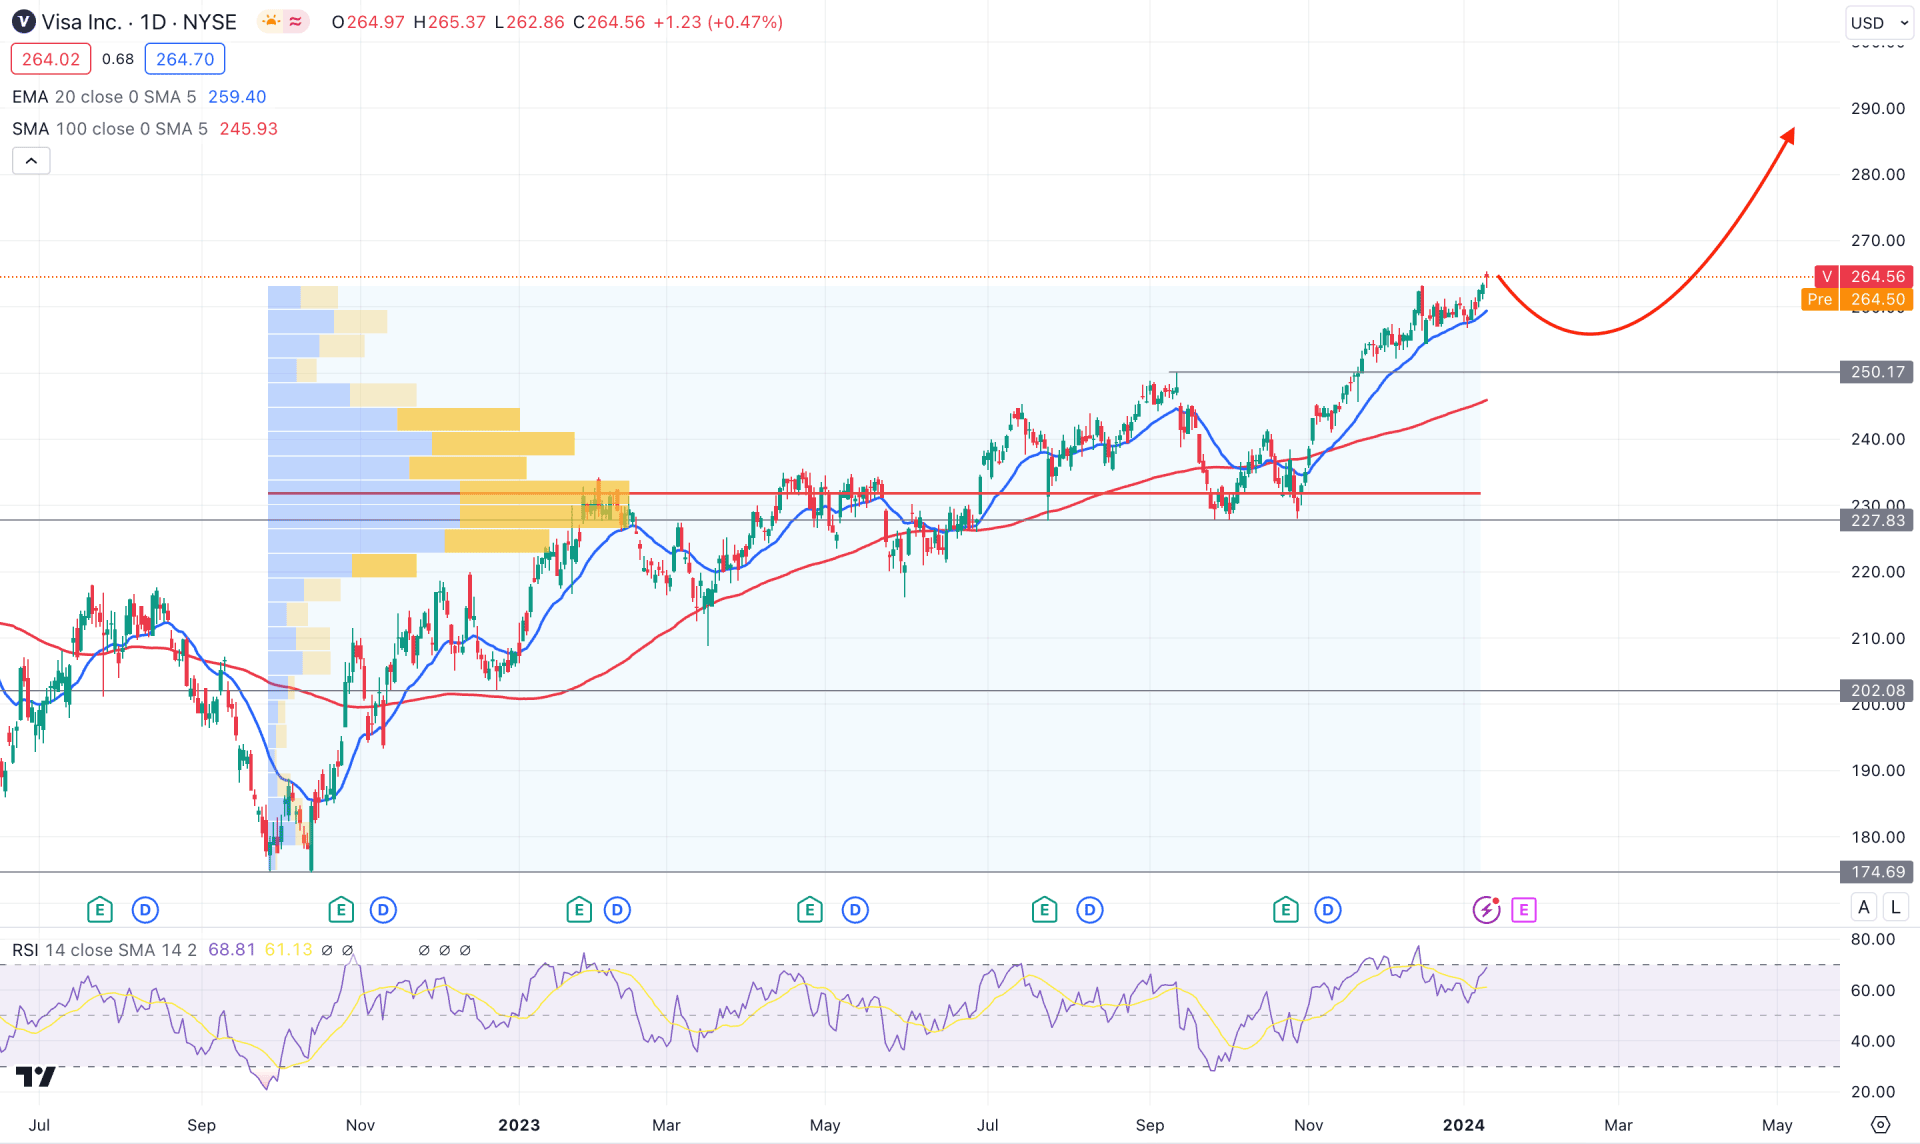
The broader market direction in the Visa stock (V) daily chart is bullish as the recent price shows new higher high formations since the September 2023 low. However, the quarterly earnings report is set to be released this month, where a fundamental push could make a new high above the 280.0 resistance level.
In the higher timeframe, the current bullish pressure is solid from the ongoing monthly bullish rally. A bullish V-shape reversal from a significant static level in the weekly chart backs the existing bullish trend.
In the daily chart, the 100-day Simple Moving Average is the major support, where the current price remains stable above it. Moreover, the dynamic 20-day EMA works as an immediate support with a daily candle above it, which is a sign of a bullish trend continuation.
In the volume structure, the highest trading volume level since the September 2022 low is at 229.55 level, which is below the current price and indicates an active buying pressure in the market.
In the secondary window, the 14-day RSI shows a bullish continuation possibility as it rebounded to the 68.00 level without tapping into the 50.00 line.
The current bullish continuation is solid in the daily price outlook as the price trades above critical high volume levels. In that case, the upward pressure is more likely to extend toward the 180.00 psychological level. On the other hand, a bearish selling pressure with a daily candle below the 227.00 level could extend the bearish pressure toward the 208.71 support level.
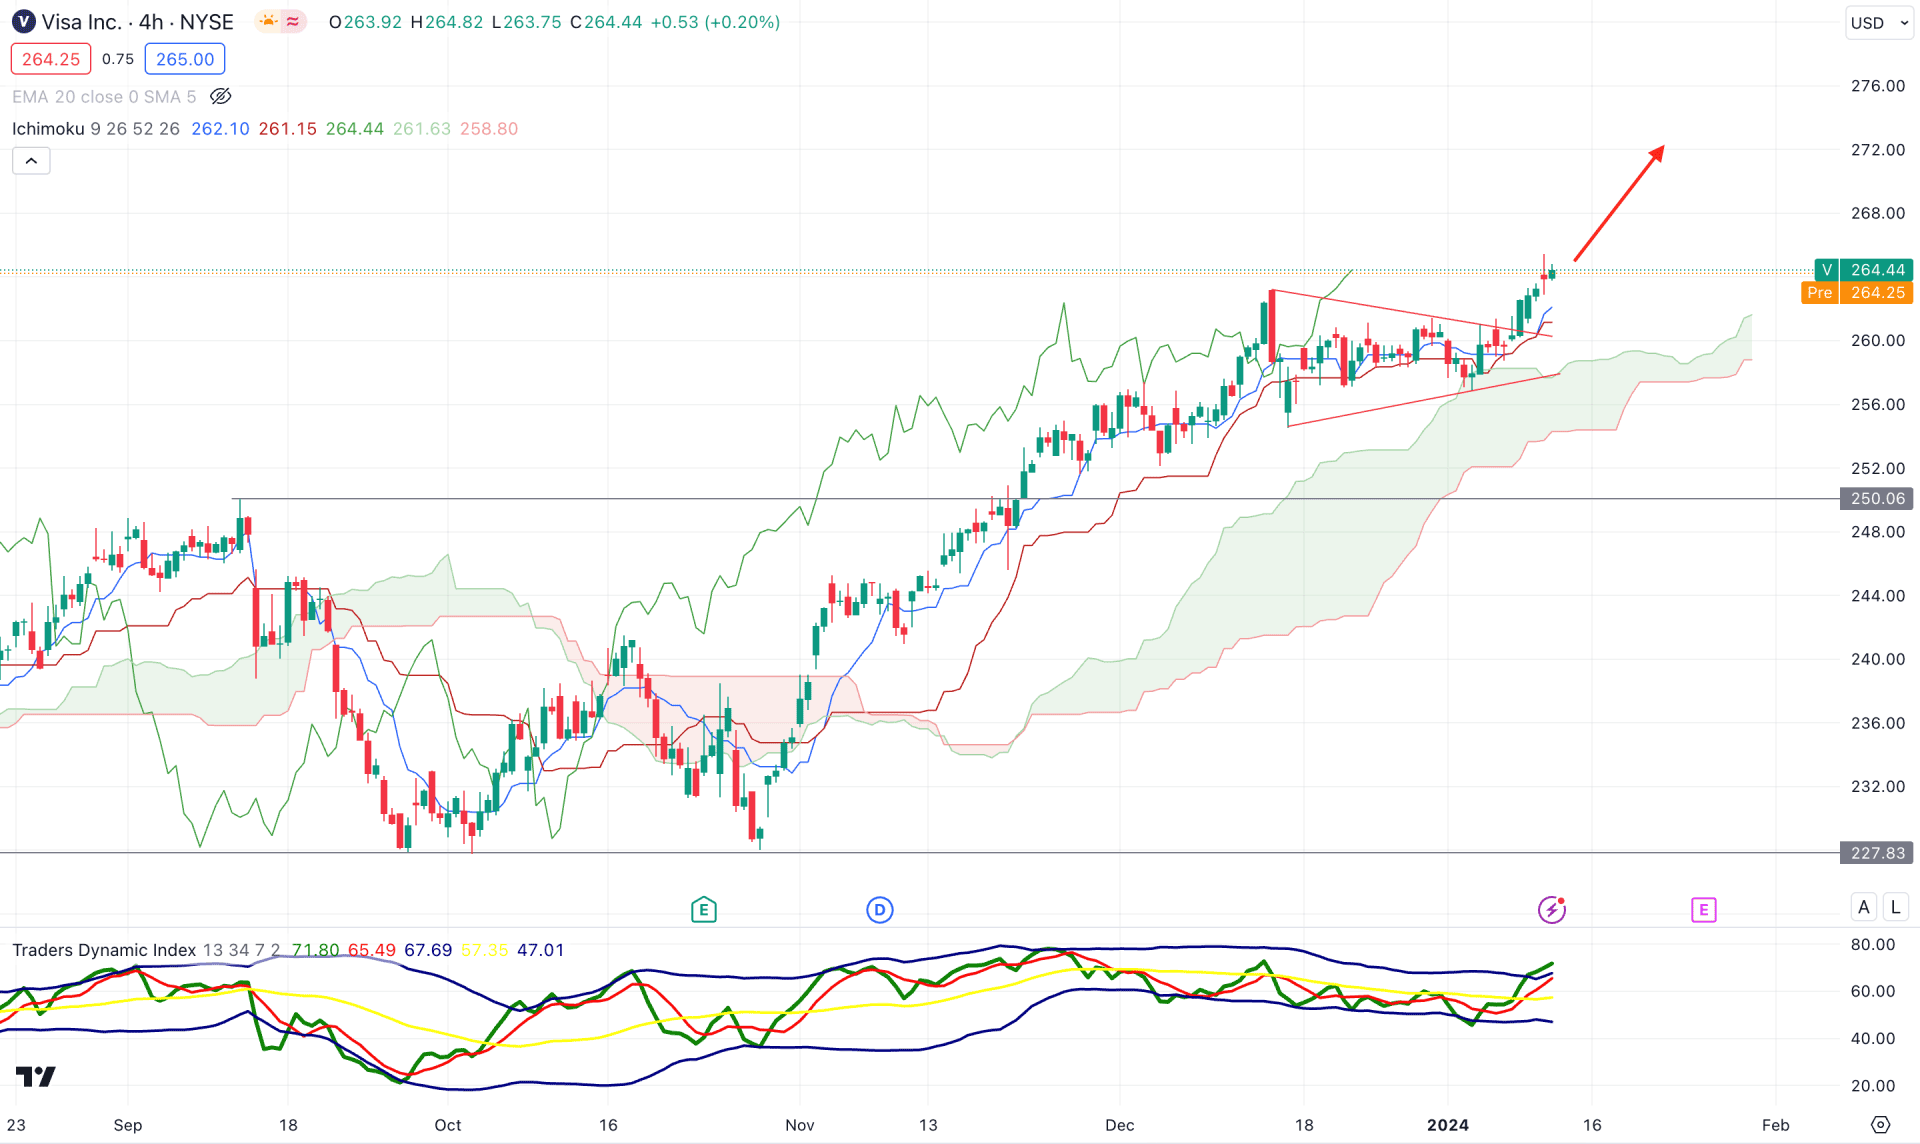
In the H4 timeframe, the current price trades at the Ichimoku cloud area, which came with dynamic support from the Kijun Sen level. Also, the bullish pennant pattern breakout is in play, which could result in a strong trend trading opportunity.
In the secondary window, the current Traders Dynamic Index (TDI) reaches the overbought area, which indicates a short-term bearish opportunity.
Based on the overall market outlook, a strong bullish reversal from the Tenkan Sen support could increase the price towards the 290.00 to 300.00 price area.
On the other hand, a bearish price action below the 250.00 psychological level could indicate a bearish continuation, targeting the 216.18 support level.
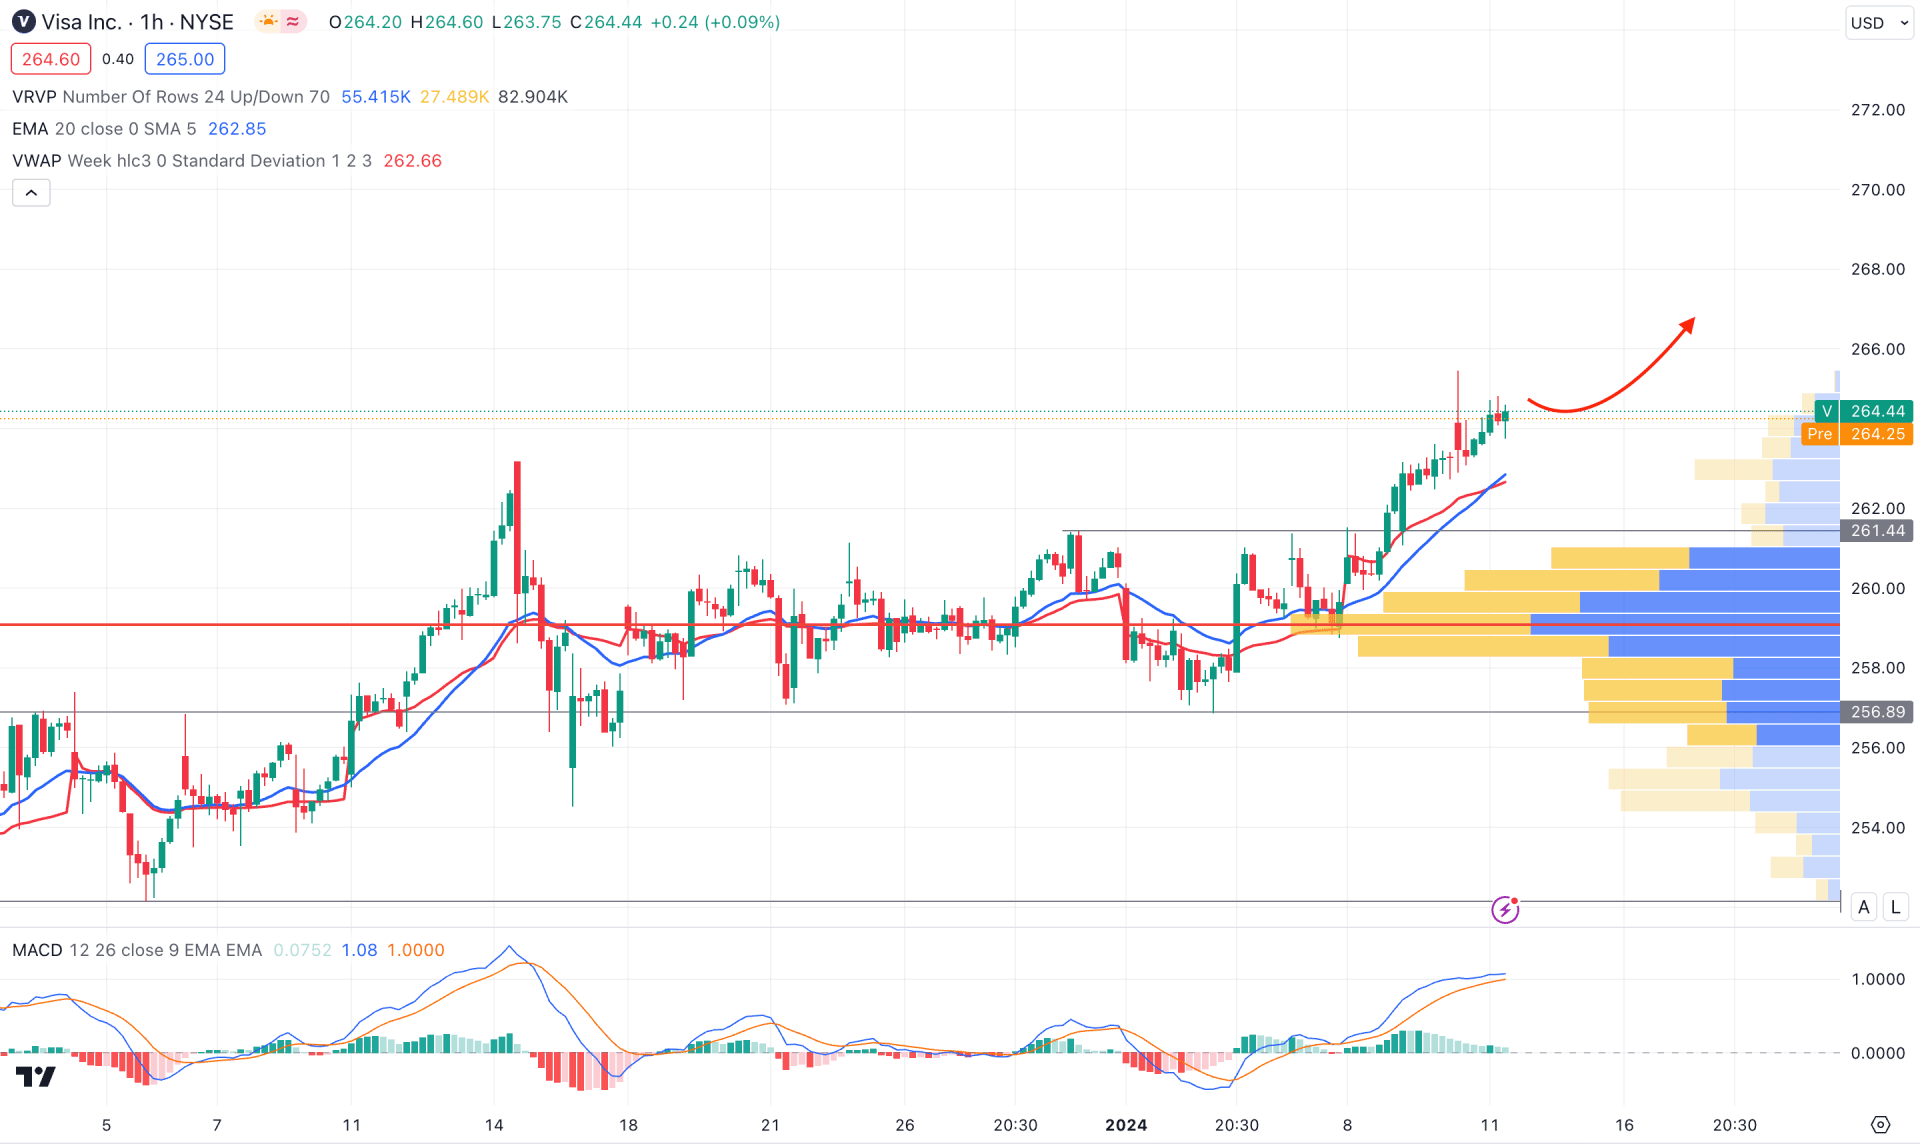
In the H1 timeframe, the overall market pressure is bullish as the visible range high volume level is below the current price.
In the secondary window, the current MACD signal line is above the neutral level with a positive Histogram. It is a sign that the overall market pressure is bullish, which can extend the momentum in the coming days.
Based on the H1 structure, a bearish pressure with a bullish reversal from the dynamic support level could be a long opportunity, targeting the 290.00 resistance level. On the other hand, a deeper discount is possible towards the 261.00 support level, but a bearish H1 candle below the 259.11 high volume level could be a short opportunity for this stock.
Based on the current market outlook, the overall momentum is bullish, and any intraday dip could offer a high probability of trading opportunity. However, a strong bearish reversal in the intraday H1 candle could be a short opportunity for this stock.


