Published: August 1st, 2024
The USDCHF pair has been falling for multiple weeks, supported by the strong greenback. The US economy is improving, and the job vacancy data is positive, so the US has performed well recently.
The Conference Board's Consumer Confidence Index indicated a slight improvement in US consumer confidence, which increased to 100.30 in July after a downwardly amended 97.8 in June. In the Job Openings and Labor Turnover Survey (JOLTS), the US Bureau of Labor Statistics (BLS) disclosed that, as of the last working day of June, there were 8.184M job openings, slightly fewer than the revised 8.23 M in May but still more than the 8.03M market anticipation.
Given the strong US economic growth, investors anticipate that the Fed will hold interest rates on Wednesday, but they also expect the bank to leave the possibility of a September cut open. Accordingly, markets offered an 80% chance of a rate cut; however, this week's labor market data will shape those projections.
Let's see the further aspect of this pair from the USDCHF technical analysis:

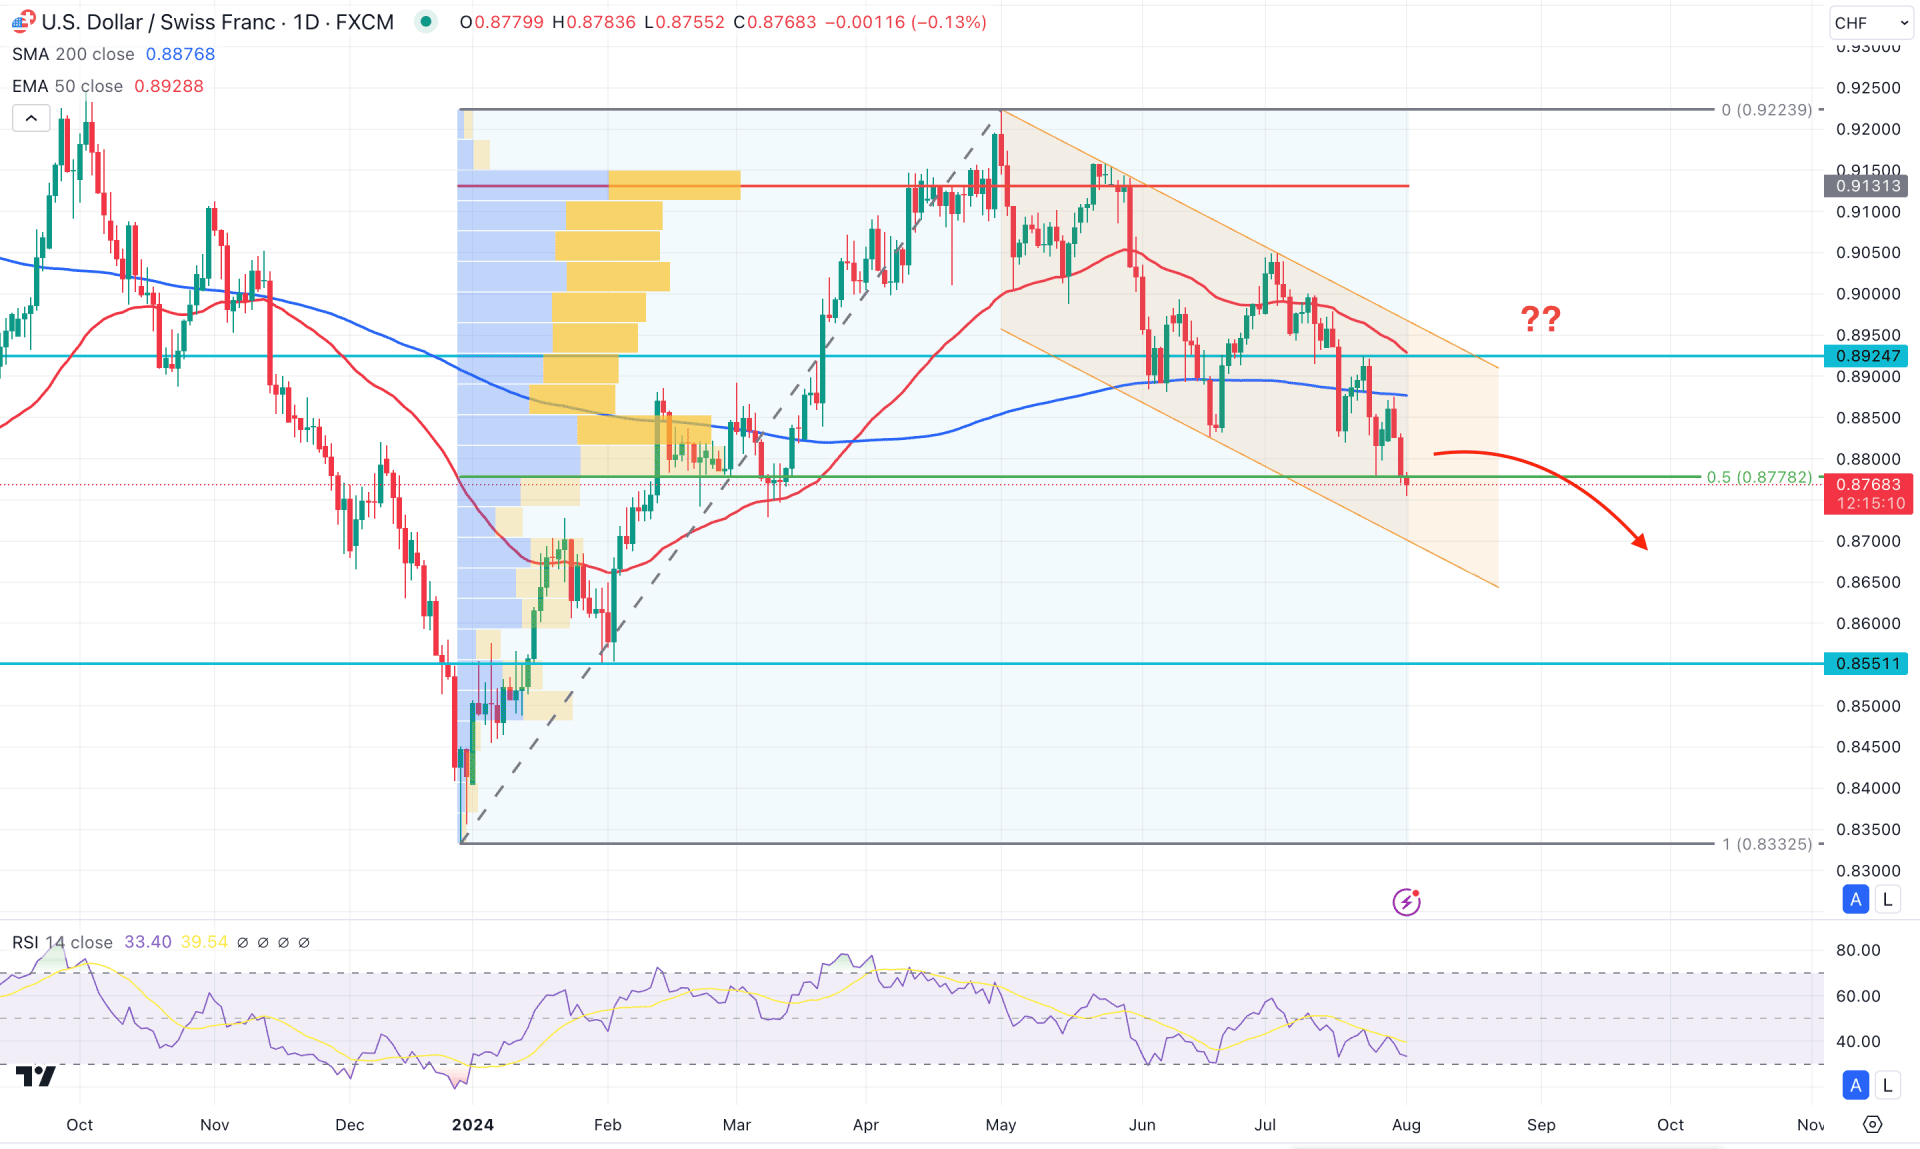
In the daily chart of USDCHF, the recent price hovers within a descending channel, suggesting ongoing bearish pressure. Although the most recent price reached the three-month low, a solid bottom has not yet formed. In that case, more downside pressure might come, but a considerable upward correction could also happen.
In this context, investors should monitor how the price is trading at a higher timeframe as the daily trend is not clear. The Hammer candlestick that formed in June was fully recovered and closed below the existing monthly low in July. This suggests that the bottom that was formed in the Hammer low was not valid, and the bears had taken their positions below this zone. Also, the recent weekly price suggests a bearish continuation as stable downside pressure is visible below the 50-week SMA line.
In the volume structure, a corrective momentum is visible, where the current high volume line since January 2024 is at 0.9131 level, which is way above the current price. In that case, an ongoing bearish pressure is visible below the high volume level, while an upward correction is pending as a mean reversion. In this context, a skeptical approach is needed to gauge the future price direction, using a proper price action candlestick formation.
The 200 day SMA and 50 day EMA remain above the current price with a bearish slope. It is a sign of a valid bearish continuation, from where any death cross continuation strategy might offer a trend trading signal.
The 14-day Relative Strength Index (RSI) remains below the 50.00 line after having a failure to reach the 70.00 overbought level.
Based on this outlook, investors might expect the downside pressure to continue after completing a valid upward correction. The primary bearish approach is to look for a valid bearish reversal candlestick formation 0.8850 to 0.8924 area before continuing towards the 0.8551 level.
On the other hand, an immediate bearish continuation might find support from the channel low, from where a decent bullish recovery might happen. Also, a bullish break above the channel resistance with a stable market above the 0.8950 level might validate the long-term bullish opportunity, aiming for the 0.9100 area.

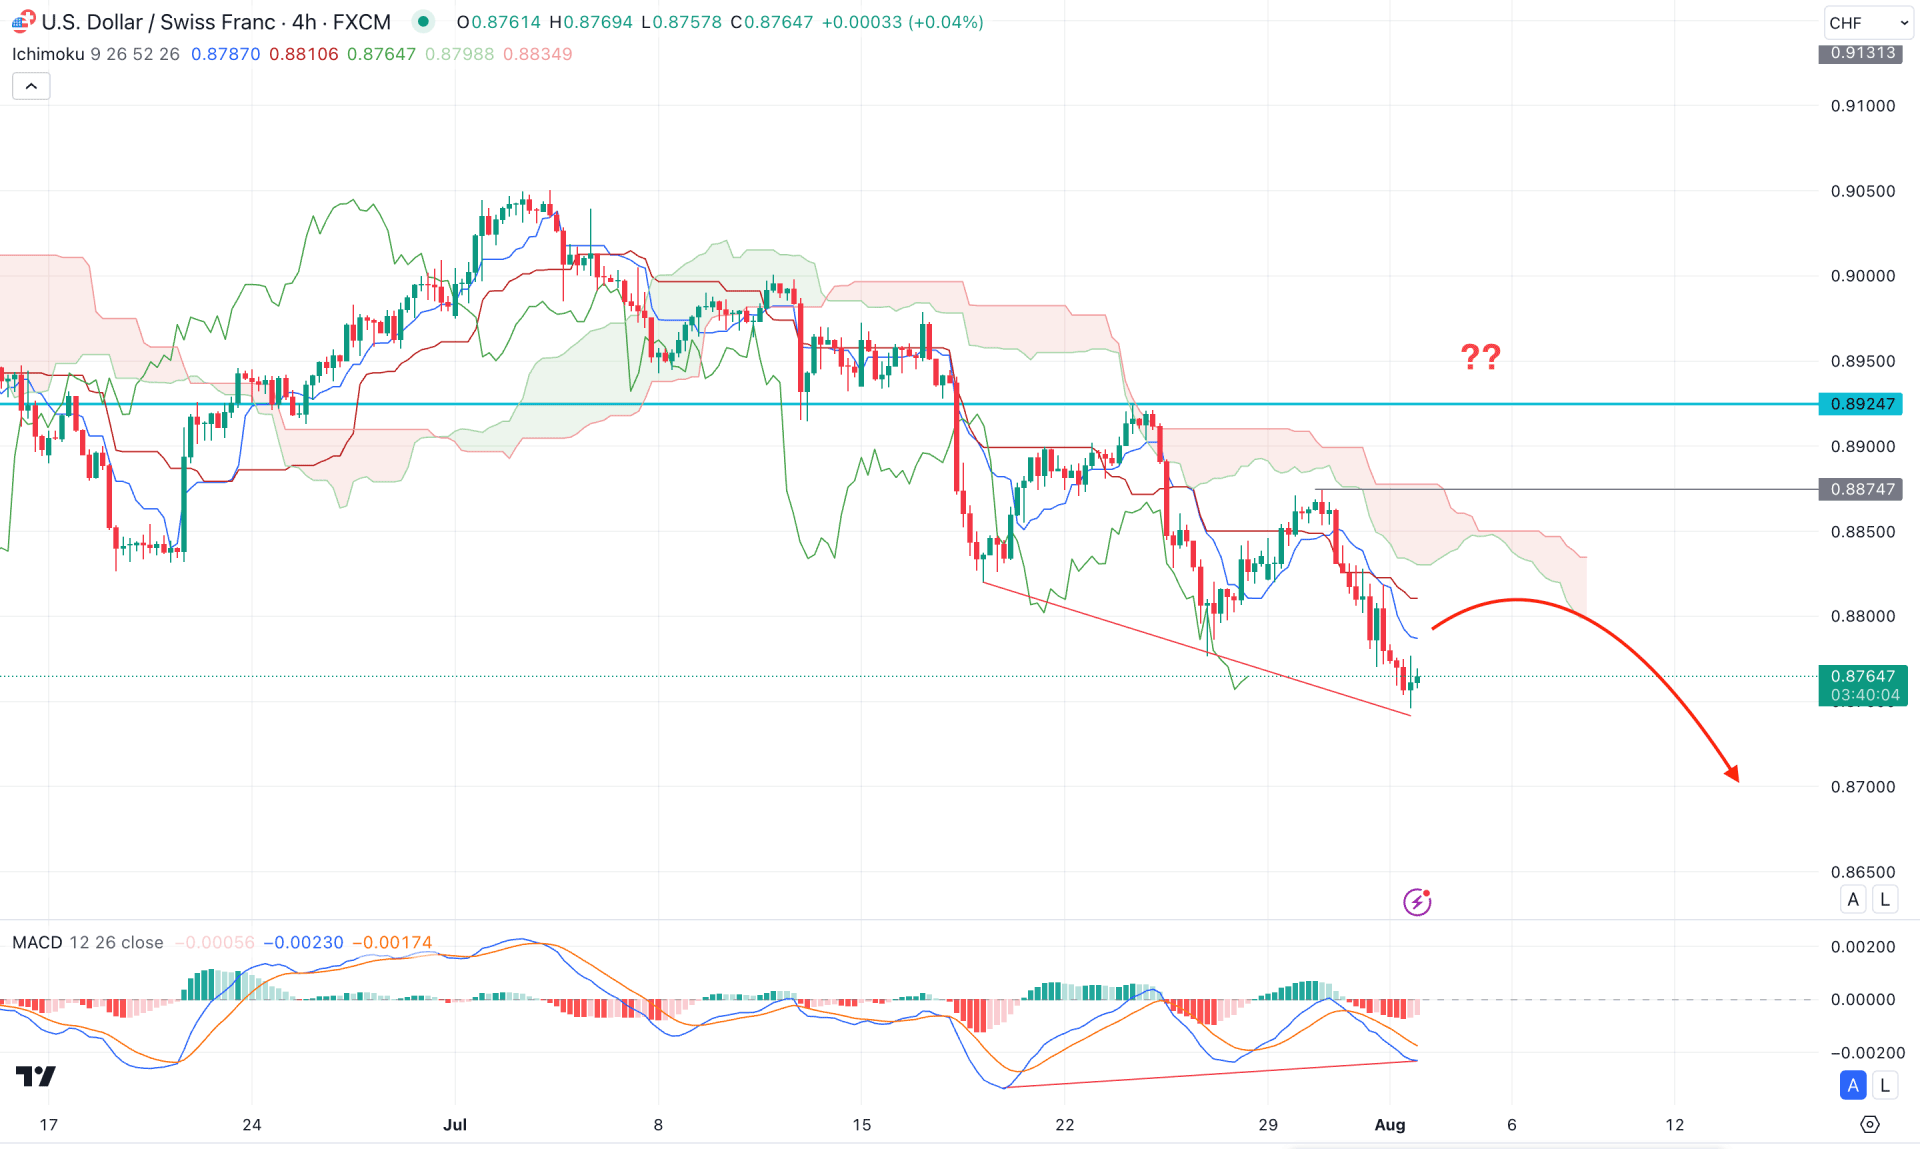
In the H4 timeframe, the recent price remains bearish, where the dynamic Ichimoku Cloud is working as a major resistance. Moreover, Tenkan Sen and Kijun Sen are above the current price with a bearish slope, suggesting a confluence of bearish factors.
Despite the downside, a minor barrier is visible from the MACD indicator. As per the current reading, the MACD signal line failed to follow the lower low formation in the main price chart. As a result, a divergence is formed, which might work as a bullish signal after forming a valid price action.
Based on the H4 outlook, an immediate bullish correction is highly possible toward the dynamic Kijun Sen resistance. In that case, a bearish recovery from the 0.8830 to 0.8880 area might resume the existing trend toward the 0.8700 psychological level.
On the other hand, a bullish reversal needs a valid breakout above the 0.8880 level. In that case, bulls might take over the price, aiming for the 0.9000 level.

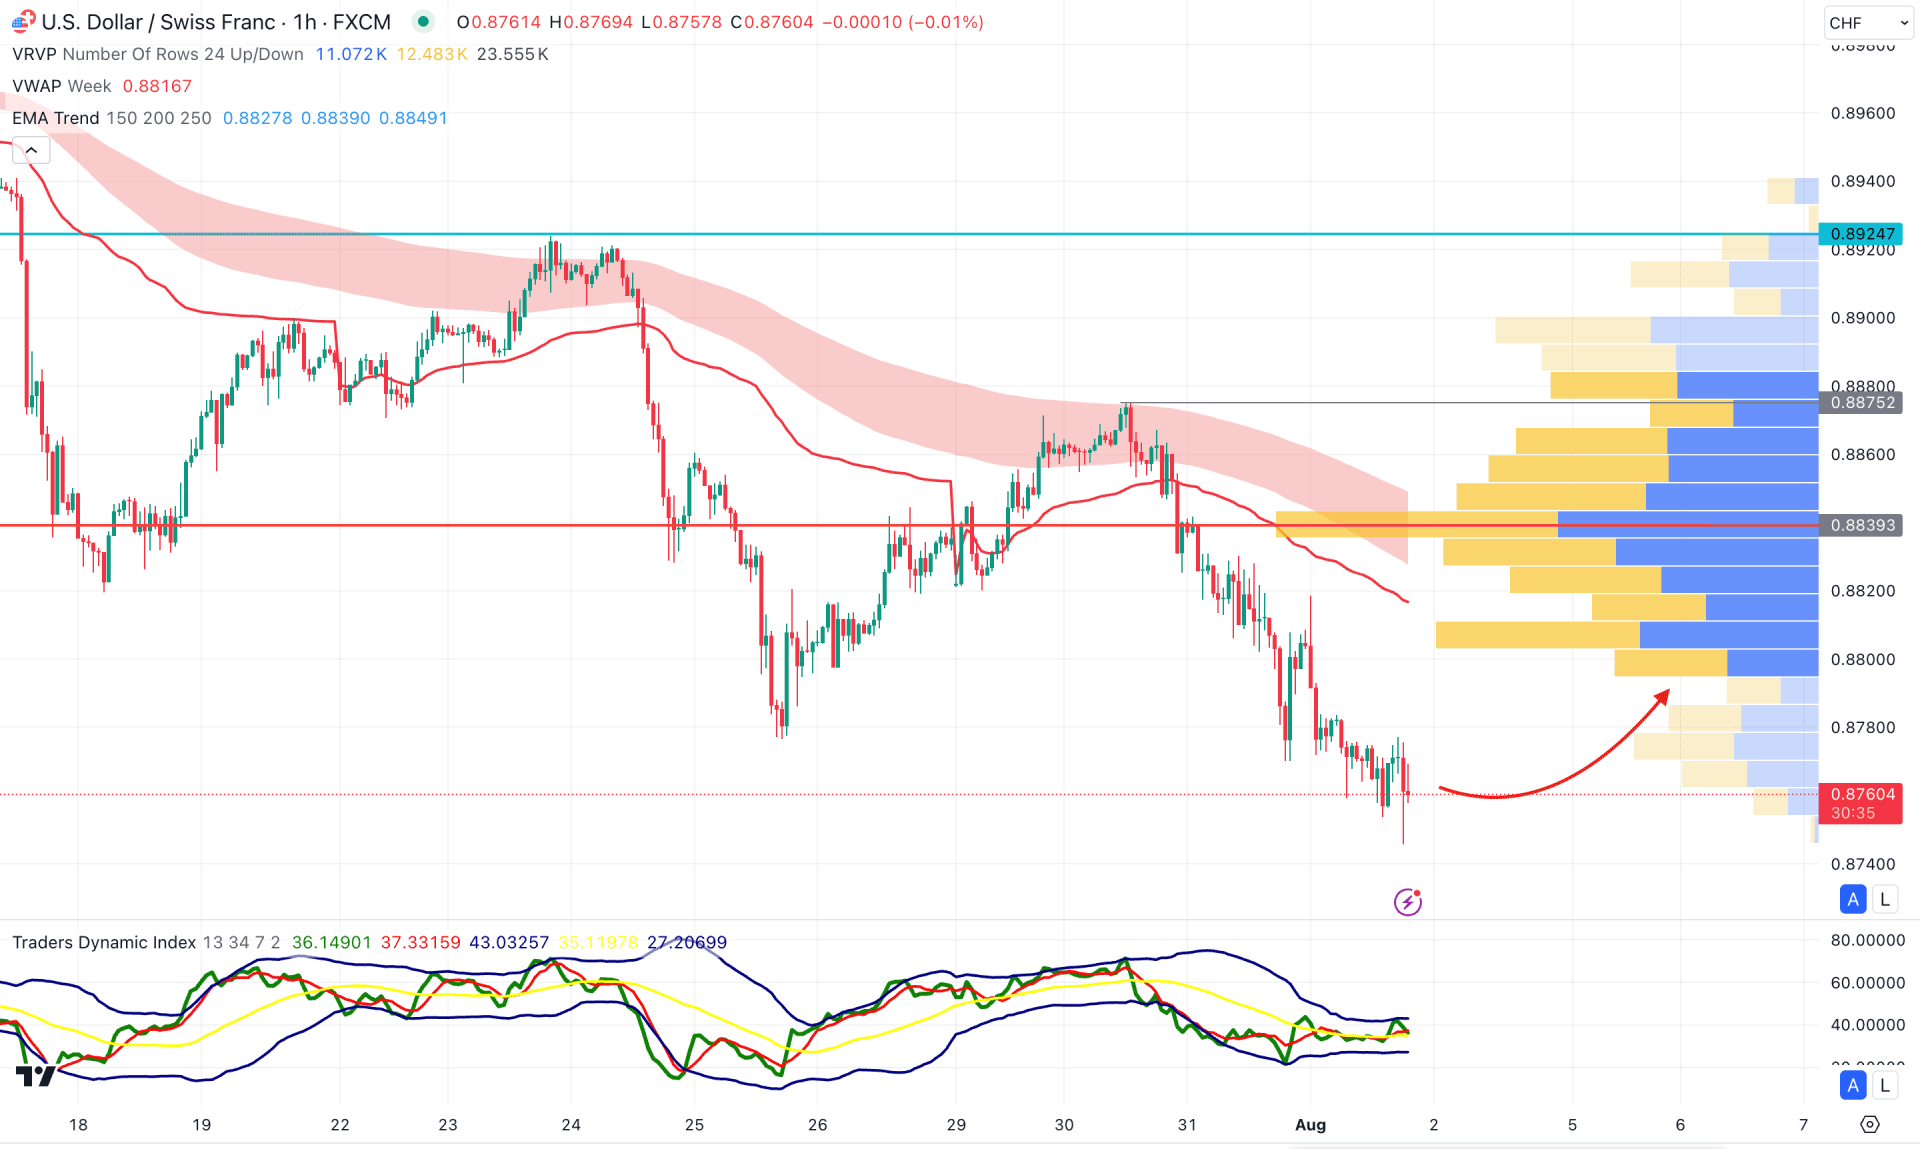
In the hourly time frame, the visible range high volume level is above the current price, working as a crucial resistance with the dynamic weekly VWAP level. Therefore, as long as the current price remains below these crucial levels, bears have a higher possibility of taking the price even below the 0.8740 low.
In the indicator window, the current Traders Dynamic Index (TDI) remains sideways at the midline, suggesting a corrective price action.
Based on the H4 structure, an immediate buying pressure with an hourly candle above the 0.8840 level could be a potential bullish reversal signal, activating the upward correction in the daily channel.
On the other hand, the ongoing price action is still bearish, and the trend might resume at any time.
Based on the current market outlook, USDCHF is more likely to extend the downside pressure until a bottom is formed in the hourly chart. Investors should closely monitor how the price as a valid trend might form after releasing the Nonfarm payroll this week.