Published: November 21st, 2024
Cryptocurrency enthusiasts have had an exciting year as the market's value has continued to rise. Though only a handful are worth observing, many new protocols have surfaced from the ether amid the excitement. Analysts have projected that Lunex Network, specifically, could soon surpass significant investments in Tron (TRX) and Toncoin (TON). It has been hailed as an innovative protocol with an opportunity for enormous returns. Why are so many owners of Tron and Toncoin grabbing tokens?
The introduction of update v2024.10 has brought significant technical enhancements to the Toncoin (TON) blockchain. This most recent update aims to improve garbage gathering and coordination speed, which will especially help structures with less efficient disk operations.
It has also enhanced Distributed Hash Table lookup procedures, decreased network traffic, and optimized channel development, all of which have enhanced network adaptability overall.
This Toncoin update introduced necessary bug fixes to address risk factors in FunC, the programming language used by Toncoin for smart contracts. Changes were also made to the TON Virtual Machine to improve functionality and safeguards. By strengthening Toncoin's infrastructure, these updates hope to provide developers and users with enhanced functionality and a more dependable environment.
Is it the right time to buy Toncoin? Let's see the detailed outlook of this coin from the TON/USDT technical analysis:

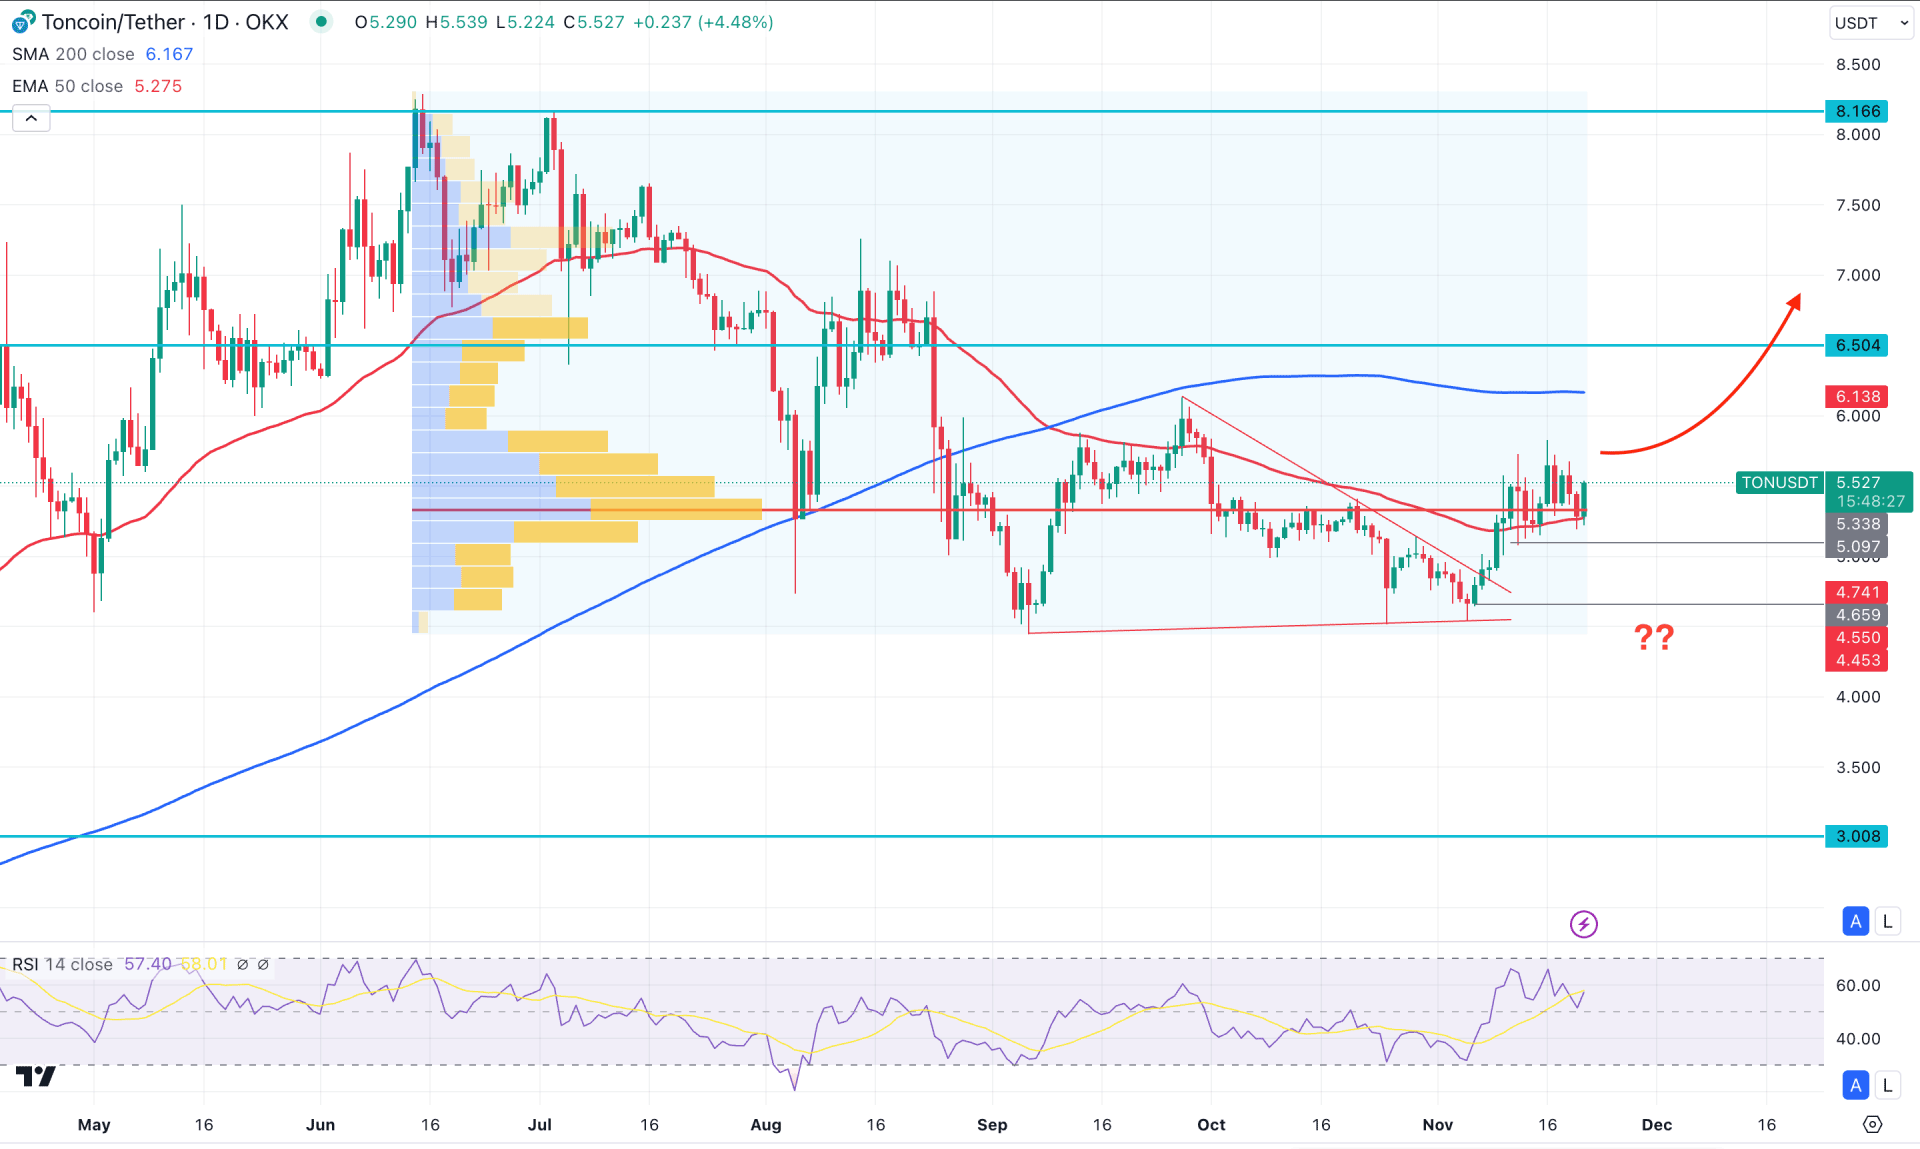
In the TON/USDT daily chart, the recent price showed a corrective momentum after having a decent bullish breakout from the range breakout. As the current price hovers above near-term dynamic lines, investors might expect a bullish continuation after a valid price action.
In the higher timeframe, the current price is trading above the crucial monthly support, while the current price is still hovering within the bearish body formed in October. Primarily, a bullish reversal with a stable market above the October high could confirm the upcoming bull run. Moreover, an early buy signal is present from the weekly timeframe as the current price aimed higher from the engulfing pattern formation.
Looking at the volume structure, the highest activity level since June 2024 is closer to the current congestion area. It is a sign of an order building from where a breakout can come.
In the main price chart, an early bullish signal is present as the current price hovers above the dynamic 50-day Exponential Moving average line. Moreover, the Relative Strength Index (RSI) remains above the 50.00 neutral line, supporting the buying pressure.
Based on the daily market outlook of TON/USDT, an immediate bullish daily candle from the 5.680 high could activate the long opportunity, aiming for the 6.504 level. Moreover, overcoming the 1s200-day SMA with a daily candle can boost the upward pressure and find resistance from the 8.000 psychological lines.
On the bearish side, a downside correction might appear after having a bearish daily candle below the 50-day EMA. In that case, the primary target would be the 4.679 level. Moreover, breaking below this line would increase the downside pressure aiming for the 3.000 area.

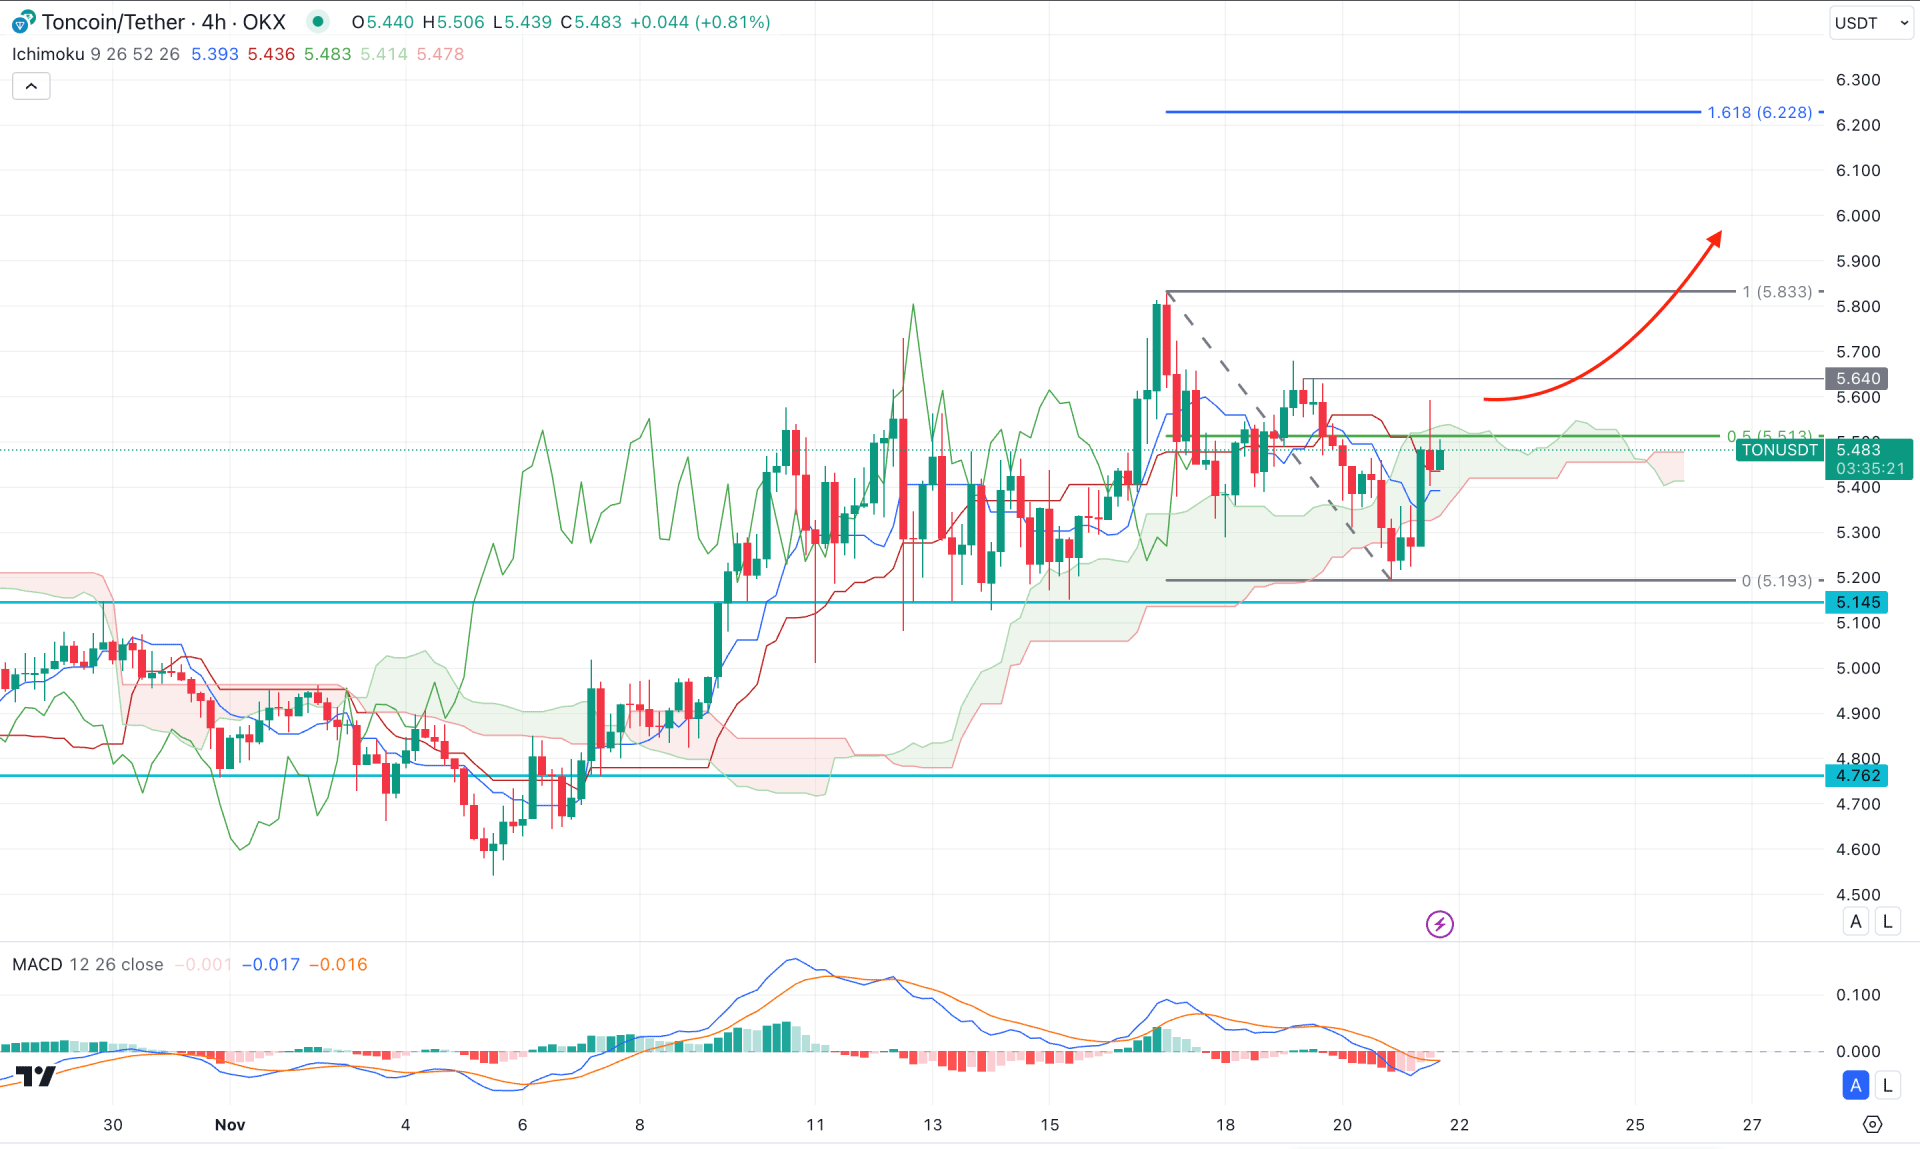
In the H4 timeframe, a consolidation is visible, with the current price hovering within the Ichimoku Cloud zone. As the current price is holding momentum after the bullish cloud breakout, investors might expect the buying pressure to extend.
In the secondary window, the MACD Signal line failed to follow the price trend, forming a potential divergence. However, the MACD Histogram started to lose the bearish pressure and reached the neutral level.
Based on the current Ichimoku Cloud outlook, a bullish breakout above the 5.640 level could be an immediate long signal, aiming for the 5.833 level. However, a downside correction with a valid buying pressure from the 5.400 to 5.140 zone could be another long opportunity, targeting the 6.228 level.
On the bearish side, a failure to hold the price above the cloud low could be a challenging factor for bulls. In that case, a bearish H4 candle below the dynamic Kijun Sen could lower the price towards the 4.700 area.

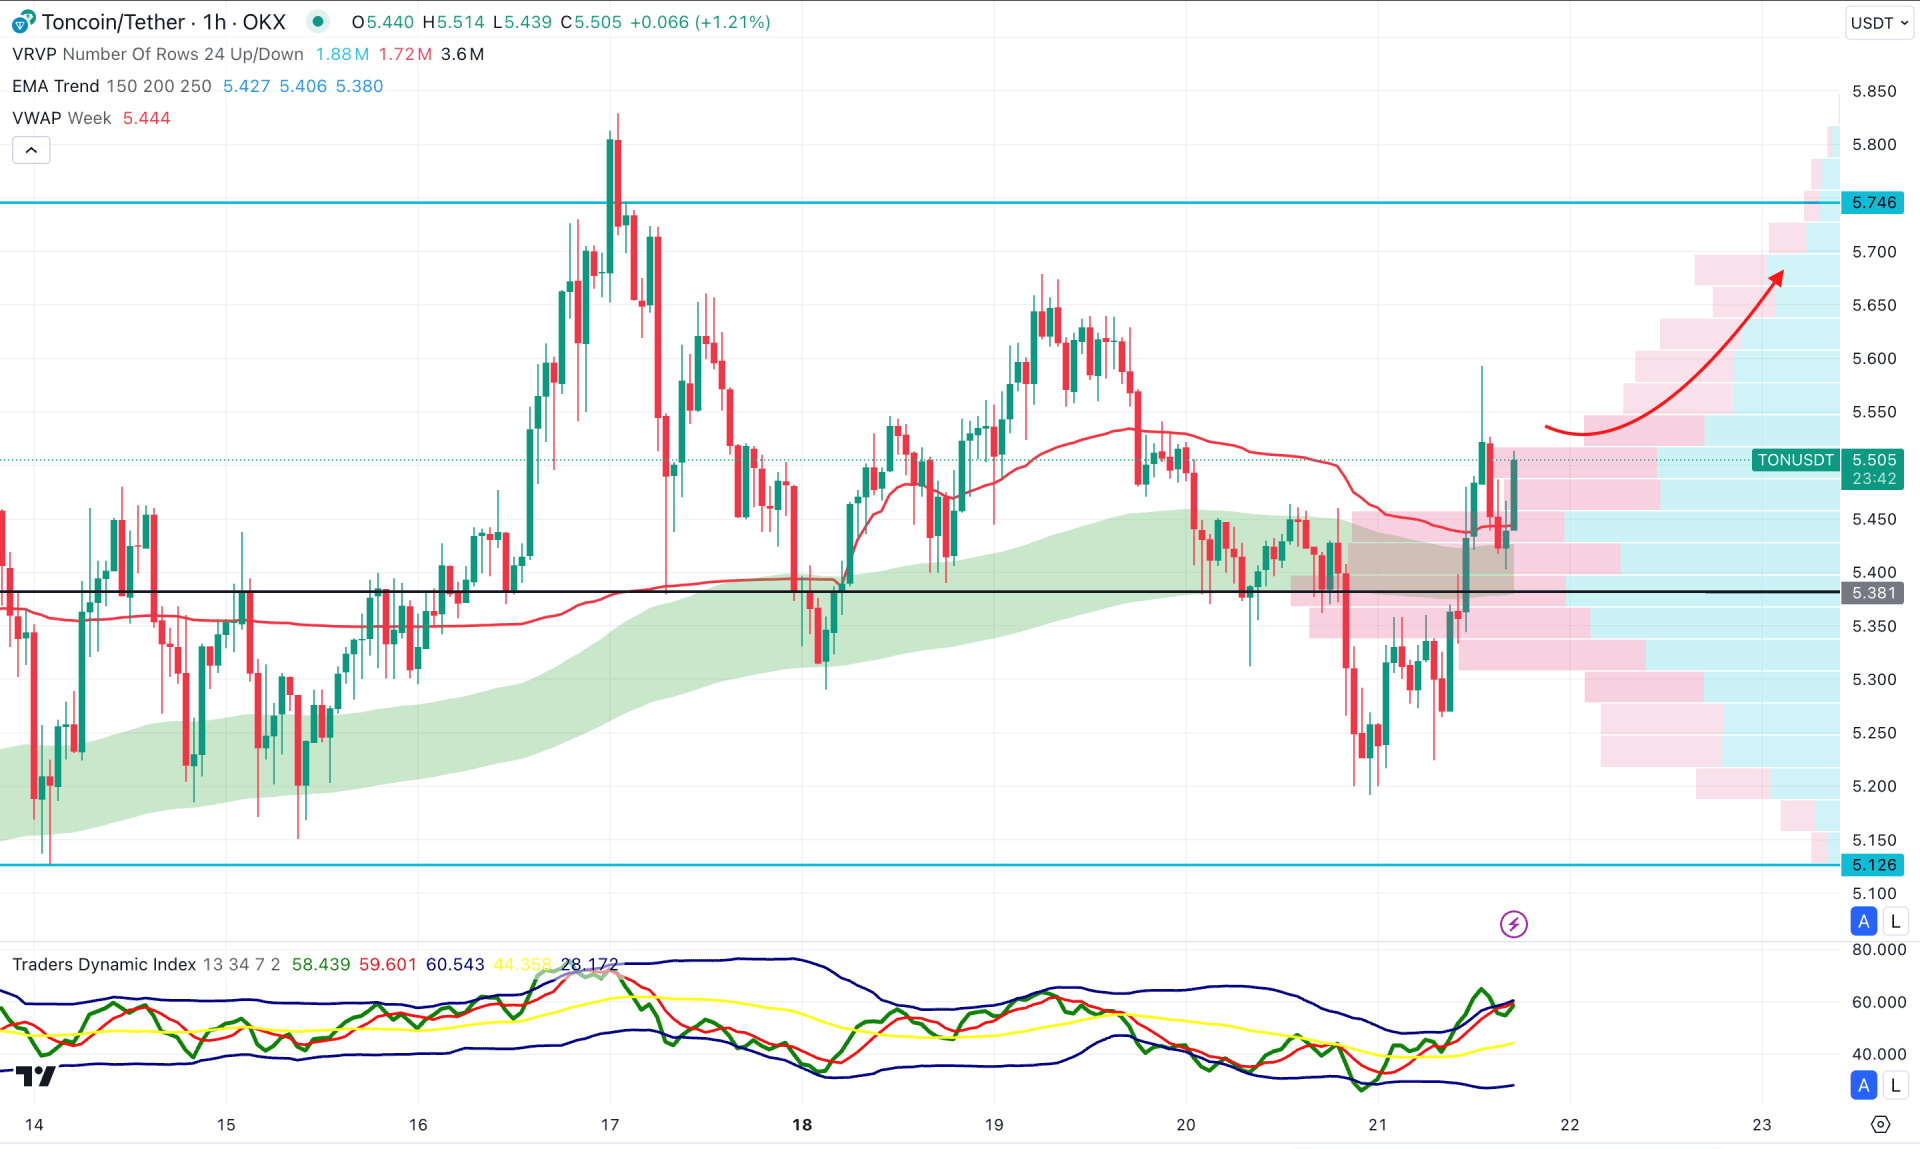
In the hourly time frame, the TON/USDT is trading within a buying pressure as the current price hovers above the crucial visible range high volume line. Moreover, the Moving Average wave consists of 150 to 250 MA below the current price and working as an immediate support.
In the secondary window, the Traders Dynamic Index is at the overbought level suggesting an extreme bullish pressure.
In this outlook, investors should monitor how the price trades above the MA wave as the recent bullish rebound from the weekly VWAP line could extend the buying pressure above the 5.700 level.
The alternative trading approach is to look for a bearish opportunity after having a solid rebound below the 5.381 static line. In that case the downside pressure might extend the loss towards the 5.120 key support level.
Based on the current market outlook, TON/USDT is likely to extend the buying pressure as the current price remains sideways after a symmetrical triangle breakout. Also, an early bullish signal is visible in the intraday price; a valid bullish range breakout could extend the buying pressure with a bullish impulsive wave.