Published: January 24th, 2024
Since its inception in 2024, the SUI blockchain has expanded substantially, overtaking prominent entities in the decentralized finance (DeFi) domain. Significantly, SUI has surpassed well-established entities such as Bitcoin and Aptos, signifying its prominence in the industry.
The total value secured (TVL) on the SUI network has experienced an extraordinary increase in the past year. Since mid-2023, when it was less than $12 million, the TVL has increased dramatically, eclipsing $360 million in the first month of the year. Additionally, SUI has surpassed other DeFi networks, such as Kava ($251 million TVL), Near ($94 million TVL), and Metis ($124 million TVL).
DeFi TVL has surpassed $72 billion in 2024, a significant increase from its October 2023 of $47 billion. The revival can be ascribed to various factors, including the heightened acceptance of platforms such as SUI.
Should you buy the SUI token now? Let’s see the future price direction of this token from the SUI/USDT technical analysis:
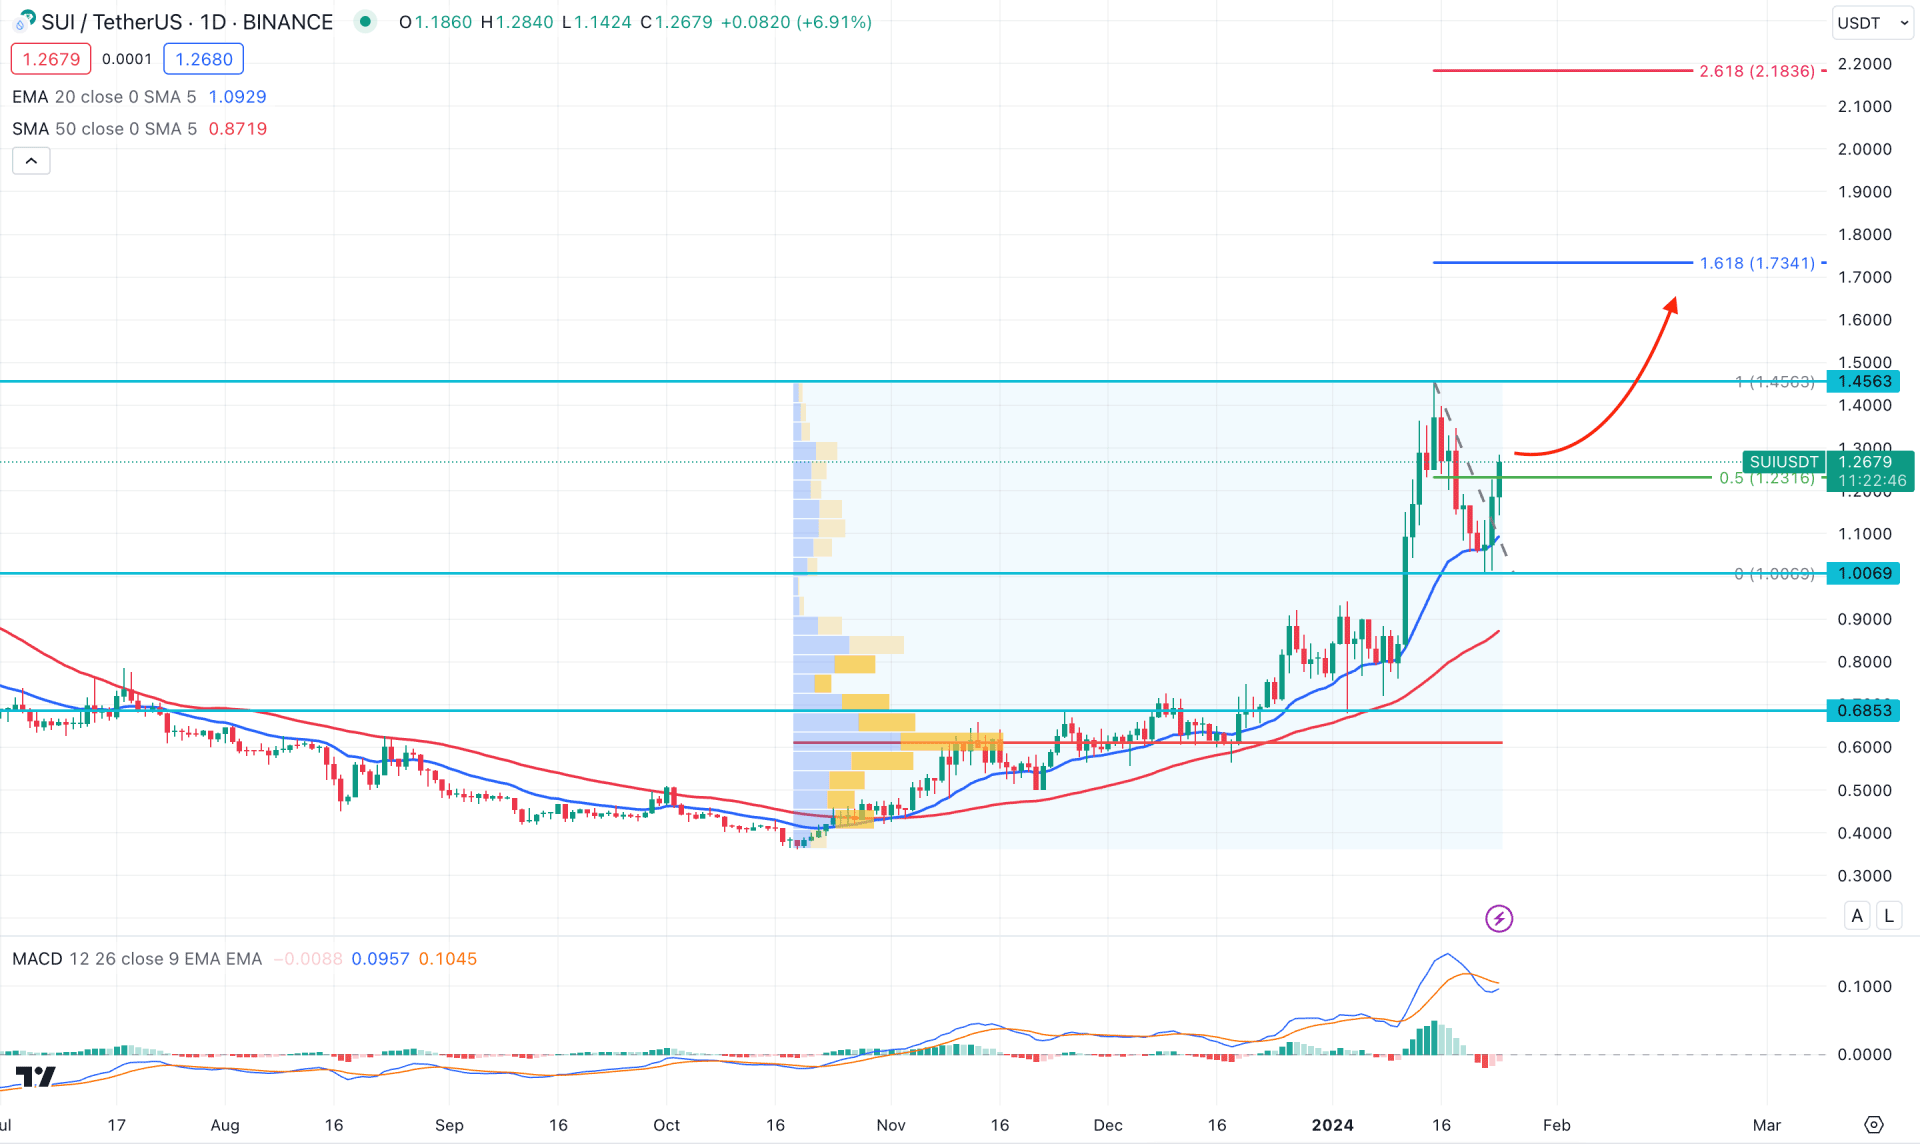
In the daily chart of SUI/USDT, the overall market trend is bullish as the recent price shows an impulsive bullish trend from the 0.3614 bottom. In this structure, the ideal trading approach is to find a long opportunity after a considerable bearish correction.
In the monthly candlestick pattern, three consecutive bullish months are present to support the ongoing bullish trend. Moreover, the divergence with the current Bitcoin trend after the ETF approval could work as a confluence bullish factor. In the weekly chart, a bullish inside bar is visible, where the current candle works as an upward continuation from the inside bar low.
In the volume structure, the most active level since 16 October 2023 suggests ongoing buying pressure. The price keeps pushing higher from the high volume level with no new significant volume formation at the resistance area. It is a sign that the existing upward momentum is still valid and can take the price even higher.
In the daily chart, the most recent price shows a descending channel formation, from where a bullish daily candle is visible from the 1.0069 support level. As an impulse is ongoing from the near-term bottom, investors might expect the buying pressure to extend in the coming days.
In the main chart, the 50-day SMA and 20-day EMA are below the current price with a bullish slope. Moreover, the MACD Histogram lost the downside pressure and reached the neutral level, while the signal line is at the positive area.
Based on the daily outlook of SUI/USDT, the ongoing buying pressure is valid and can take the price higher to the 1.7341 level, which is the 161.8% Fibonacci Extension level from the most recent swing.
On the other hand, a failure to break above the 1.4509 level with a selling pressure below the 20-day EMA could lower the price towards the 1.0000 psychological level.
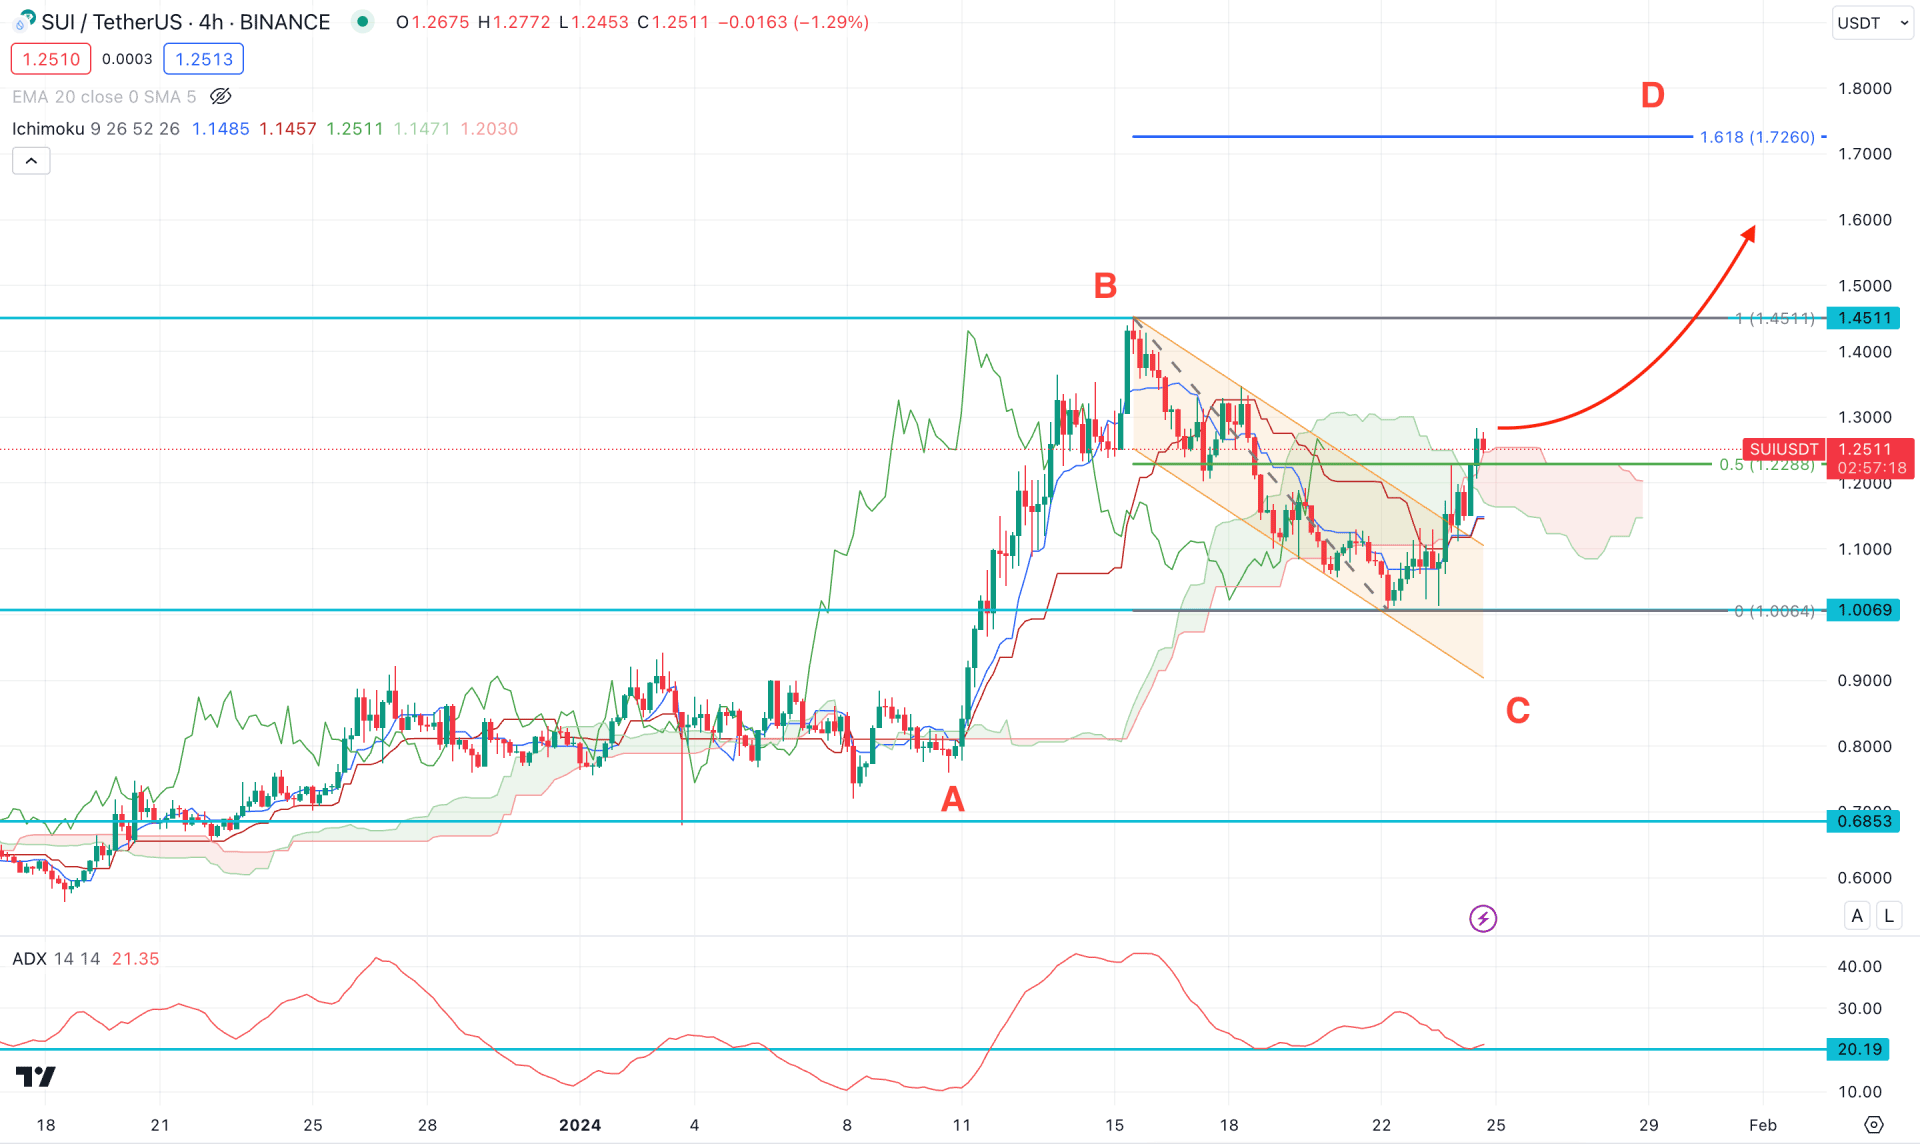
In the SUI/USDT H4 chart, the recent price trades within the Ichimoku Cloud zone have an unclear bias. However, the descending channel breakout supports the ongoing buying pressure, which came with an impulsive momentum. Moreover, the Senkou Span A is still below the Senkou Span B, where a bullish crossover is needed before forming a stable bullish trend.
In the indicator window, the Average Directional Index (ADX) tapped the 20.00 line and formed a rebound, which indicates a possible impulsive trend.
Based on the H4 forecast, the recent price is more likely to extend to the 1.7620 level to complete the ABCD pattern. However, an immediate selling pressure below the Kijun Sen support with a consolidation could signal a bearish opportunity, targeting the 0.6853 level.
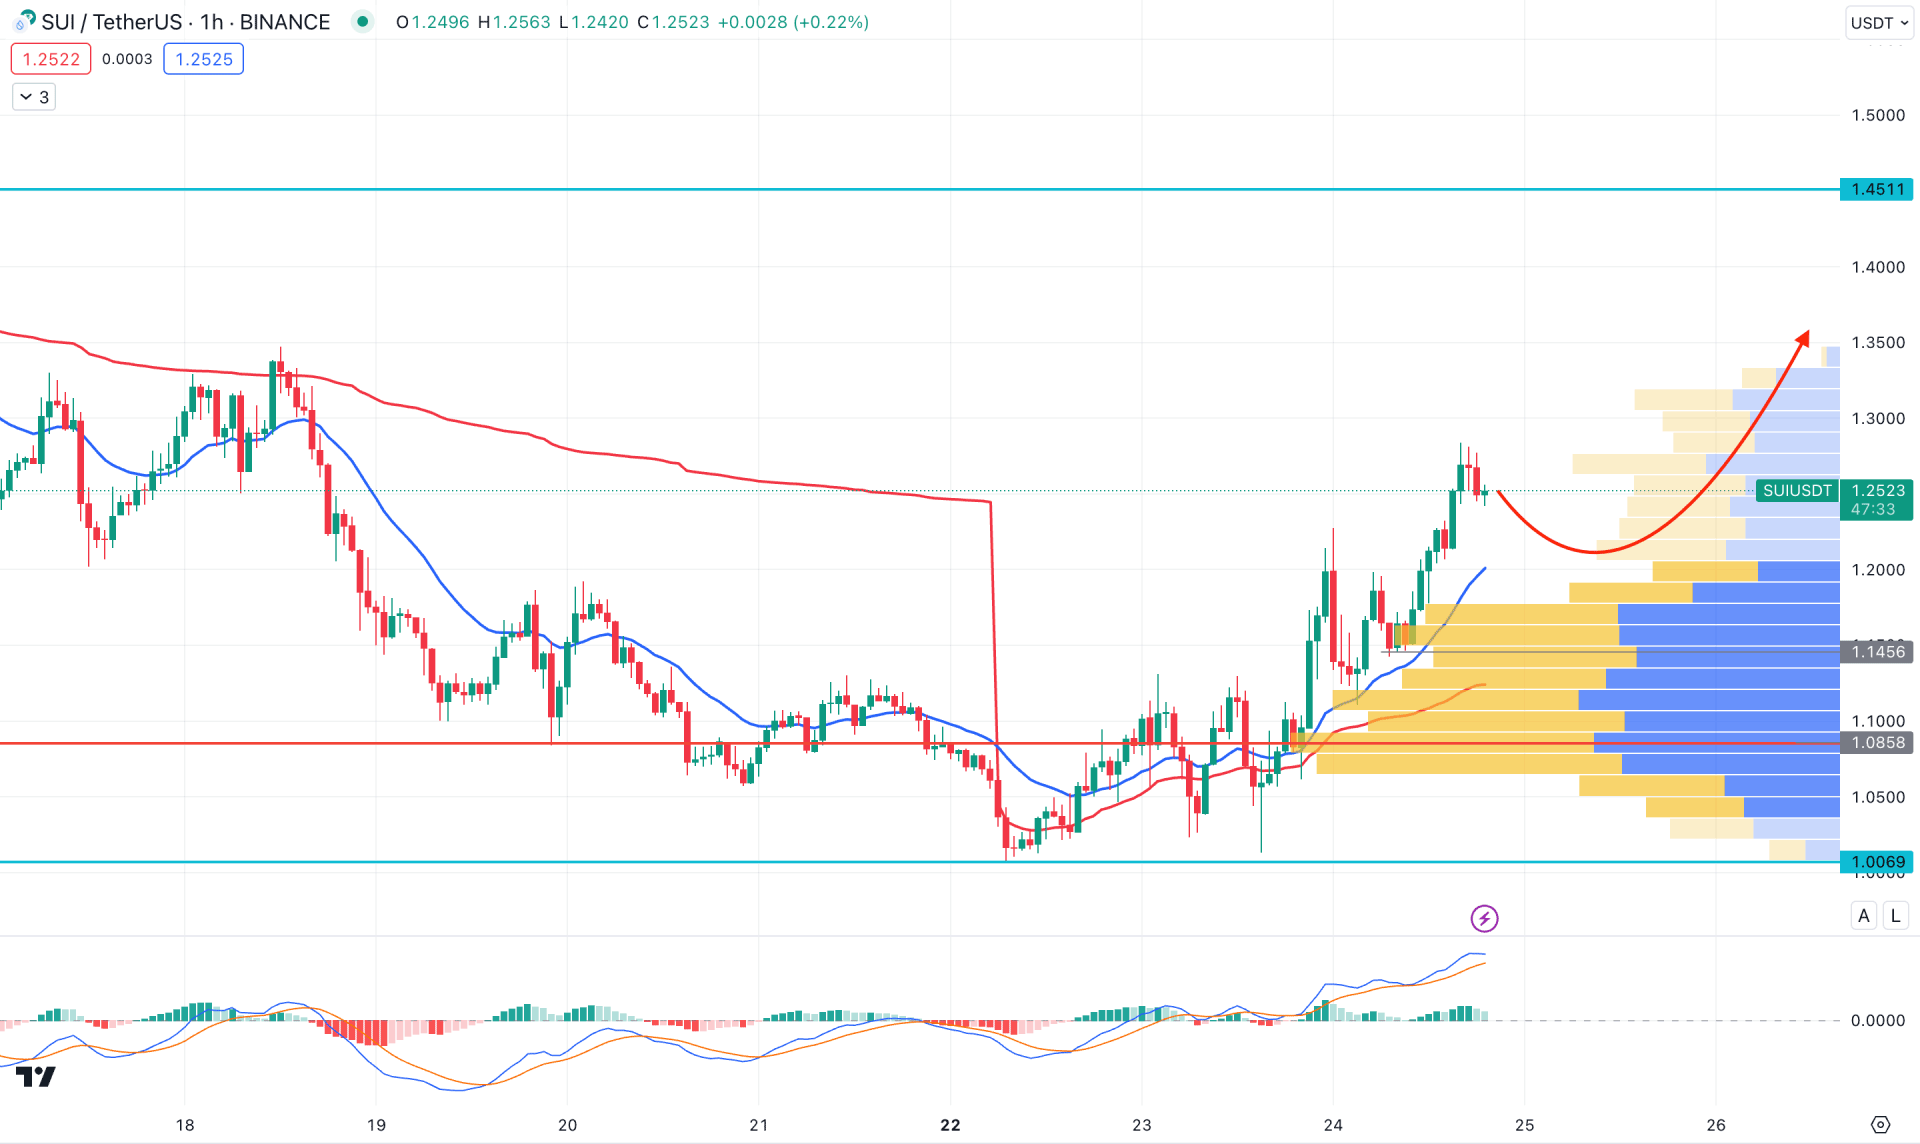
In the H1 chart, the visible range high volume level is below the current price and working as a strong support. Moreover, the dynamic 20 EMA and weekly VWAP are below the current price and working as a dynamic support.
Based on the H1 structure, a minor downside correction and bullish rejection from the 1.1550 to 1.1000 area could be an intraday-long opportunity, targeting the 1.1400 level. However, a break below the 1.0858 high volume level could take the price below the 1.0000 level before forming another long opportunity.
Based on the current market outlook, the SUI/USDT bullish trend is valid to join from an intraday dip. However, investors should closely monitor the higher timeframe’s price action to match the intraday signal.


