Published: December 11th, 2024
STEPN encourages people to lead healthier lives by rewarding them for their level of exercise. The initiative uses blockchain technology to link the virtual and real worlds through gamification and motivate people to be more physically active.
The STEPN ecosystem revolves around the STEPN app. When their daily steps are tracked, users are rewarded with the native GMT coin. An algorithm decides the number of tokens awarded, considering several variables, such as the quantity and difficulty of the steps completed and the user's participation in the STEPN network.
Users can purchase a variety of virtual and tangible things using the GMT tokens they have earned on the STEPN platform's marketplace. Additionally, the platform offers challenges and leaderboards to encourage a sense of community and boost the competitive spirit among members.
In a major development, the StepN declared a buy-back of 600 million GMT tokens, equivalent to a $100 million investment. The reduced supply could influence bulls into the market, aiming for a price surge.
Let's see the future price direction of this coin from the GMT/USDT technical analysis:

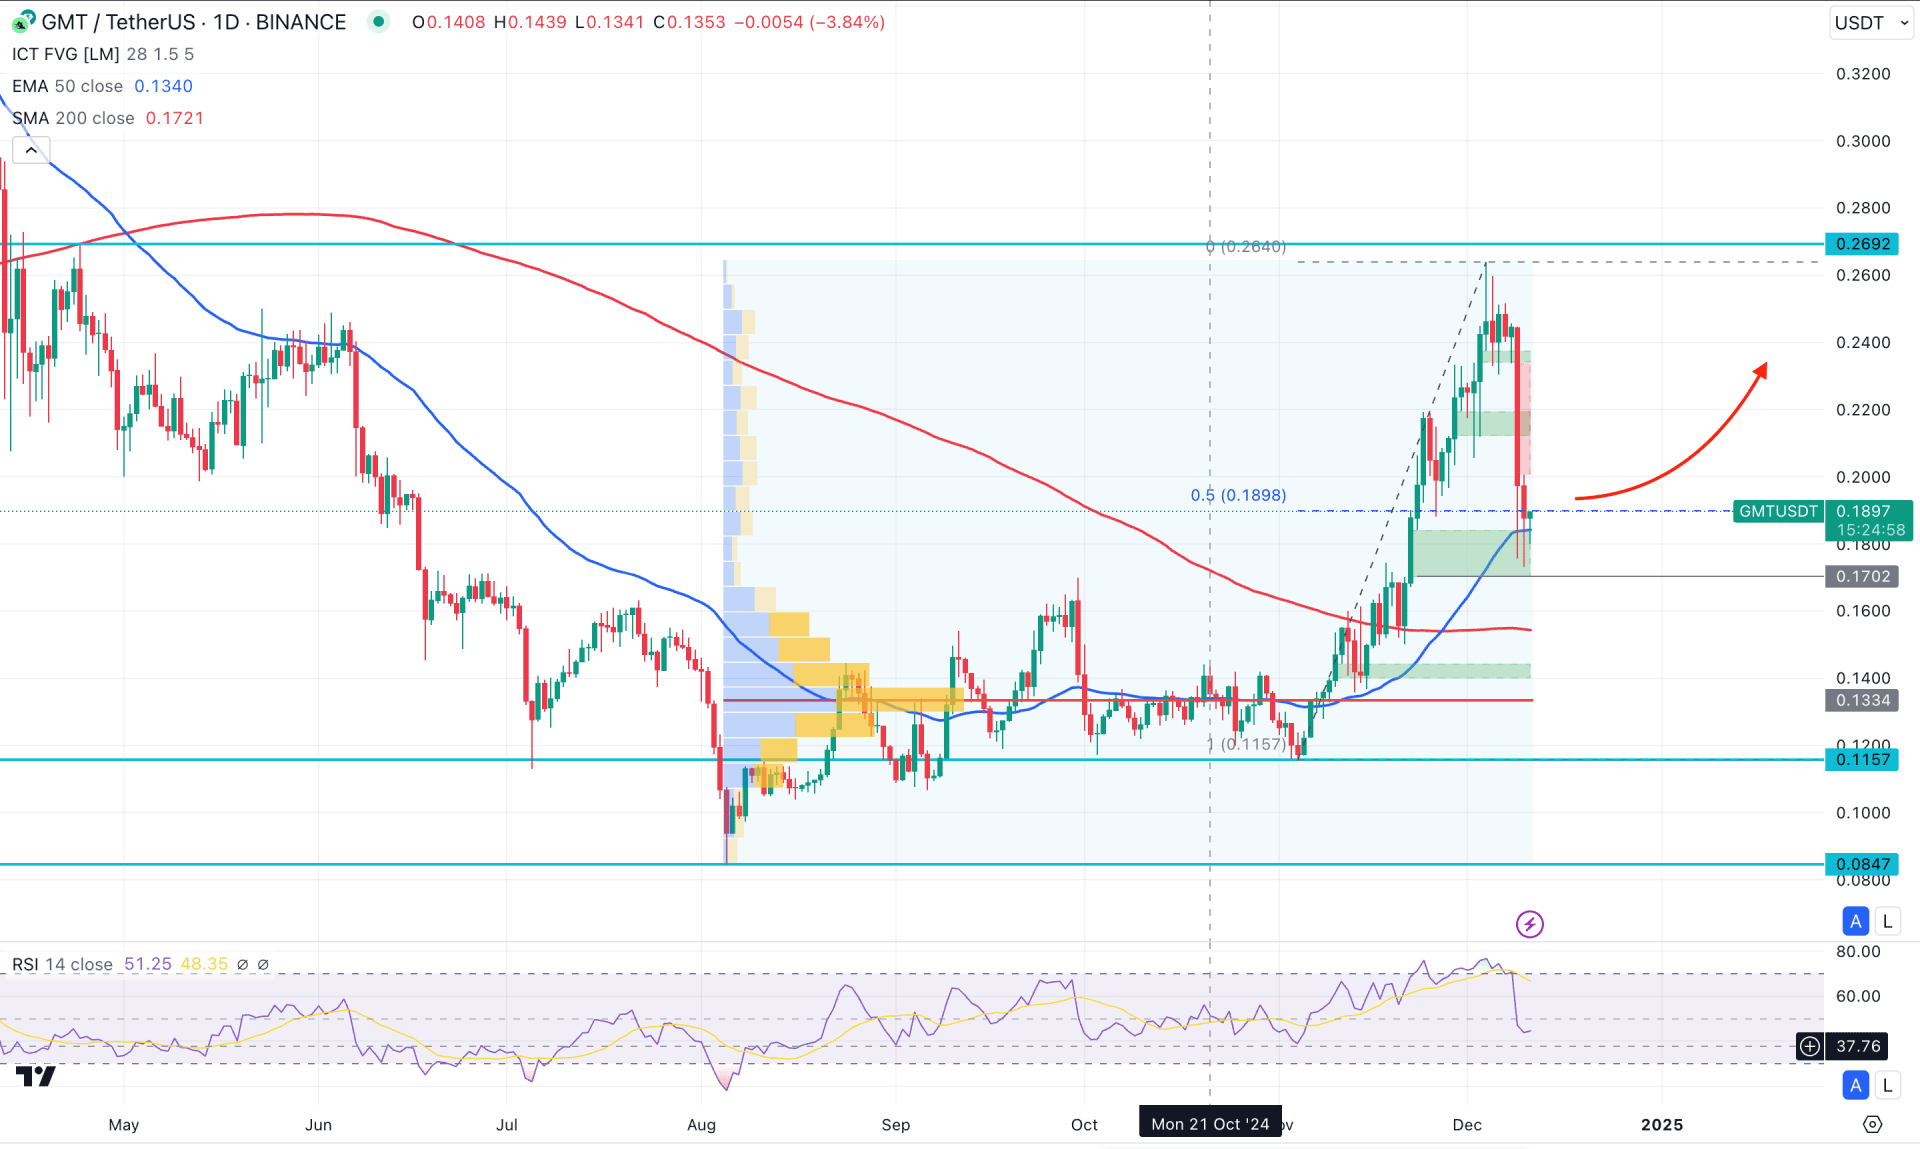
The daily chart of GMT/USDT shows ongoing bullish momentum, and multiple indicators suggest a potential bullish breakout. However, the price reached a significant high this week before forming a more than 20% crash. Now, investors should monitor how the price trades after the latest profit-taking before opening any long position.
In the higher timeframe, the price is still trading at the crucial discounted price as no significant bull run has been seen since the Pump & Dump in 2022. However, December 2024 came as a blessing as the price rose and reached a 6 month high. Moreover, a bullish range breakout is seen in November as the monthly candle came with a bullish Engulfing pattern.
In the volume structure, the ongoing buying pressure is potent as the largest volume level since August 2024 is below the current price. Moreover, the recent selling pressure from the 0.2640 high came with a significant loss but without any larger sell volume generation. It is a sign that the bullish volume from the bottom is still active and can resume the ongoing upward pressure once a minor bottom is formed.
In the main chart, the bullish crossover between the 200-day SMA and the 50-day EMA suggests a potential Golden Cross formation. The recent selling pressure from the top is still hovering at the 50-day EMA line, signalling an active bullish trend.
In the indicator window, the Relative Strength Index (RSI) aimed lower from the overbought position and moved below the 50.00 neutral point. It is a sign that the price has formed a top and can aim lower after confirming the trend.
Based on the daily market outlook of GMT/USDT, investors should closely monitor how the price trades at the dynamic 50-day EMA level. Any bullish rebound from the 0.2000 to 0.1400 zone with a daily candle above the 50-day EMA line could open a long opportunity. In that case, the upward pressure might extend and find a resistance from the 0.2800 psychological level before reaching the 0.3200 area.
On the bearish side, a consolidation below the 50-day EMA line could increase the bearish possibility, whereas a bearish range breakout could lower the price to the 0.1157 level.

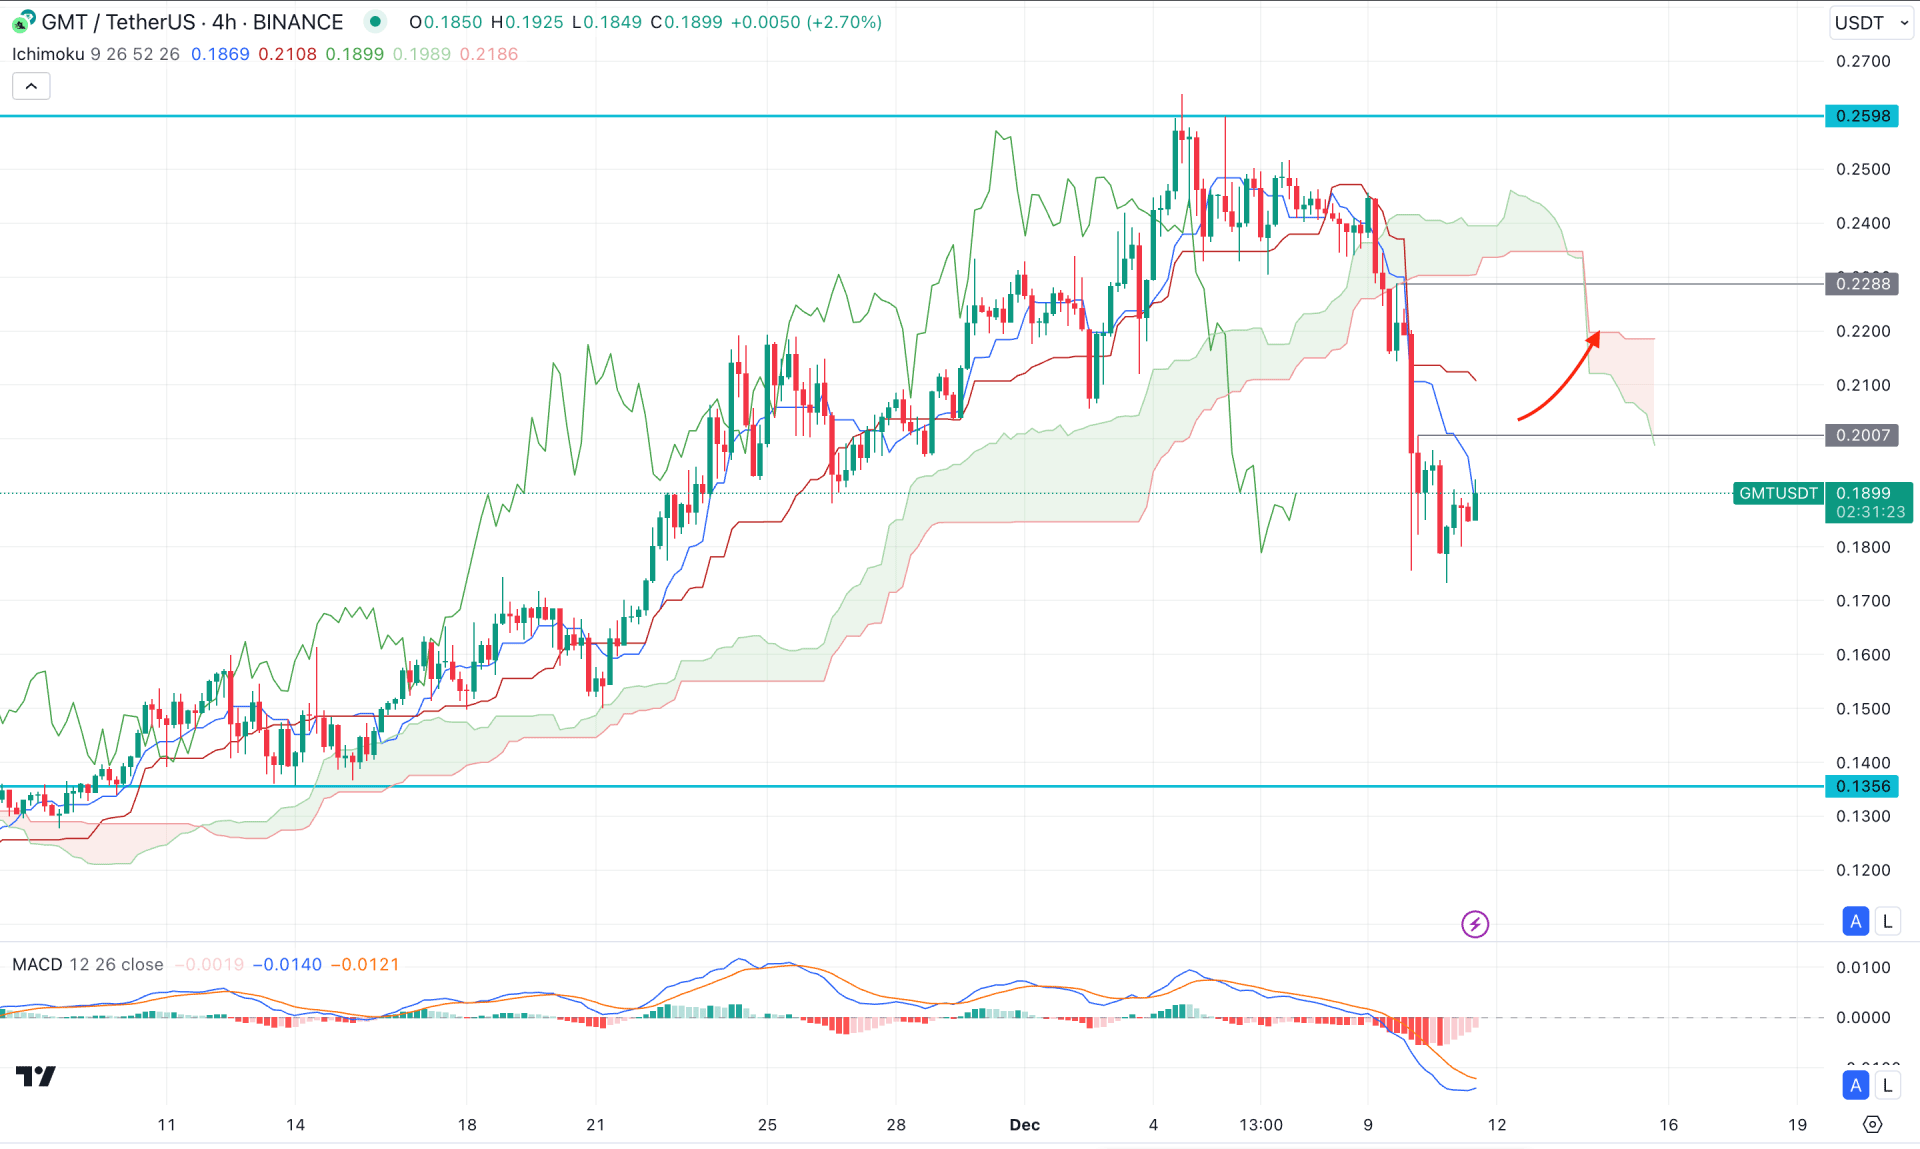
In the H4 timeframe, the recent price showed a corrective pressure above the cloud area before forming a bearish breakout with an impulsive pressure. Moreover, the Senkou Span A hovers below the B, suggesting a potential bearish continuation.
In the indicator window, the current MACD Histogram has eliminated the bearish momentum by reaching the neutral point, while the signal line is at the bottom. In that case, a valid rebound from the signal line with a bullish Histogram could increase the bearish possibility.
Based on the H4 outlook, an upward correction is pending after the bearish breakout, which can take the price higher at the 0.2200 level before resuming the current trend.
However, an extended bullish reversal with an H4 close above the 0.2288 resistance level could signal a potential bullish reversal, aiming for the 0.2598 level.

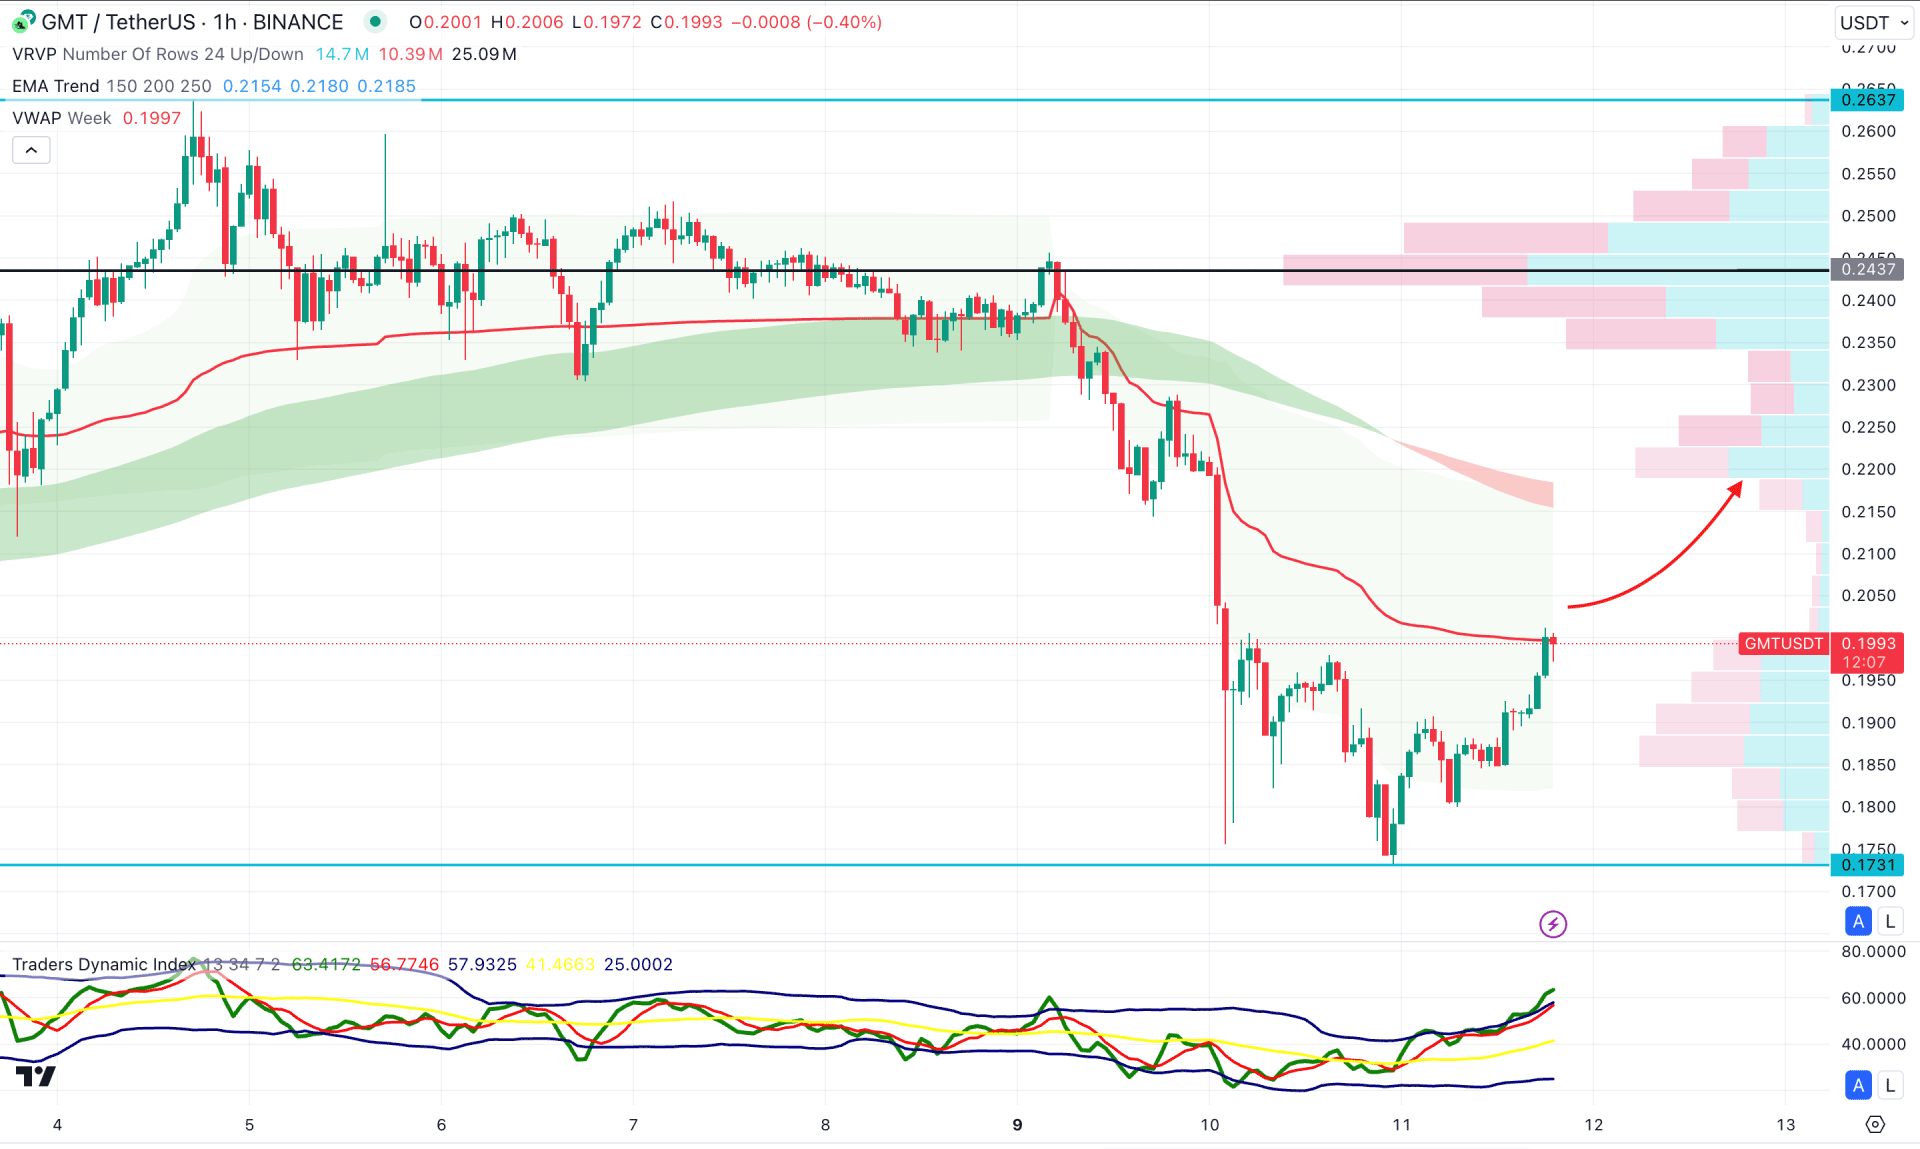
In the hourly timeframe, the GMT/USDT price is trading within a bearish pressure, where the Moving Average wave flipped the position from positive to negative. Moreover, the weekly VWAP is above the current price, working as a near-term resistance.
In the indicator window, the Traders Dynamic Index (TDI) has reached the overbought level, suggesting extreme selling pressure in the market. Also, the visible range volume indicator is above the current dynamic lines, we may consider a pending upward pressure as a mean reversion.
Based on this outlook, investors might expect a bullish reversal after having a valid hourly close above the weekly VWAP line. In that case, the price might extend the upward pressure and find resistance from the 0.2300 level.
Based on the current multi-timeframe analysis, GMT/USDT has a higher possibility of extending the upward pressure after confirming the upcoming fundamental outcome. As of now, the price is trading at the oversold zone in the intraday chart, from where a valid bottom formation is needed before opening an early long position.