Published: November 1st, 2023
Shares of Roku may be trading 38% higher in 2023, but investors who remember how high the stock once traded are unlikely to outperform the market. Until its recent decline, Roku shares had more than doubled this year. The share price also approached $500 at its zenith in 2021.
Roku has invested in content and expanded its product line, but those investments are not impacting near-term performance. Professionals on Wall Street anticipate a restoration to profitability in 2027. There's also the matter of the Screen Actors Guild-American Federation of Television and Radio Artists strike that continues even after writers came to terms with Hollywood studios.
On the other hand, Roku continues to hold the largest market share in North America. It has also increased the proportion of new televisions sold with its operating system as the default smart TV configuration. The audience continues to swarm the platform. Its 73.5 million active accounts at the end of June represent a 16% increase over the previous year.
The level of participation has increased by 21% over the past year, representing an improvement of even greater magnitude. Fears that people would stream less television at home during pandemic lockdowns have proved to be unfounded.
Revenue is also starting to accelerate. The midpoint of Roku's summer guidance for the third quarter was top-line growth of 12%. If the year-over-year gain can reach 11%, it would be the third consecutive quarter of accelerating revenue gains.
Let’s see the upcoming price direction from the Roku Stock (ROKU) technical analysis:

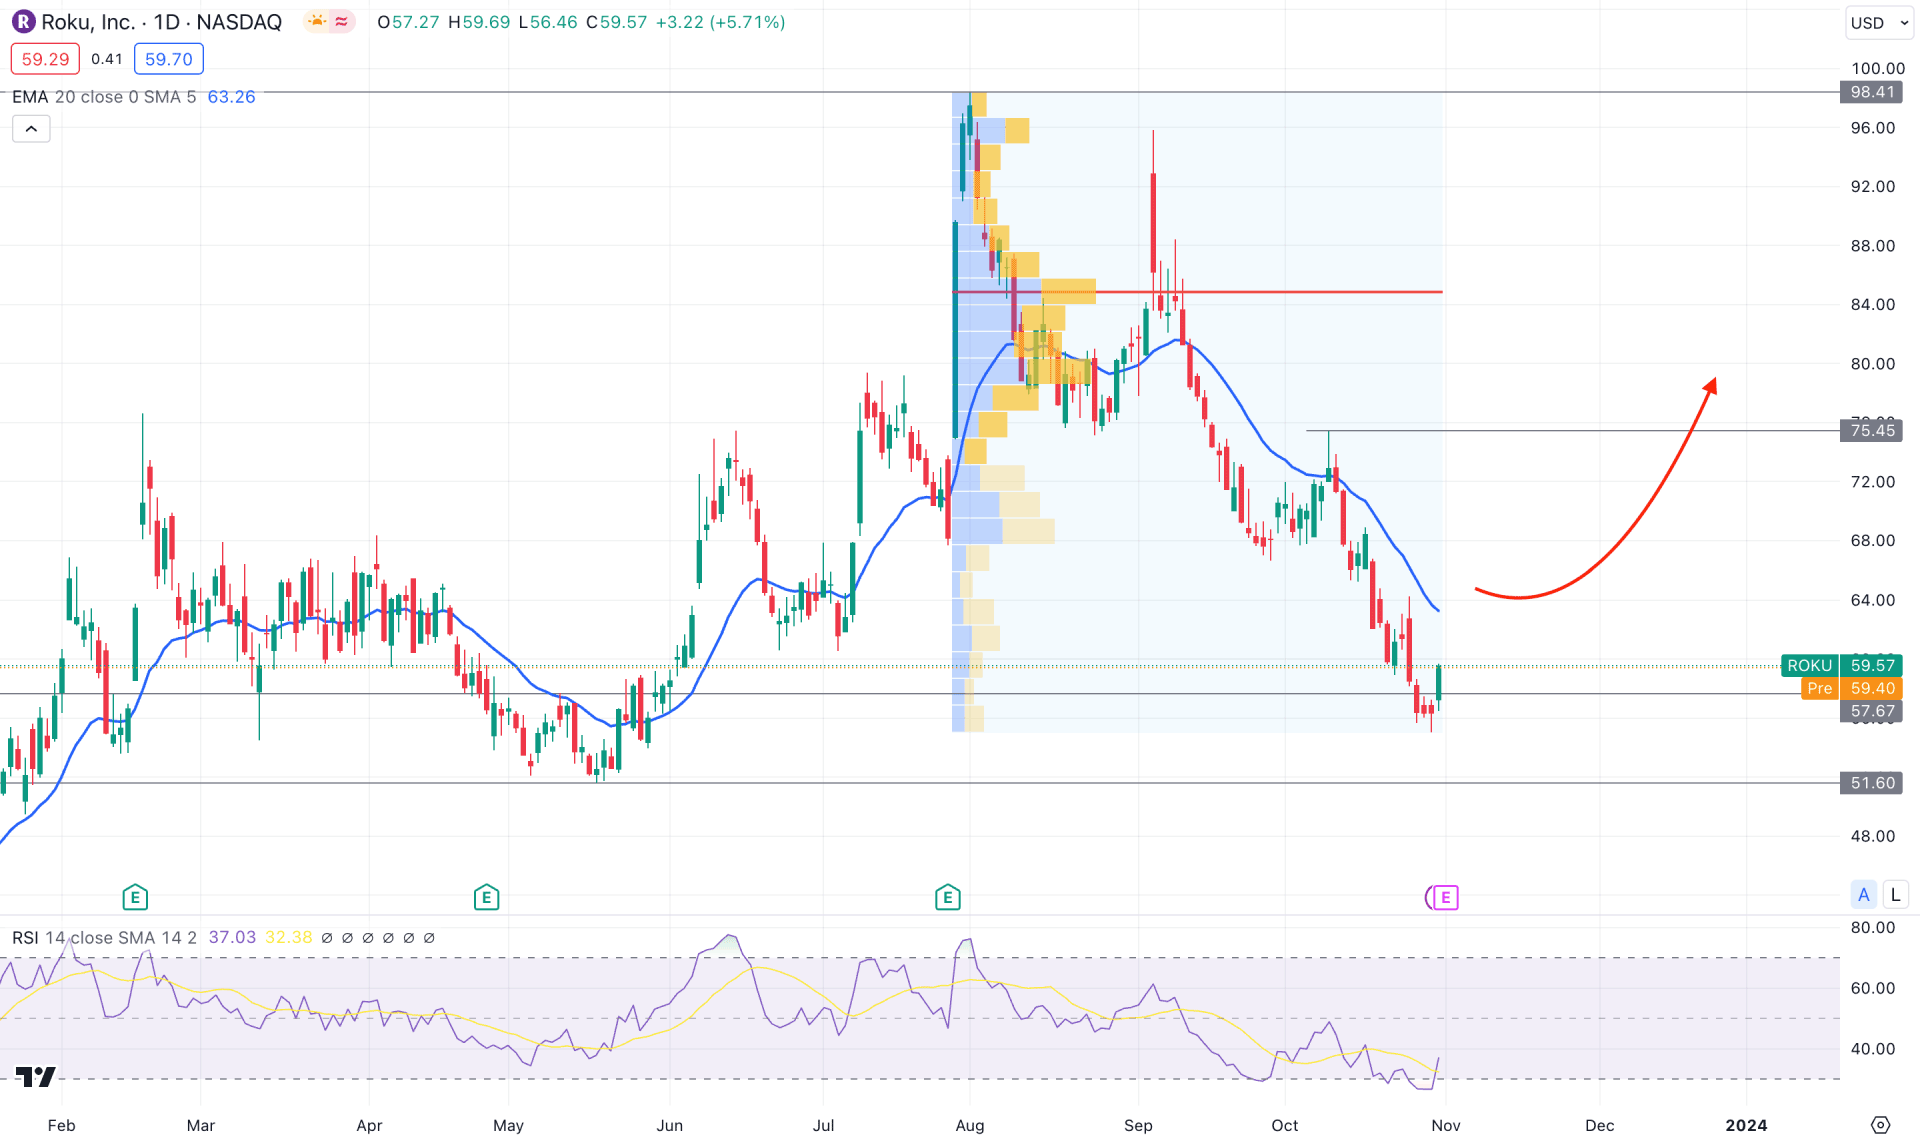
In the ROKU daily chart, impressive bullish pressure was seen, where the price reached the 100.00 psychological level with a 100% gain. However, a bearish correction appears from the top, pushing the price toward the near-term demand zone. Therefore, as long as the price holds the buying pressure at the demand zone, we may expect the buying pressure to resume.
In the higher timeframe, 2021 was a remarkable year for this stock as the price reached an all-time high with impulsive pressure. However, the price reached the bottom in the weekly chart, where the latest price action shows a bullish two-bar reversal formation.
In the daily chart, the price reached the near-term demand zone from where a bullish daily can appear by eliminating three days’ selling pressures. However, the dynamic 20 EMA is still above the current price. In that case, a bearish continuation might appear, where the 51.60 support level would be a strong level to look at.
In the volume structure, the most active level since the July peak is at the 84.87 level, which is 42% above the current price. Therefore, a bullish correction toward the high volume is pending, which is a sign of possible bullish pressure in the market.
In the 14-day, RSI reached the 30.00 level and showed a bullish rebound. However, a stable buying pressure in the main chart might come after overcoming the 50.00 neutral level.
Based on the daily market structure, ROKU could offer a long opportunity after forming a stable daily candle above the dynamic 20-day EMA. In that case, the next resistance level could be tested at the 75.45 level before reaching the 100.00 psychological level.
On the bearish side, the downside pressure is still active, and a bearish daily close below the 51.60 support level could be an alarming sign to bulls. In that case, the bearish momentum might extend toward the 38.12 level.

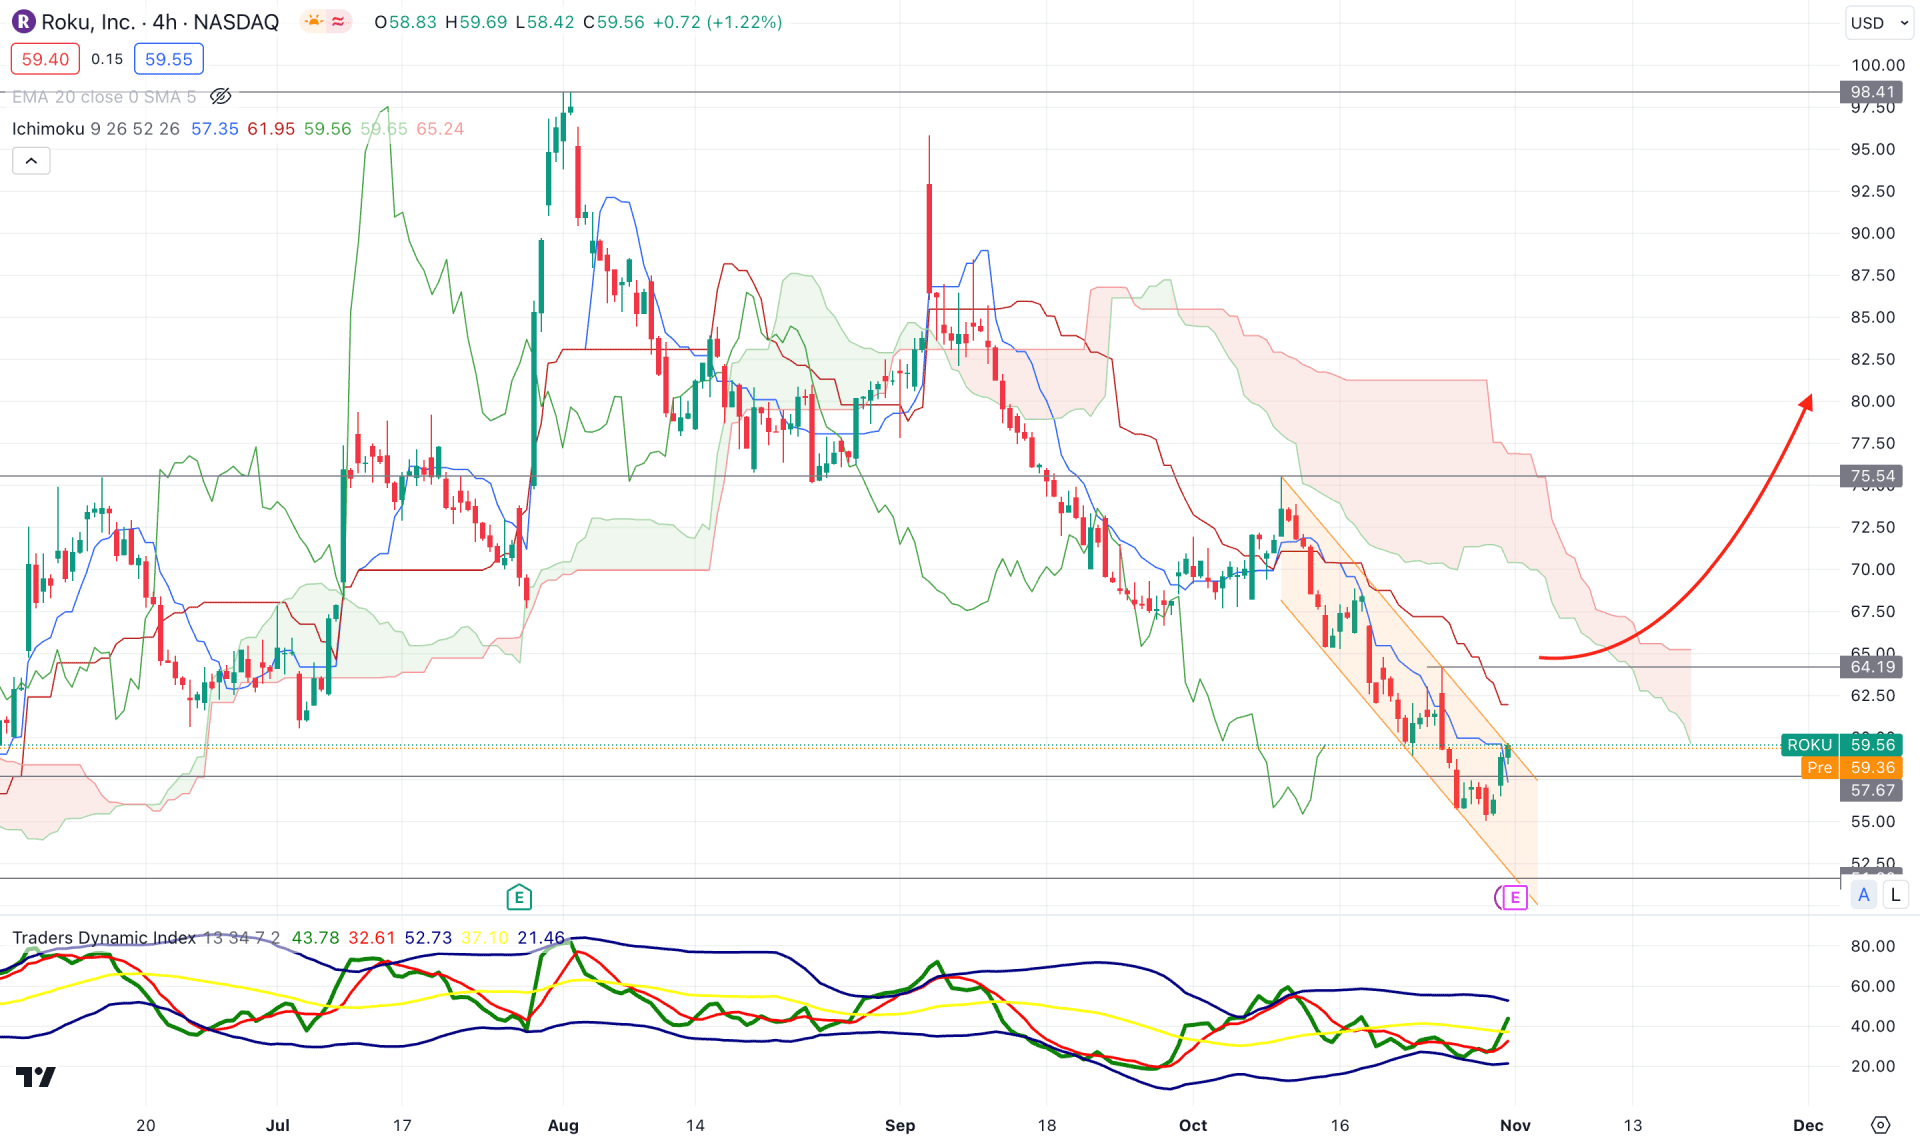
In the H4 chart, the current price is trading at the ABCD correction, where the latest bearish pressure shows a trend continuation within a descending channel. Moreover, the bearish momentum is supported by a downward slope in the future cloud.
In the indicator window, the recent TDI level indicates a bullish possibility as the recent level moved beyond the 50.00 neutral line.
In this context, a bullish continuation needs a solid breakout from the descending channel and a violation of the 64.19 level. In that case, the upward pressure could extend towards the 75.44 resistance level.
On the bearish side, a valid bearish rejection from the dynamic Kijun Sen or 64.00 to 70.00 zone would be a short opportunity, targeting the 56.00 support level.

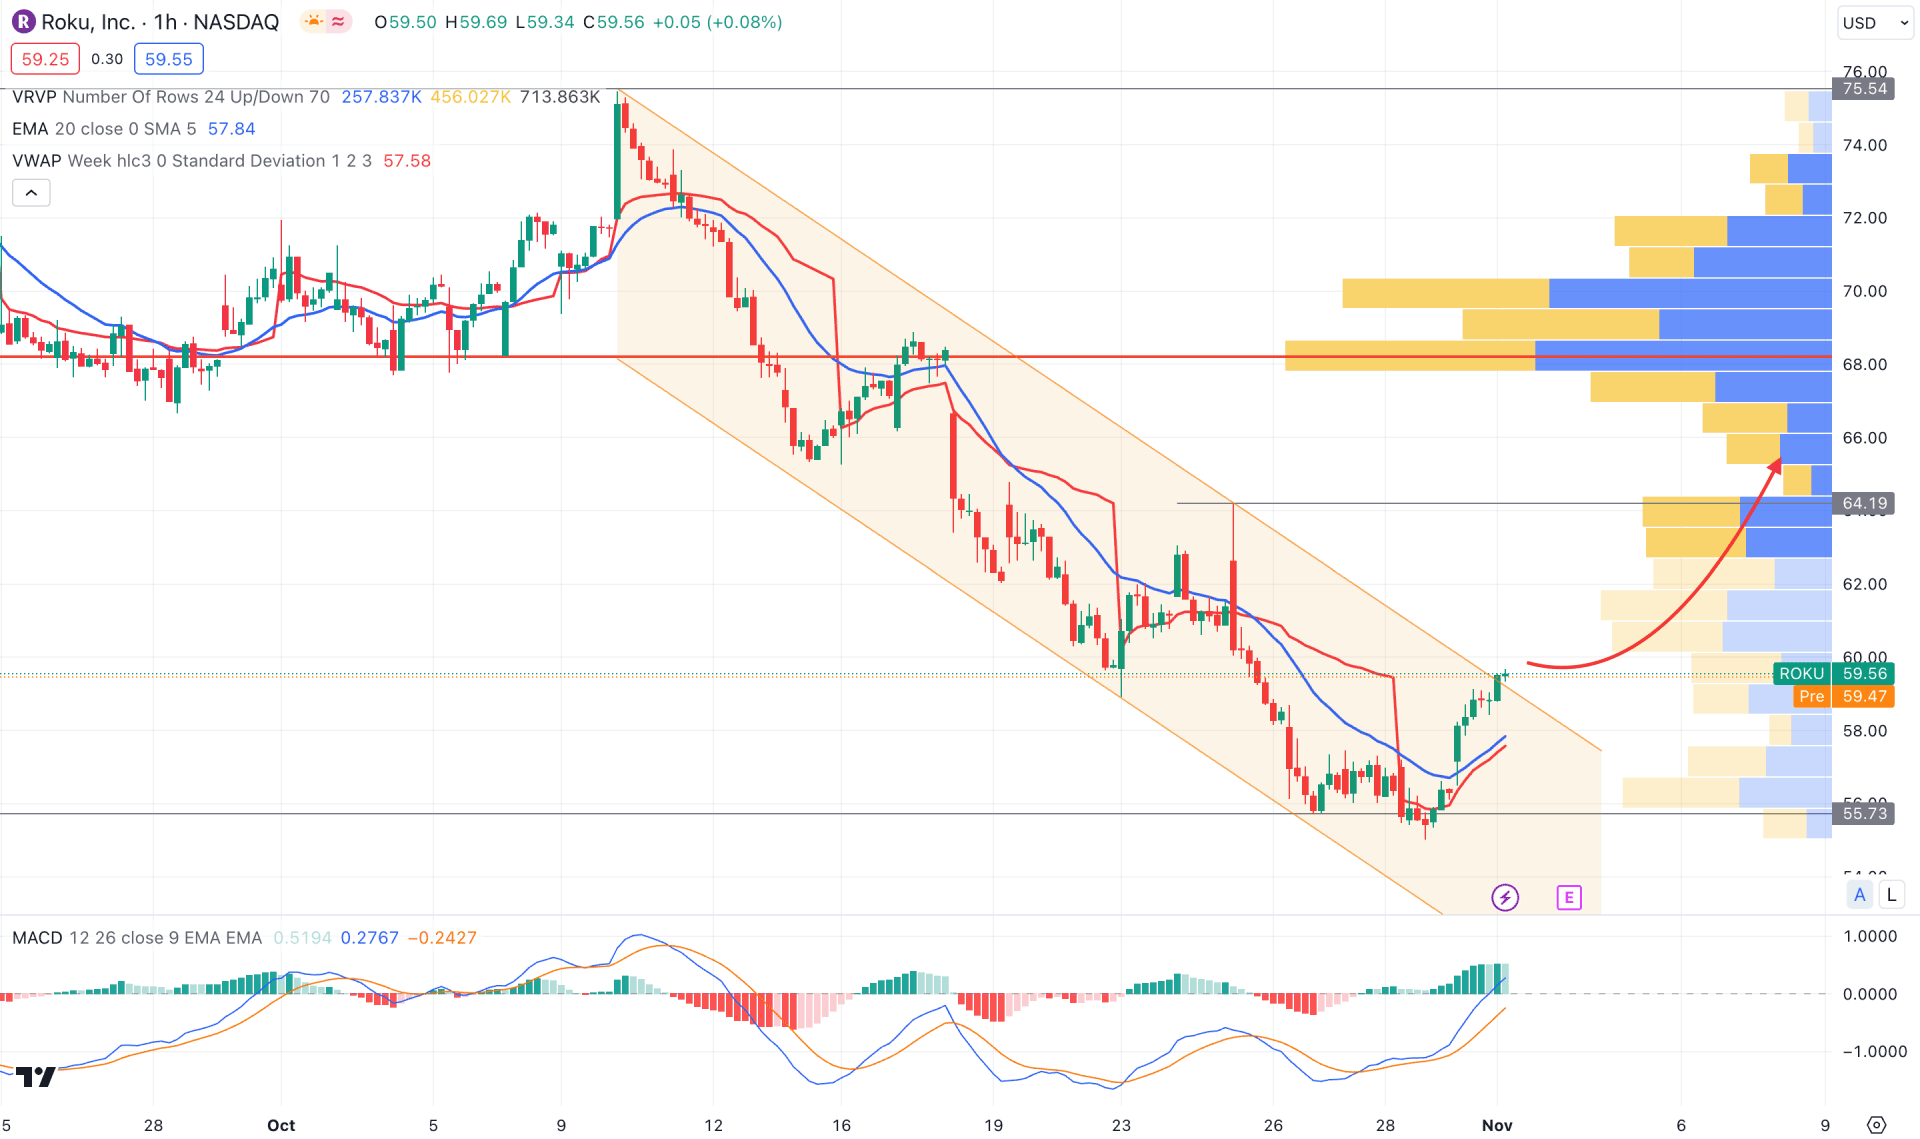
In the H1 chart, ROKU is trading within bearish exhaustion as the recent price formed multiple daily candles above the dynamic 20 EMA. However, the price reached the channel support and stalled instead of forming a strong rebound.
In the visible range high volume level, the most active level in this chart is at the 68.20 level, which is above the current price. Moreover, the MACD Histogram is bullish with a bullish divergence with MACD lines.
Based on this outlook, a bullish correction is pending as long as the price trades above the 55.73 level. However, an immediate bearish pressure below the 20 EMA could eliminate the bullish possibility at any time.
Based on the current market structure, ROKU is still trading with a bearish trend with no clear sign of a bullish possibility. In that case, investors should closely monitor how the price trades at the demand zone as a valid bullish pressure above the dynamic 20 EMA with a higher volume could indicate a trend reversal.