Published: November 5th, 2024
Raydium (RAY) is experiencing a surge. The token has risen 215% this year, despite the typical volatility seen in all cryptocurrency assets, including popular meme currencies like Dogecoin and Pepe.
The likelihood of RAY edging greater for the majority of Q4 2024 is going to increase as sentiment toward cryptocurrencies improves. As of right now, traders anticipate that altcoins will gain the most from the "uptober." Other high-quality DeFi tokens, like RAY, will experience significant tailwinds if Ethereum, Bitcoin, and Solana prices continue to rise and break important resistances in the upcoming sessions.
Bitcoin is currently moving downward and has had difficulty breaking $70,000, regardless of the optimism that comes with the fourth quarter of every trading year. RAY could increase its gains if there is a surge, possibly brought on by the results of the next US general election.
Let's see the upcoming price direction of this crypto pair from the RAY/USDT technical analysis:

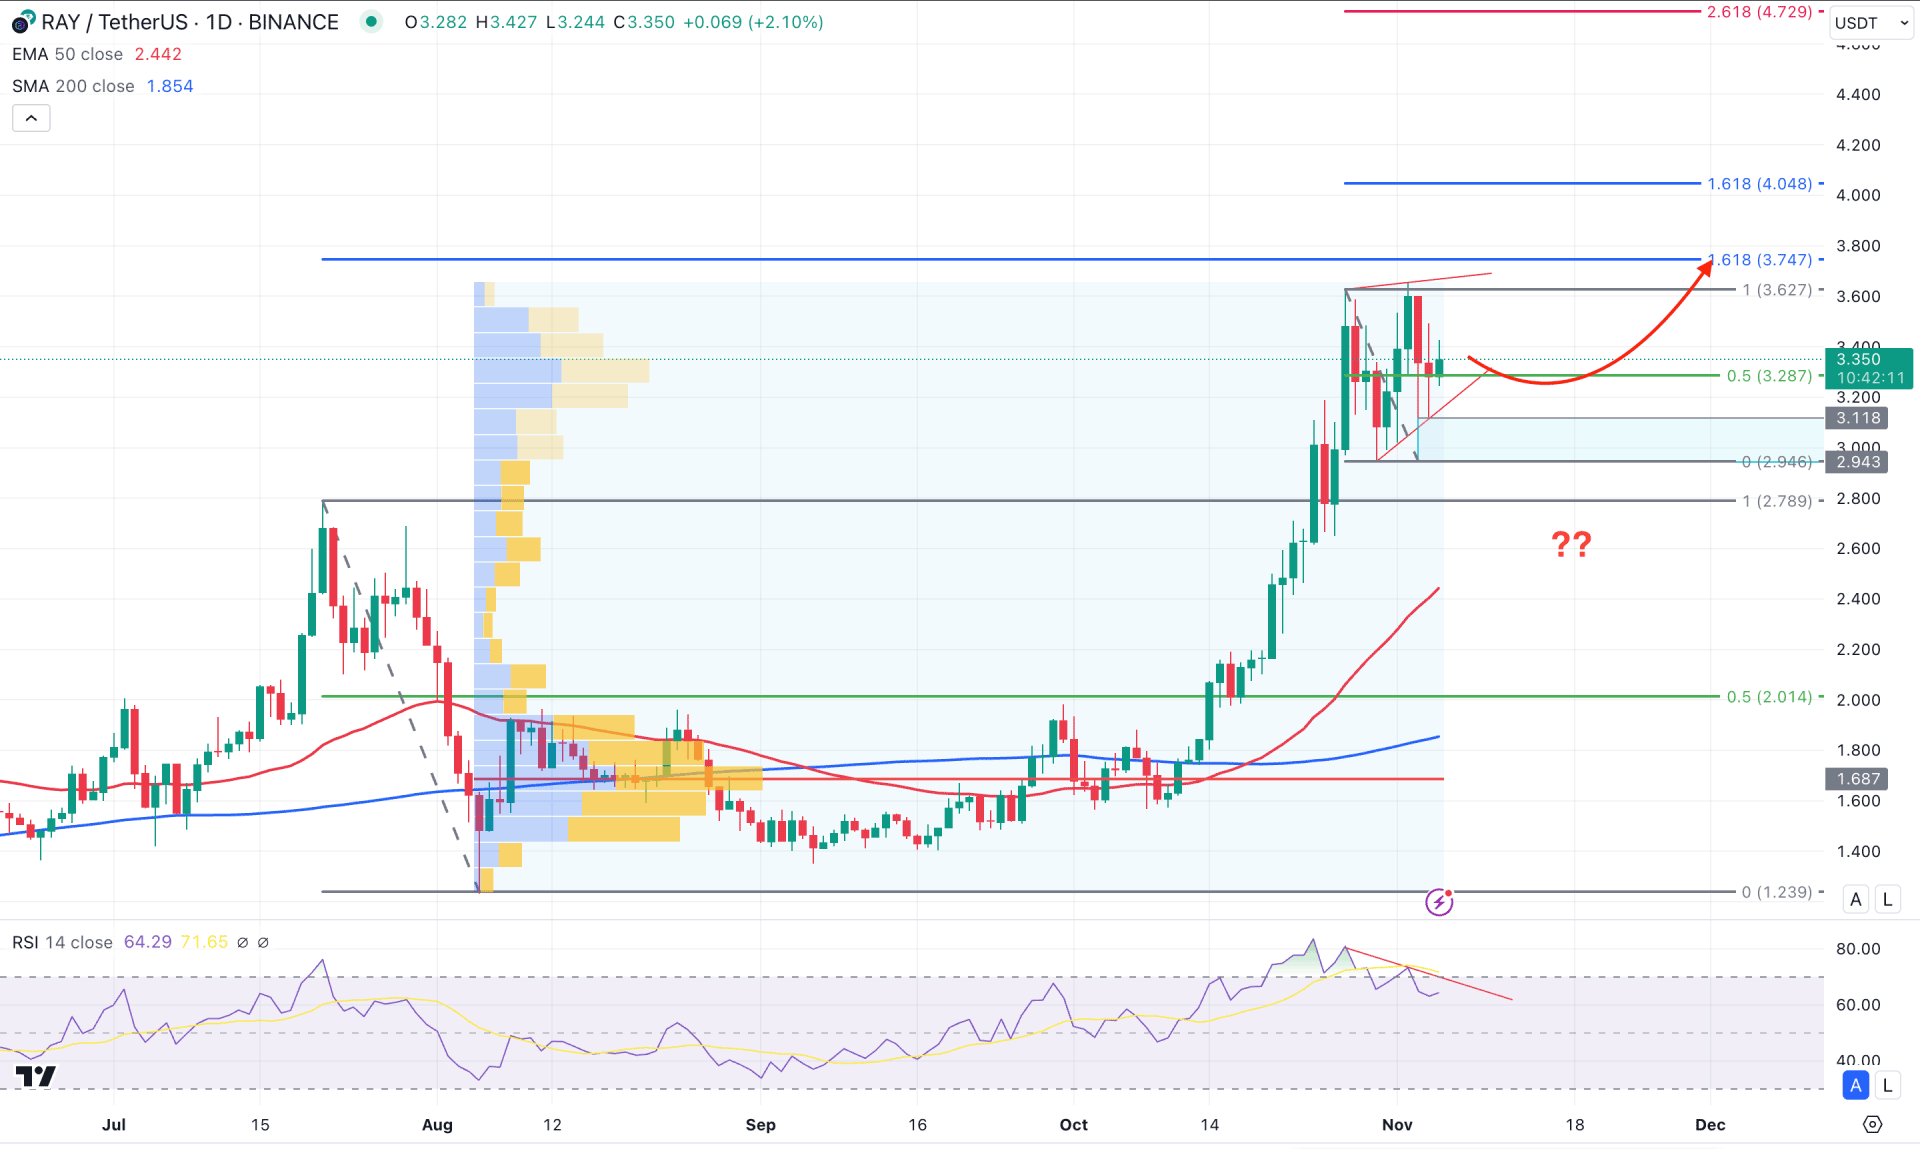
In the daily chart of RAY/USDT, the recent price showed remarkable buying pressure, creating a potential range breakout in October 2024. In that case, investors should monitor how the price trades at the top from where a bullish continuation is possible.
In the higher timeframe, October 2024 came as a blessing to bulls as the existing candle closed bullish with a continuation of momentum. As the October close exceeded the three-month high, we may expect the price to grow, validating the bullish breakout. However, the latest weekly candle trades are bearish after an impulse, from which more clues are needed before anticipating a continuous momentum. Considering the pump and dump scheme, a decent downside recovery is possible, as seen in the patterns in December 2023, March 2024, and July 2024.
The high volume level since August 2024 is below the 2.014 static level in the volume structure, suggesting an ongoing bullish momentum. However, the gap between the current price and high volume level is extended, which might signal a bearish possibility as a mean reversion.
In the primary chart, the 200-day SMA and 50-day EMA are below the current price, with a strong gap, suggesting a pending downside correction.
Moreover, the most recent price is trading within a rising wedge pattern, while recent price action are volatile, while multiple violations of near-term levels are visible.
In the indicator window, the Relative Strength Index (RSI) failed to follow the upward swing and created a potential divergence. Depending on the upcoming price action, selling pressure in the primary chart is possible.
Based on the daily outlook of RAY/USDT, the ongoing pressure might find momentum after grabbing the trendline liquidity. In that case, a minor downside pressure with a valid bullish reversal from the 3.118 to 2.943 area could be a long opportunity, aiming for the 3.747 level.
On the other hand, the bullish possibility is valid as long as the current price remains above the August 2024 high. In that case, a bearish daily close below the 2.789 level could be a bearish possibility, aiming for the 200-day SMA as a target.

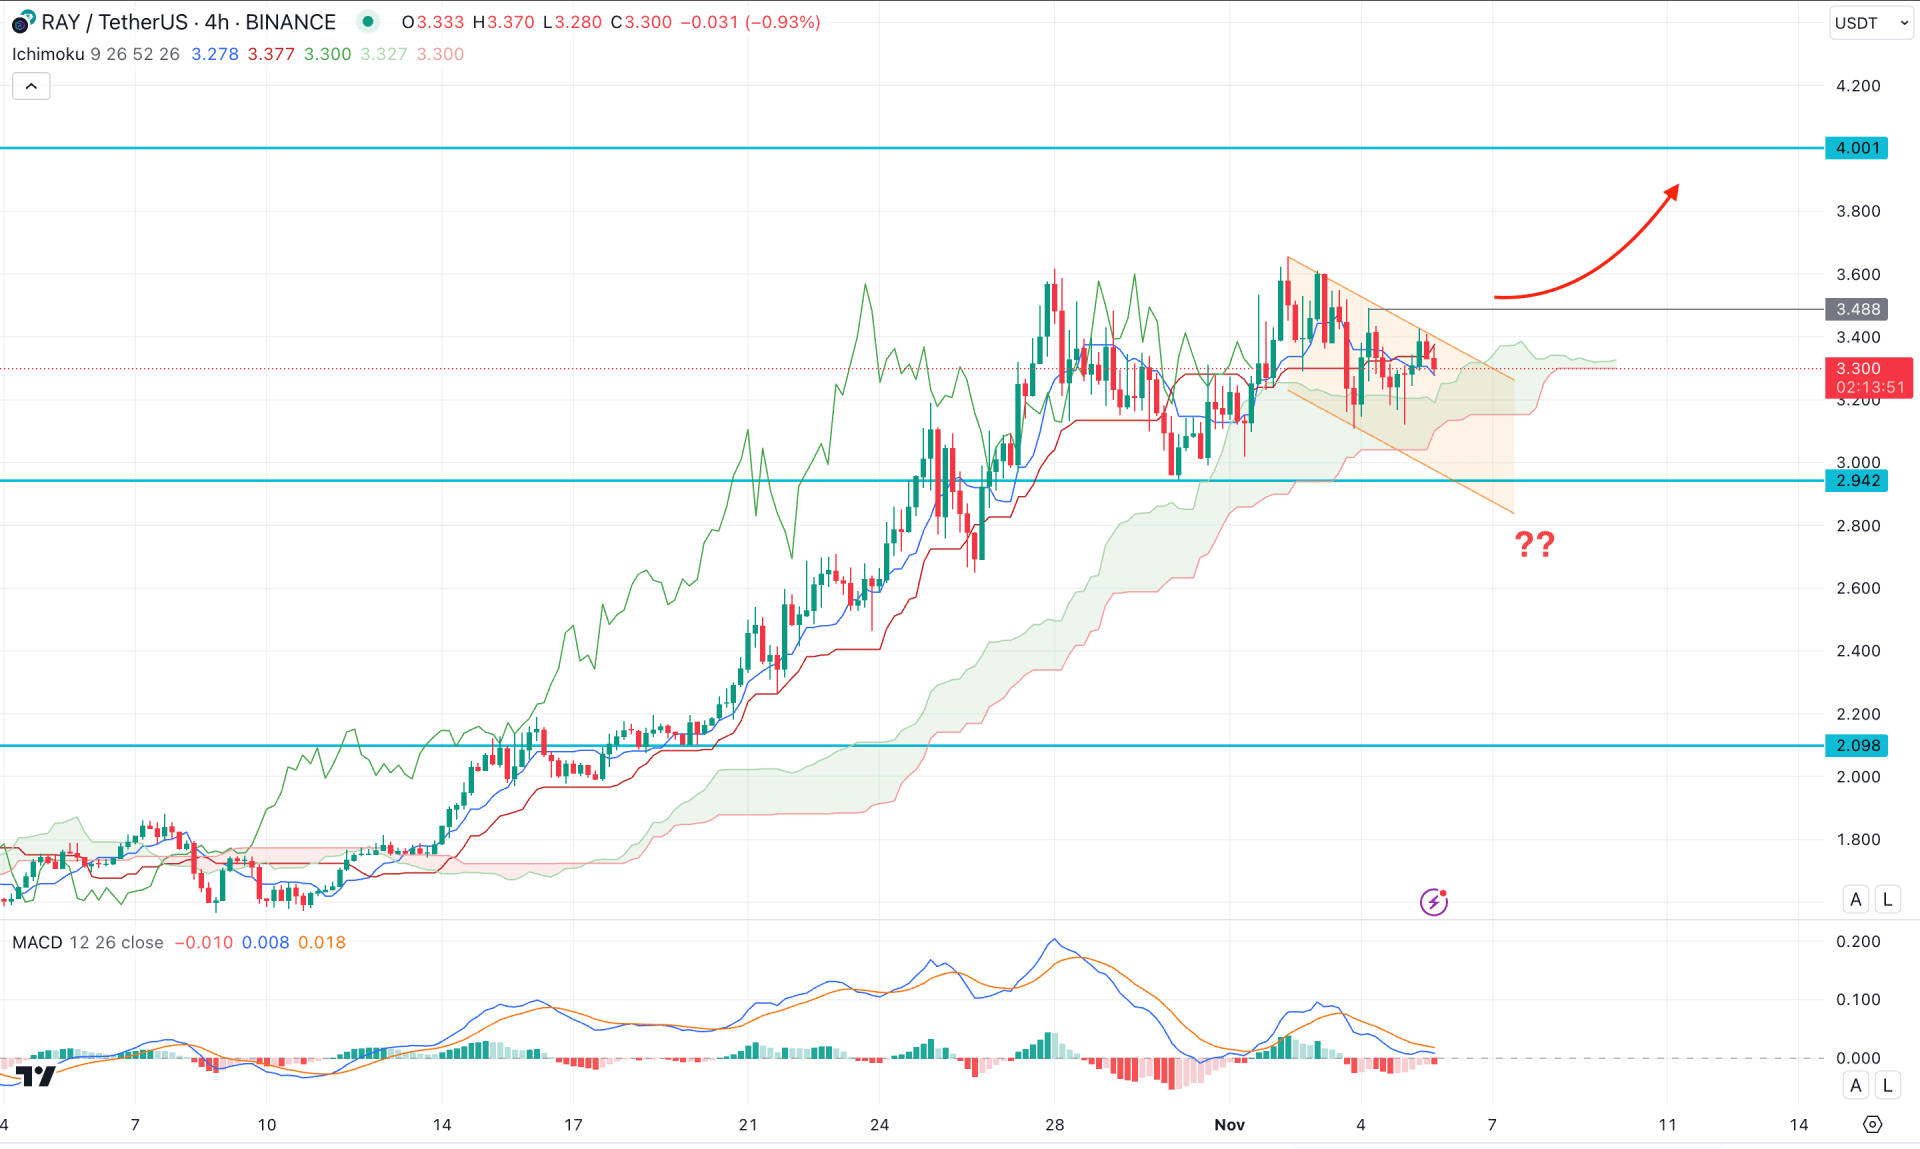
In the H4 timeframe, the ongoing buying pressure is potent above the Ichimoku Kumo Cloud, which signals buyers' presence in the market. Moreover, the thickness of the Futures cloud is not solid, but the Senkou Span A still remains above the Senkou Span B.
On the other hand, the corrective price action is visible where the current price is hovering below the dynamic Kijun Sen line.
In the indicator window, the MACD Histogram remains bearish while the signal line is above the neutral point.
Based on the current market outlook, a valid bullish trendline breakout with an H4 close above the 3.488 line could open a potential long opportunity, aiming for the 4.000 psychological line. However, the channel extension could provide another long opportunity from the 3.124 low. A bearish break below the 2.942 level with a daily close could lower the price toward the 2.098 support level.

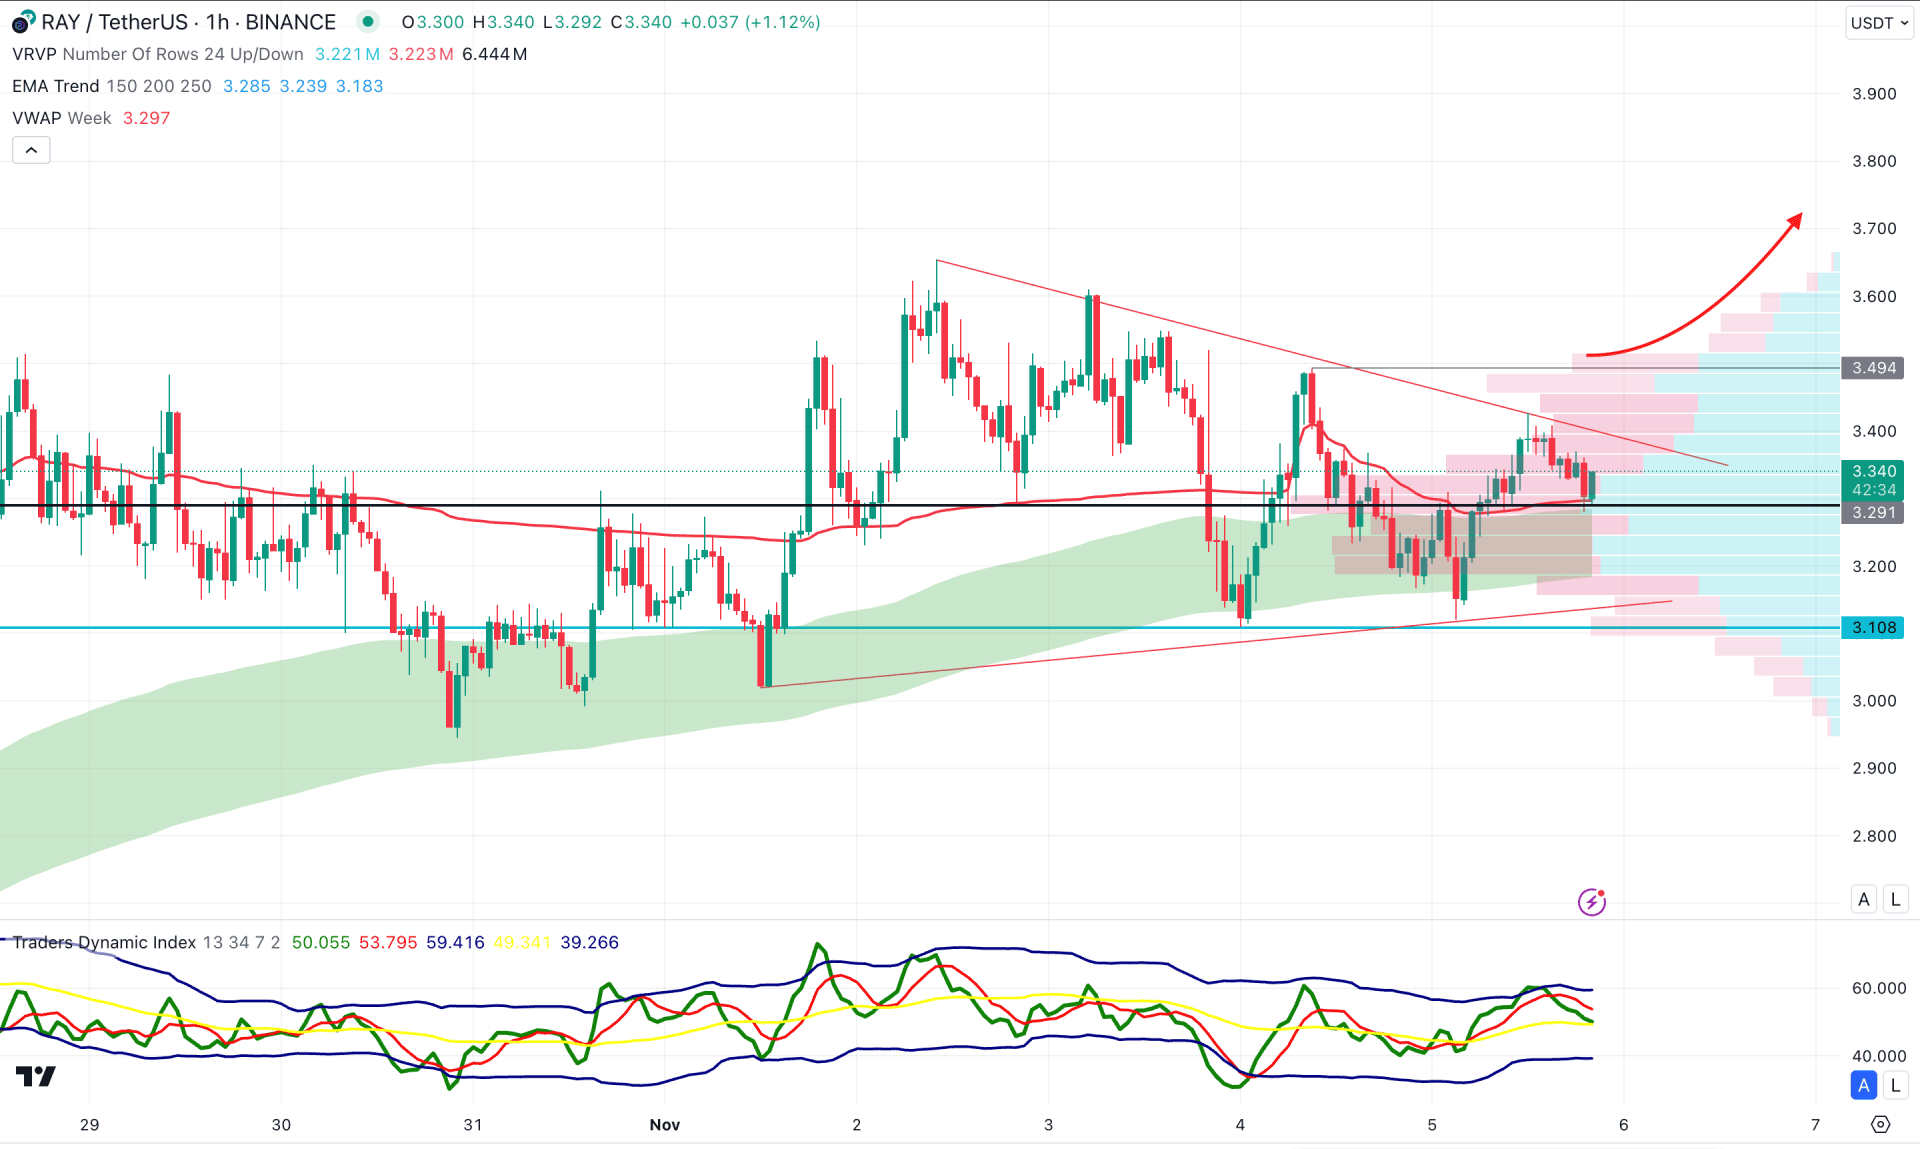
In the H1 timeframe, the RAY/USDT is trading within a corrective momentum within a symmetrical triangle formation. Moreover, the high volume support is visible below the current price, while the Moving Average wave is working as a major support.
On the other hand, the Traders Dynamic Index (TDI) remains sideways at the 50.00 area, suggesting a corrective momentum.
Based on the hourly structure, a bullish continuation with an hourly close above the 3.494 high could validate the bullish breakout. In that case, the upward pressure might extend the momentum toward the 3.800 level.
On the bearish side, a selling pressure with an hourly close below the 3.108 level could lower the price towards the 2.800 level.
Based on the current market outlook, RAY/USDT is more likely to extend the buying pressure after validating the lower timeframe price action. However, the daily price is already overextended at the top from where massive selling pressure is possible as a Pump and Dump scheme.