Published: October 30th, 2024
With a new addition called Redemption Rate Feeds, the leading Oracle network- Pyth Network has increased its presence in the decentralized financial market. By providing this feature, Pyth Network links the larger DeFi market to pricing information unavailable through conventional price feeds.
The crypto restitution rate provides data pulled straight from the smart contracts of the fundamental assets to provide real-time token values. The Pyth Network group claims that interest and accrued incentives are examples of these true values.
In a post on X, Pyth included that this makes RRF "fundamentally distinct from market price info."
These valuations concern derivatives like yield-bearing stable coins and liquid-staking coins. DeFi builders throughout the ecosystem can access the unrestricted feeds.
Redeemable rate feeds from Pyth Network will initially protect 19 real-time principles on networks compatible with Ethereum Virtual Machines (EVMs). These consist of the Crypto. com-established ETH (CDCETH), the wUSDM from Mountain Protocol, the USDY from Ondo Finance, and the USDe, a synthetic dollar from Ethena.
Additionally, the feeds will include ETH stake pairs, including Rocket Pool's liquid stake token (rETH) and Coinbase-wrapped staked ETH (cbETH).
Should you include PYTH in your crypto portfolio? Let's see the upcoming price from the PYTH/USDT technical analysis:

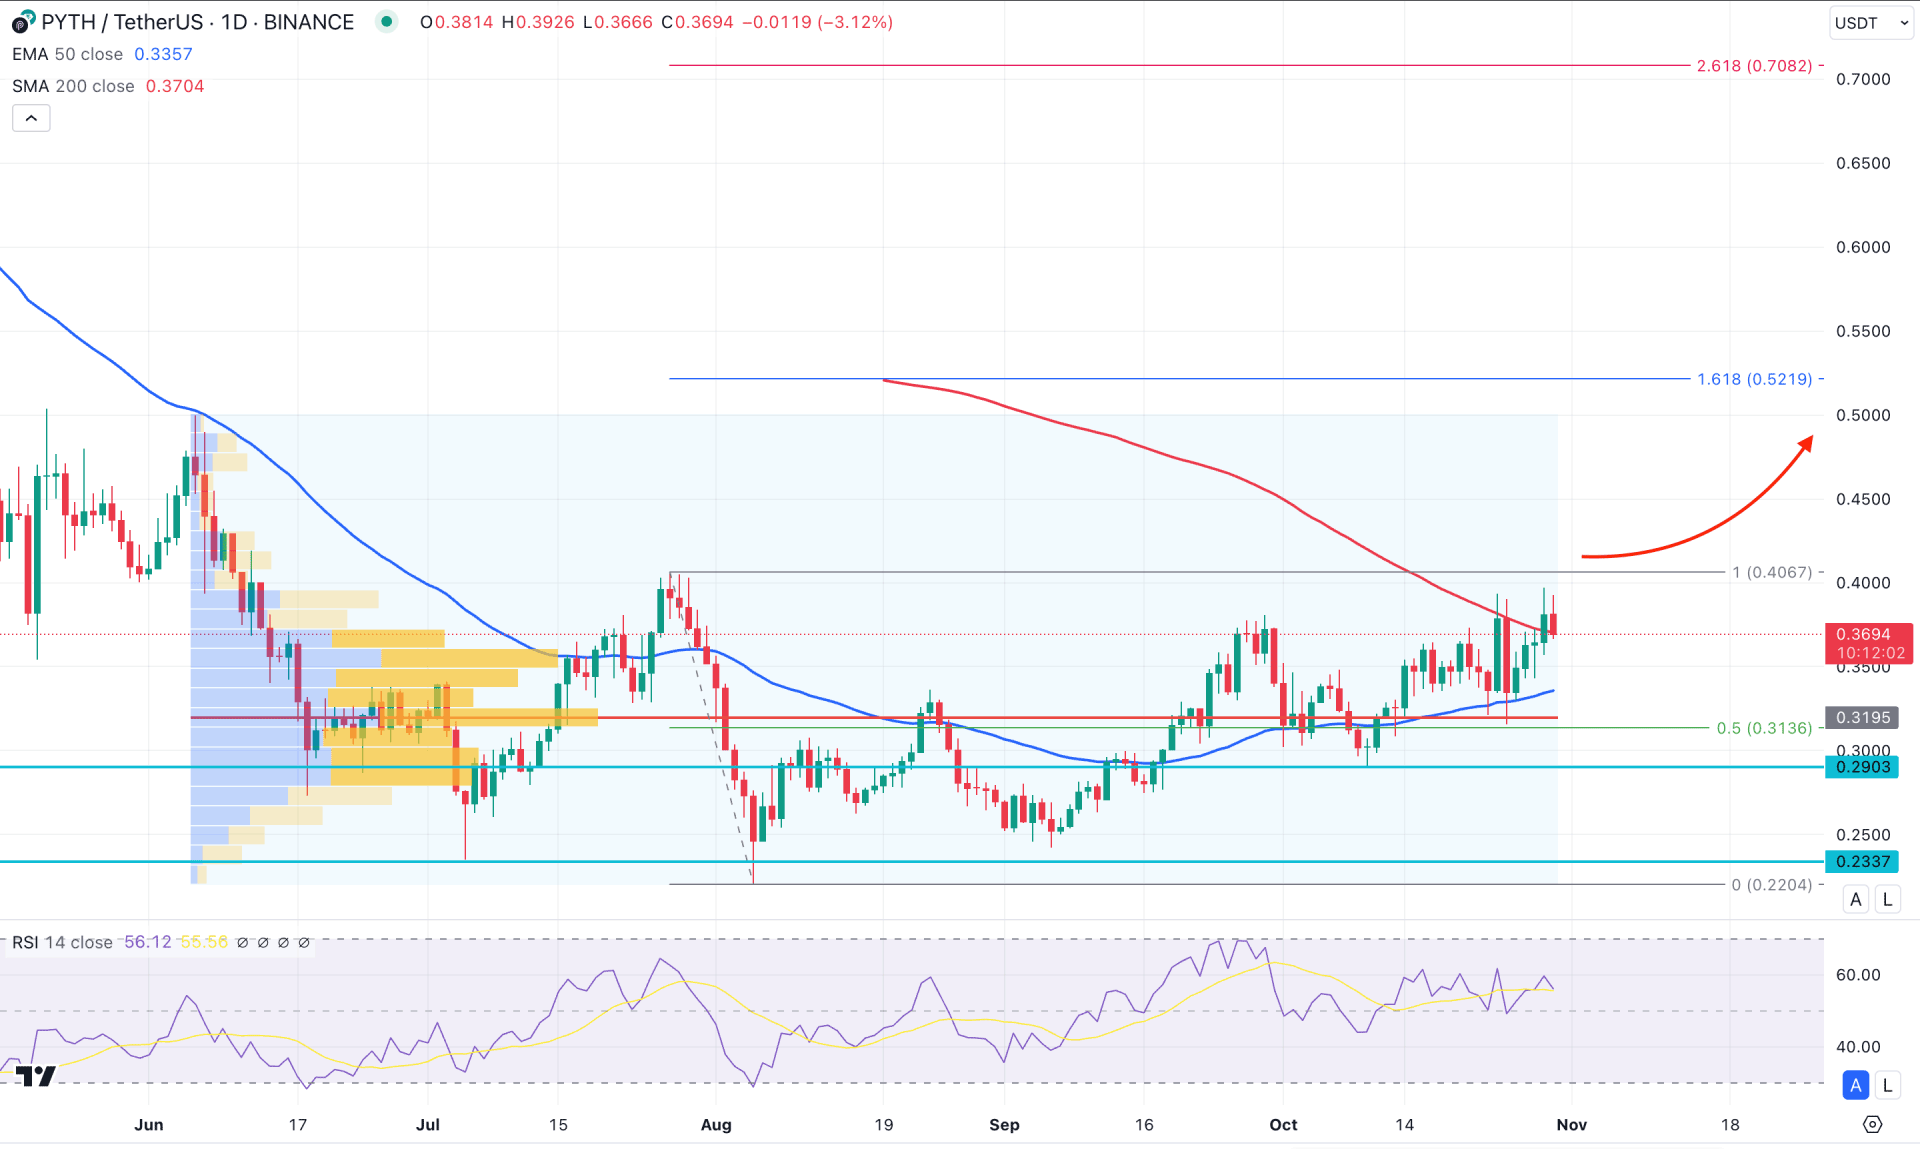
In the daily chart of PYTH/USDT, the recent price remains sideways, where a valid range breakout could be a trend trading opportunity.
In the higher timeframe, the recent price showed a valid bullish two-bar reversal in September, where the current price is trading above the August 2024 high. Moreover, the buying pressure is visible in the weekly chart as the current price is aimed higher after a Doji formation. However, the weekly high of 0.4067 is still protected and a valid buying pressure above this line could be a potential bullish signal.
In the volume structure, the highest activity level since January 2024 is below dynamic lines, which signals a positive outlook.
In the main price chart, the latest daily candle has formed a bullish reversal above the 200-day Simple Moving Average line. As it is the first sign of an upward continuation, more clues are needed before anticipating a long move. However, the 50-day Exponential Moving Average is still below the current price and is working as an immediate support.
In the secondary indicator window, the Relative Strength Index (RSI) hovers above the 50.00 line, which signals a corrective price action.
Based on the daily market outlook of PYTH/USDT, the ongoing buying pressure is potent as long as the high volume line remains below the current price. In that case, a bullish reversal from the 50-day EMA with consolidation above the 200-day SMA could open a long opportunity, aiming for the 0.5219 Fibonacci Extension level.
Moreover, a stable market above the 0.4070 level could increase the buying pressure above the 0.6500 psychological line. The alternative approach is to see how the price trades at the 200 day SMA line. In that case, a bearish daily close below the 50 day EMA could extend the loss and lower the price towards the 0.2337 support level.

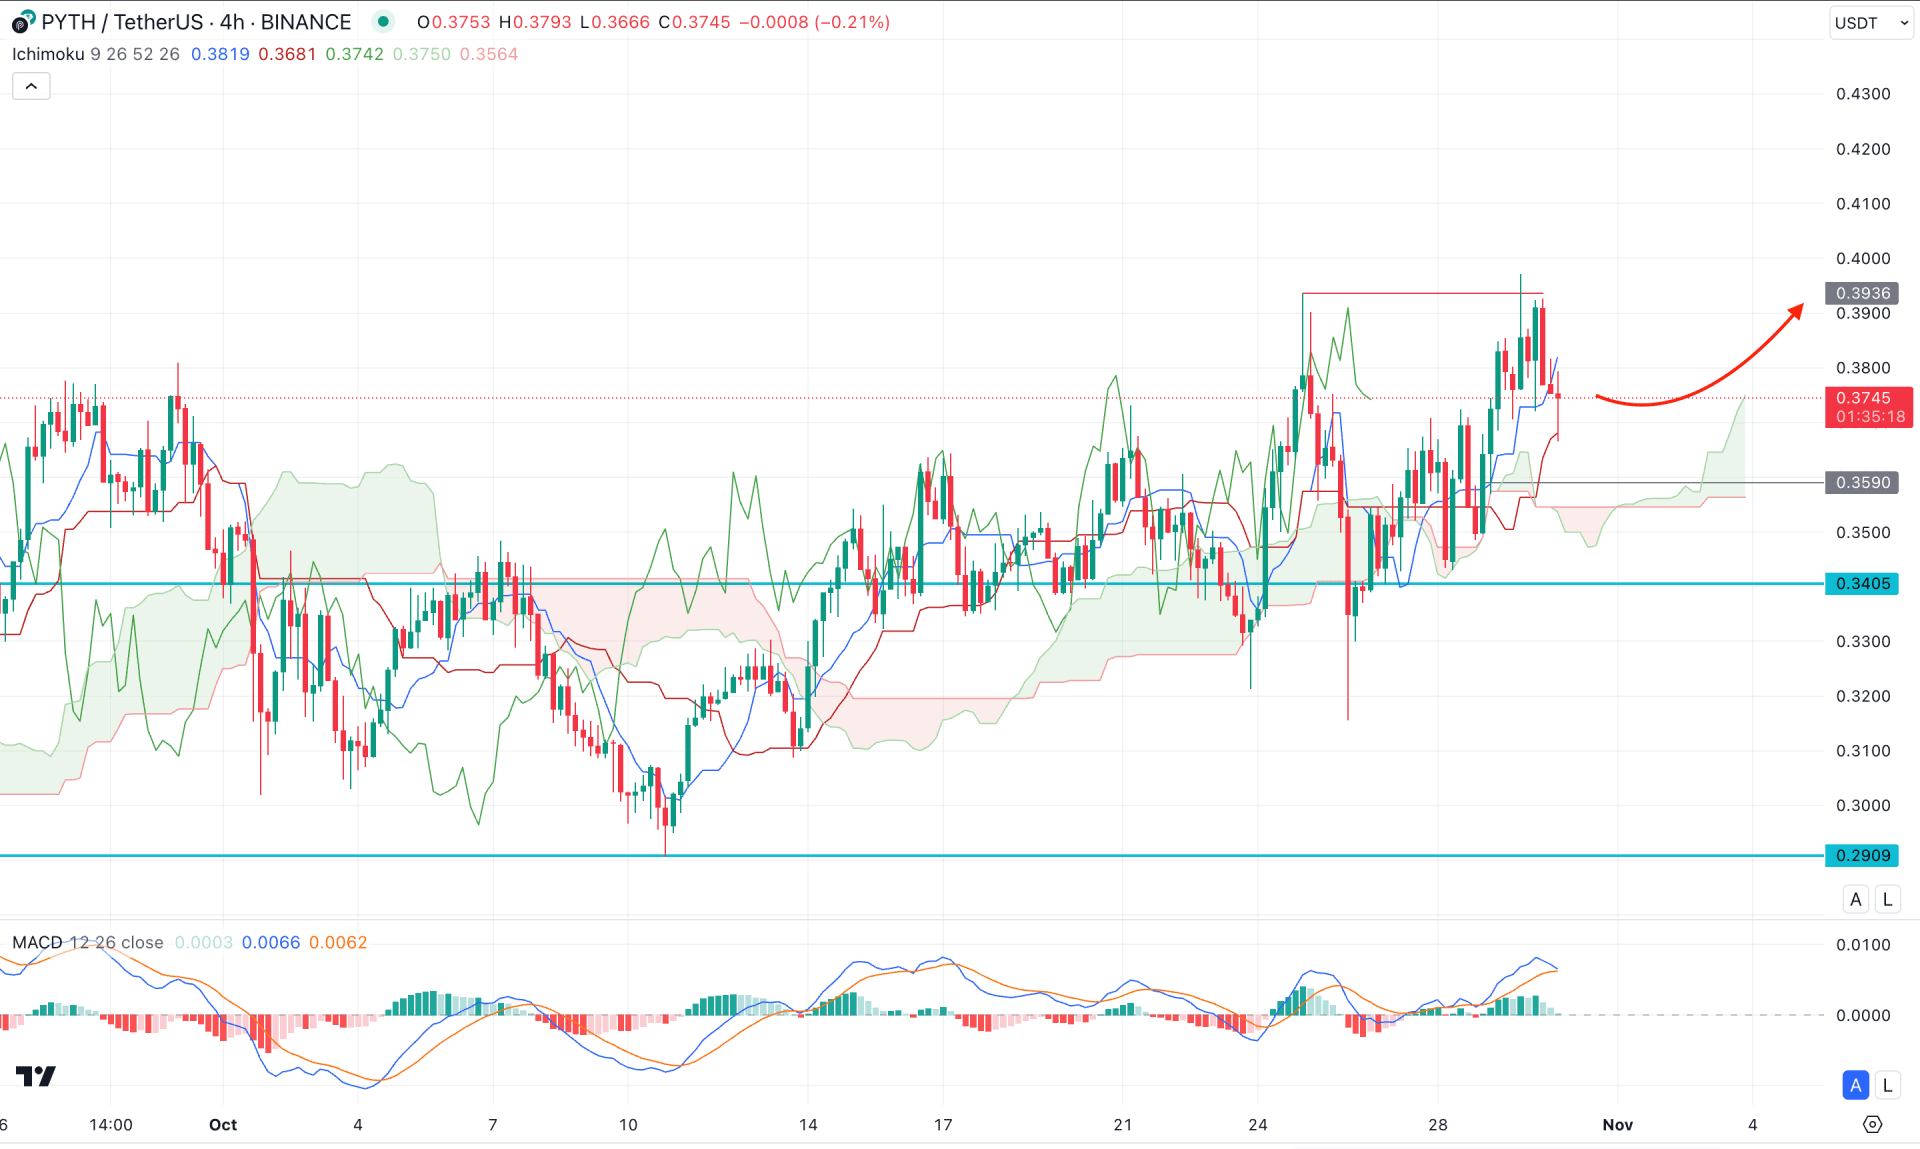
In the H4 timeframe, the current price is trading above the dynamic Ichimoku Cloud zone with a volatile structure. However, the future cloud looks positive to bulls, where the Senkou Span A is above the Senkou Span B.
The indicator window shows a different story, where the Signal line showed a bearish crossover at the top. Moreover, the MACD Histogram remained at the neutral point, from where a red line could signal a selling pressure in the main chart.
Based on the ongoing market pressure, the buy side liquidity sweep from the 0.3936 high could signal a bearish possibility, where the dynamic Kijun Sen is the immediate support. In that case, a valid bullish reversal from the 0.3590 to 0.3405 zone could signal a high probable long opportunity, aiming for the 0.4300 area.
On the bearish side, a valid Ichimoku Cloud reversal with a daily candle below the 0.3400 line could extend the loss towards the 0.3000 area.

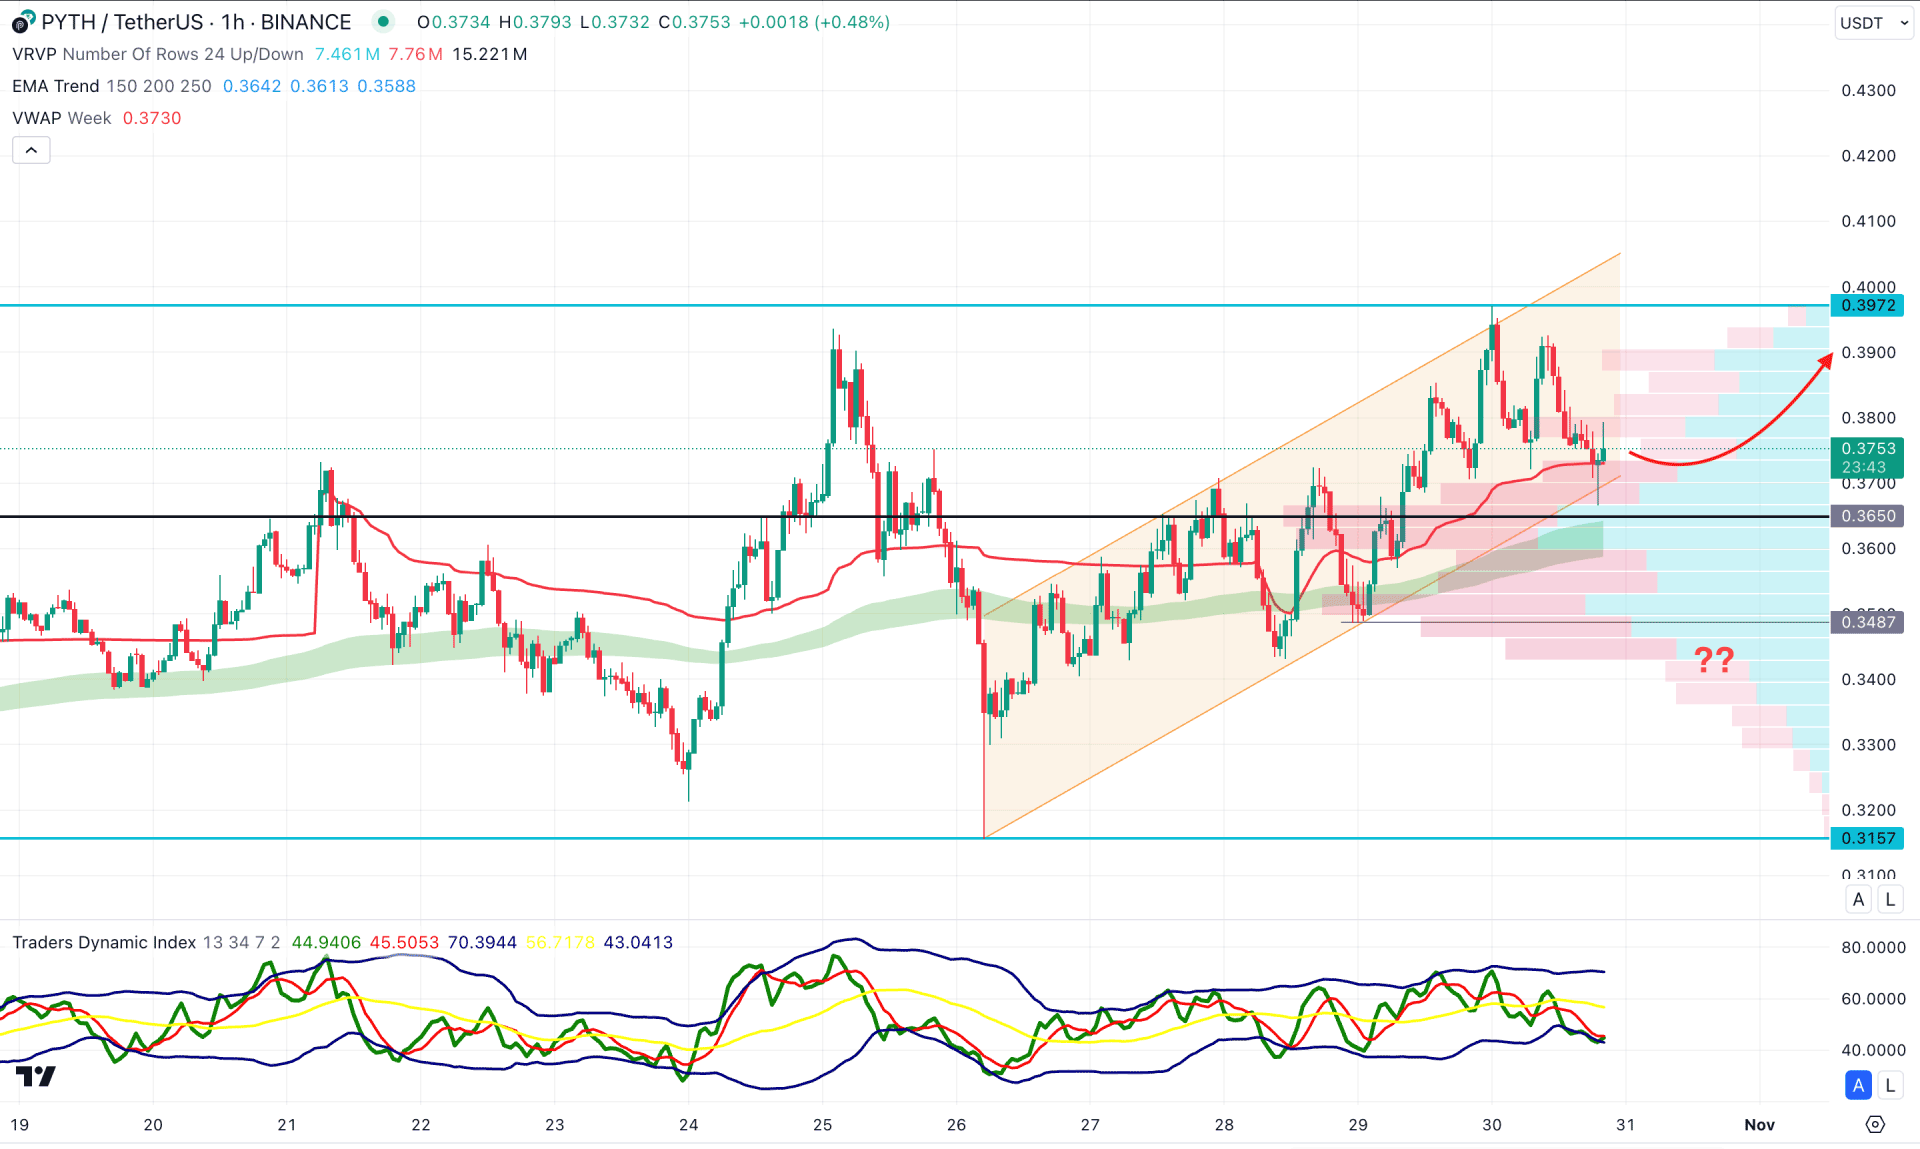
In the hourly time frame, the current market momentum is corrective, where the visible range high volume line is hovering below the current price.
On the other hand, the Moving Average Wave is below the current price and working as a major support, while the weekly VWAP is in line with the buying pressure. In that case, a valid buying pressure from the dynamic line could signal a potential trend continuation momentum as a channel extension.
The bearish approach is to wait for a valid bearish reversal from the channel support, where an hourly candle below the 0.3487 level might lower the price toward the 0.3200 area.
Based on the current market outlook of PYTH/USDT, the ongoing consolidation could signal a trend reversal after having solid buying pressure above the 0.4000 psychological line. However, a minor downside correction is possible in the intraday chart, which might offer an early buying opportunity.