
Published: June 11th, 2024
The value of POLYX, Polymesh's native token, showed an extraordinary movement since BlackRock, the world's largest asset manager, announced its entry into the thrilling domain of real-world asset (RWA) tokenization. As a result, the price of POLYX peaked and found a ceiling before showing a considerable downside correction.
Polymesh is a permissioned blockchain designed for regulated assets of institutional caliber. Addressing the challenges associated with governance, identity, compliance, confidentiality, and settlement encountered by public infrastructure streamlines outdated processes and paves the way for new financial instruments. POLYX, the native token of Polymesh, is utilized for staking to secure the network, paying transaction fees, and participating in governance.
Polymesh incorporates pre-installed financial primitives, allowing users to operate the blockchain with minimal fixed costs. It also enables developers to develop decentralized applications (dApps) on the platform. Polymesh is committed to resolving critical issues, including regulatory compliance, data privacy, identity verification, rule enforcement, and transaction finalization.
As stated in Polymesh's whitepaper, the project addresses the deficiencies of Ethereum and other general-purpose blockchains that could impede industries' and institutions' adoption of security tokens.
Let's see the further aspect of this coin from the POLYX technical analysis:
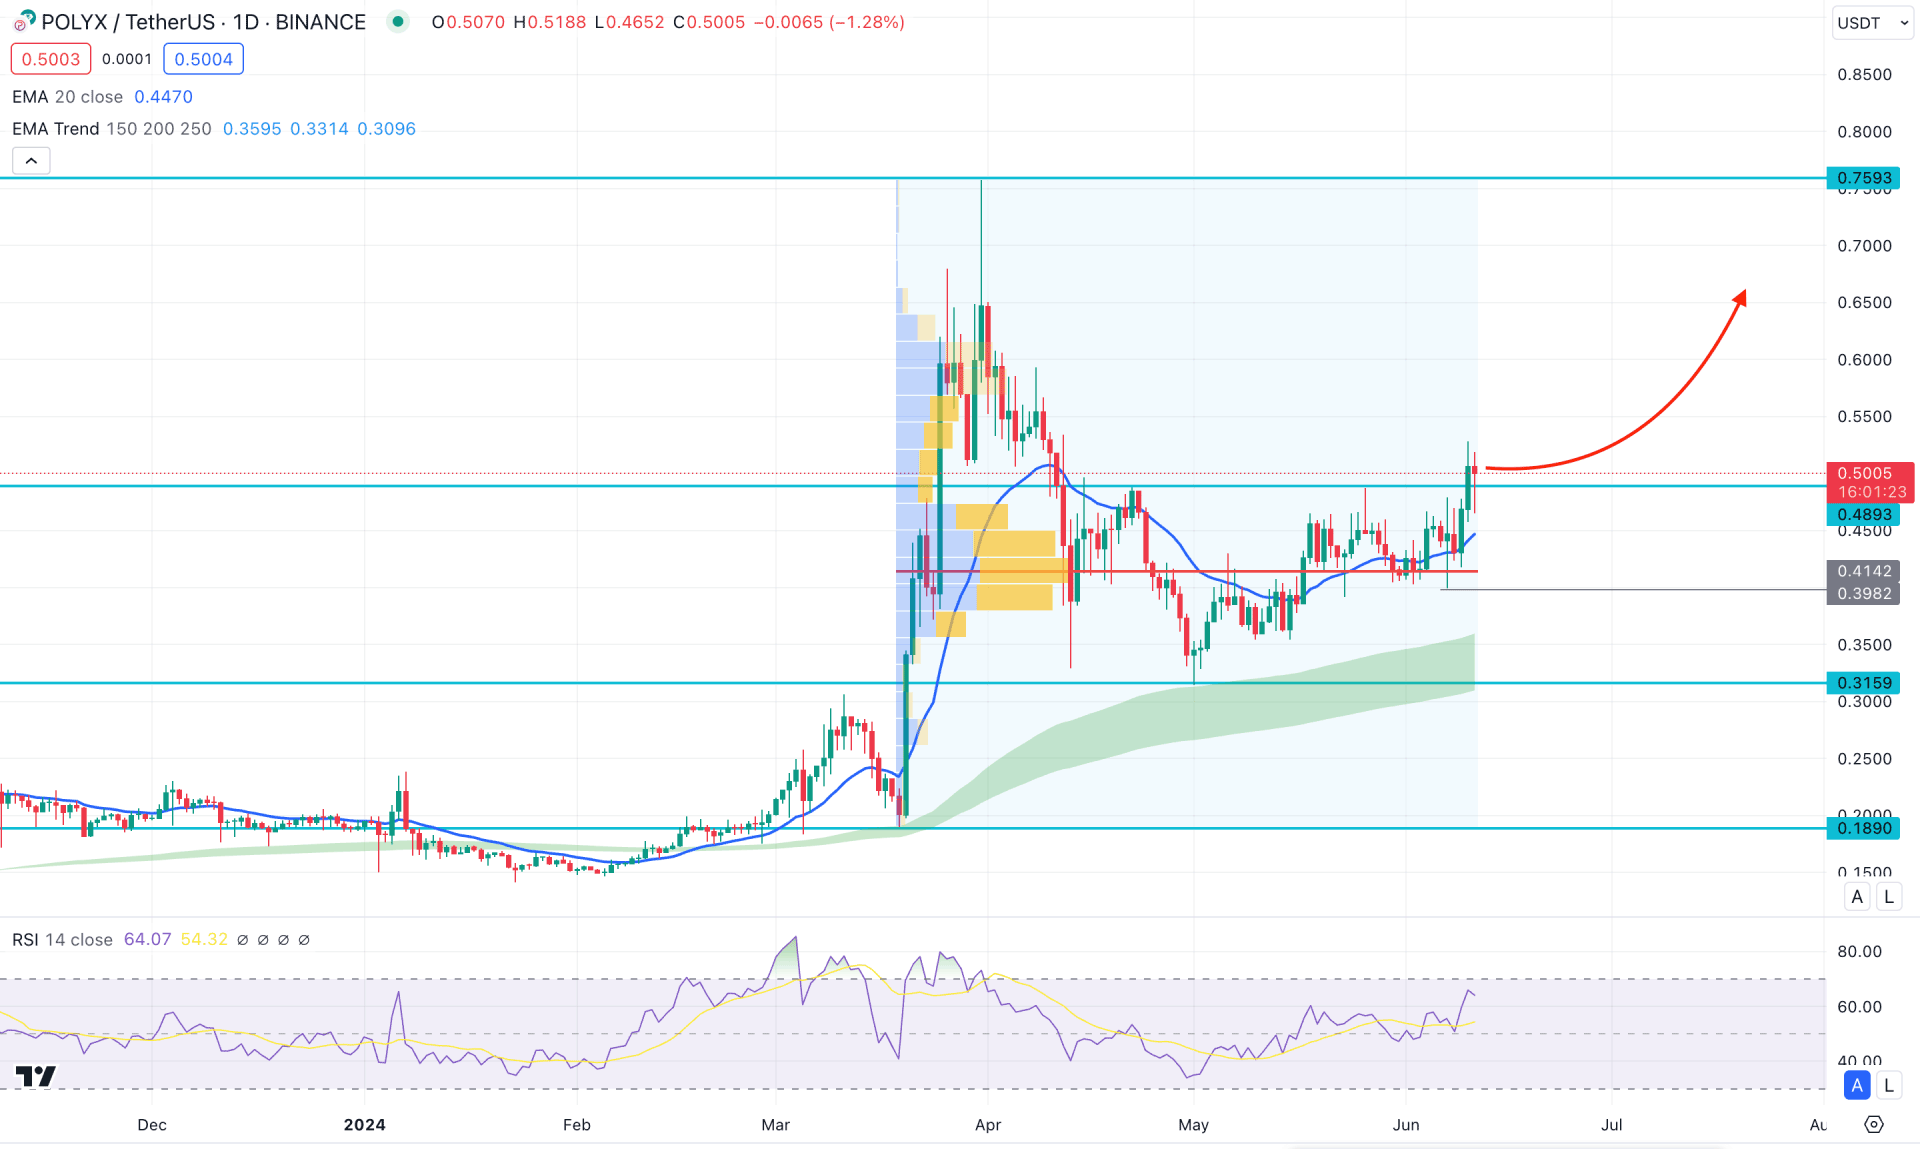
In the daily chart of POLYX, the broader market context is bullish as the recent price showed a downward correction within a bullish wave.
In the volume structure, the ongoing bullish pressure is valid as it is above the crucial high volume line. Based on the fixed range volume indicator, the most active level since 19 May 2024 is at 4.412 level, which is below the current price.
In the higher timeframe, the buying pressure is still within the bullish candle formed in March 2024. The price went higher, creating an all-time high at the 0.7593 level, before showing a considerable correction. The price went lower from the peak of the next month and rebounded higher without violating the monthly low. As the bulls showed interest from the discounted zone, we may expect the price to test the existing all-time high again.
In the daily price, the Moving Average wave consists of MA 150 to 250 and remains below the near-term static line with a bullish slope. As long as the price trades above this crucial MA wave, it is a sign that long-term bulls are still active in the market. Also, the near-term support is validated by the 20-day Exponential Moving Average, which is just above the high-volume line.
Based on the daily market outlook of POLYX/USDT, an upward continuation is highly possible, as shown by the bullish traction in RSI. In that case, the 20 day EMA carry could take the price at the 0.7000 psychological line as the first target.
On the other hand, a failure to hold the bullish momentum above the 0.5000 level with an immediate bearish daily candle below the 0.4142 level could lower the price towards the 0.3000 psychological line.
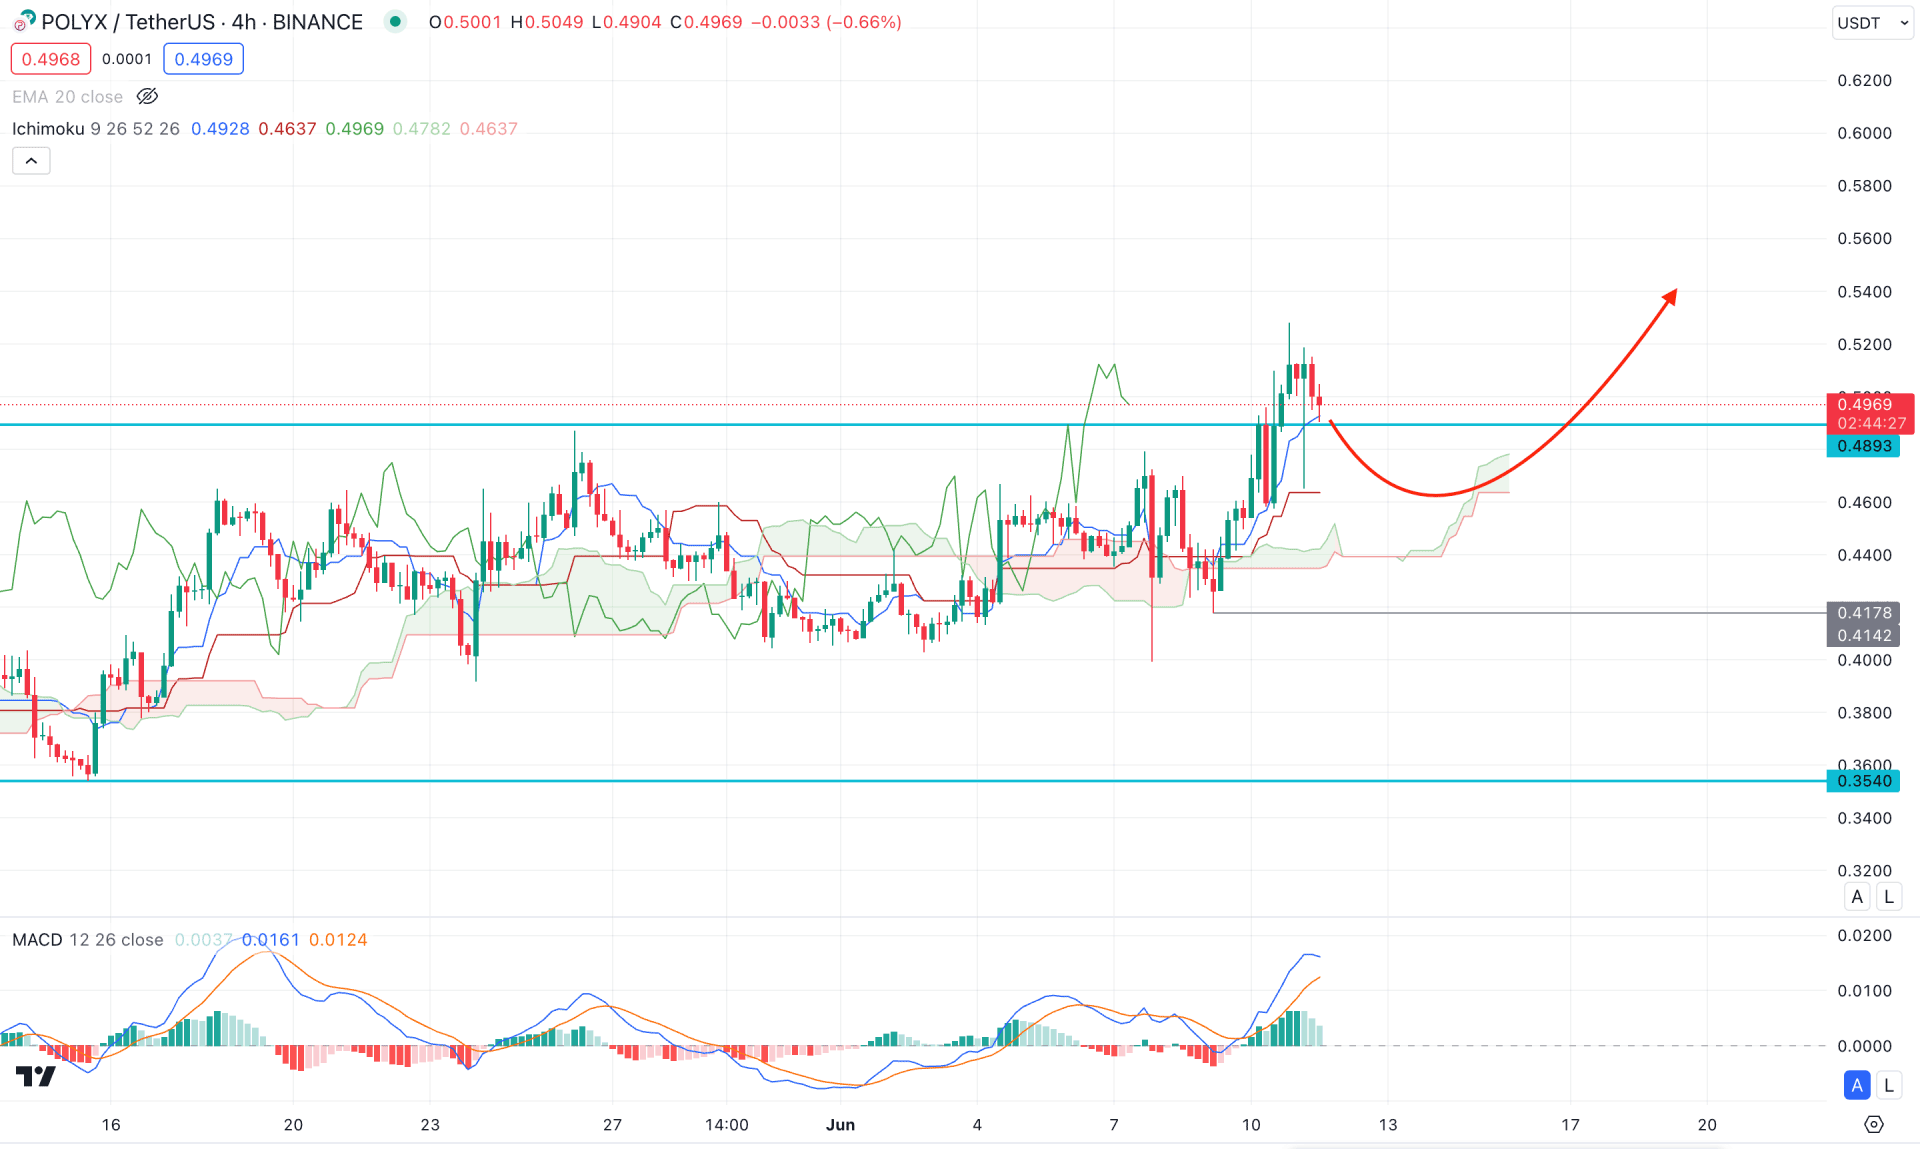
In the H4 chart of POLYX/USDT, a minor bullish breakout is visible from a prolonged range, suggesting a potential bullish impulsive wave from the dynamic Ichimoku Cloud zone. Moreover, the future cloud shows bullish traction, suggesting an active market pressure from buyers.
In the secondary window, the MACD Histogram started losing the buying pressure, while the signal line reached the top. It is a sign that the buying pressure is still valid but needs a minor correction.
Based on the POLYX/USDT H4 outlook, a bullish continuation opportunity might come after a valid buying pressure from the dynamic Kijun Sen level. In that case, the upward continuation might extend towards the 0.6000 psychological level.
The alternative approach is to find a bearish H4 close below the cloud low before aiming for the 0.3540 support level.
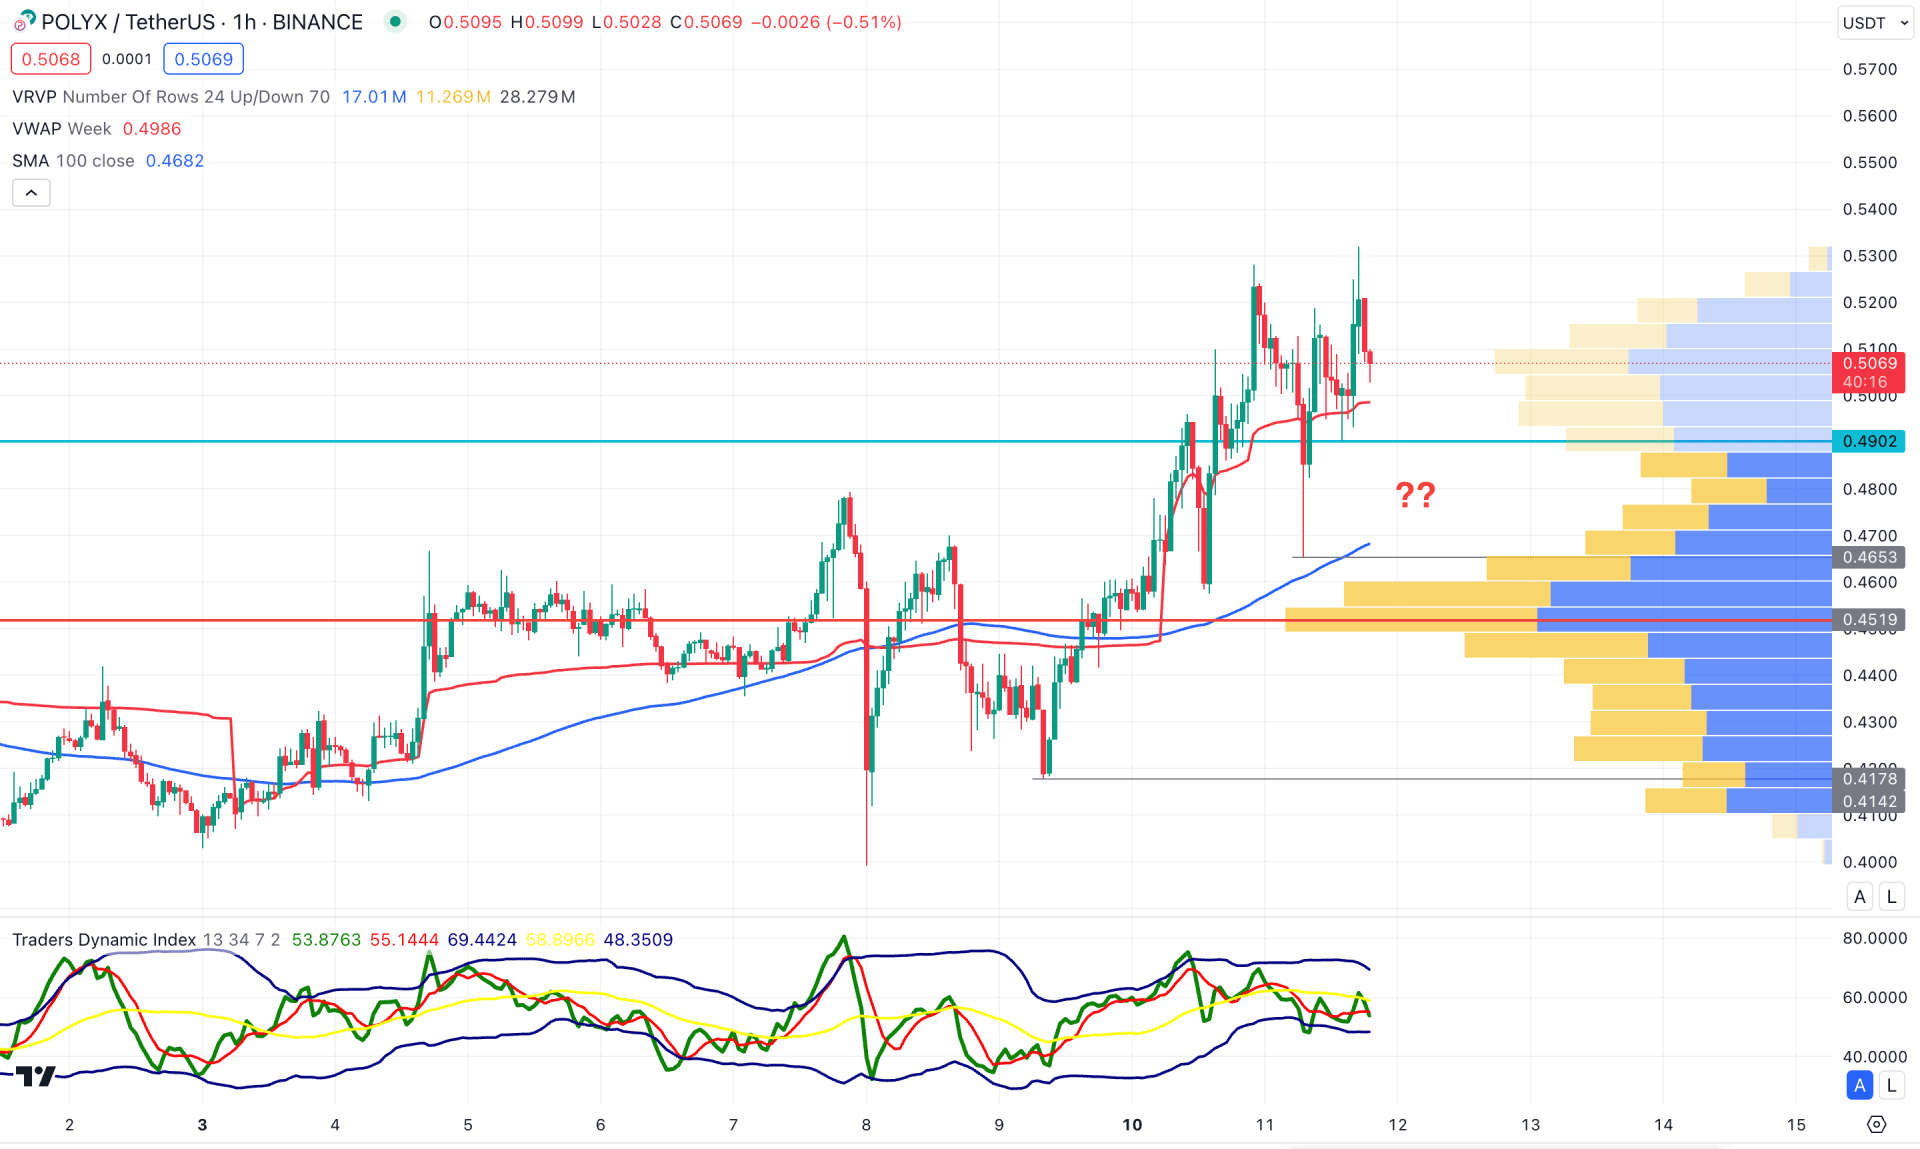
In the hourly time frame, the recent price shows strong buying pressure from the visible range high volume line, suggesting a possible bullish continuation.
The dynamic 100 SMA is acting as a major support, in line with the static 0.4356 level, while the VWAP is closer to the current price. However, the Traders Dynamic Index (TDI) remains corrective below the neutral 50.00 line, which signals a possible downside pressure.
Based on the hourly chart, the POLYX/USDT price is more likely to show a downside correction and grab the liquidity from the near-term demand zone. In that case, an additional bullish reversal candlestick from the 0.4900 to 0.4653 area could be a potential long opportunity, targeting the 0.5500 level. However, an extended downside correction with an hourly close below the dynamic 100 SMA line could lower the price in the coming hours.
Based on the ongoing market behavior, POLYX/USDT is more likely to grow, following the continuation of the bullish trend. In that case, investors should closely monitor how the price reacts at the intraday low, as a valid bullish reversal is needed from a solid bottom.


