Published: November 19th, 2024
As it prepares to release its fiscal quarterly earnings on November 20th, the spotlights are on Nvidia Corp NVDA this week.
This artificial intelligence giant is widely believed to double its data center operations in the third quarter.
In its third fiscal quarter, Nvidia is anticipated to generate $33.2 billion in sales at 74 cents per share, which would represent an 83% increase in both its top and bottom lines year over year. As of right now, analysts anticipate that Nvidia will report $37 billion in earnings on November 20th for its monetary fourth quarter.
It's important to note, though, that even if the release beats forecasts for the quarter and the outlook for the future, Nvidia's stock may momentarily decline following it.
In August, the Nasdaq-listed company released a better-than-expected direction and exceeded quarterly projections. Nevertheless, after the earnings report, the stock price dropped by as much as 6%.

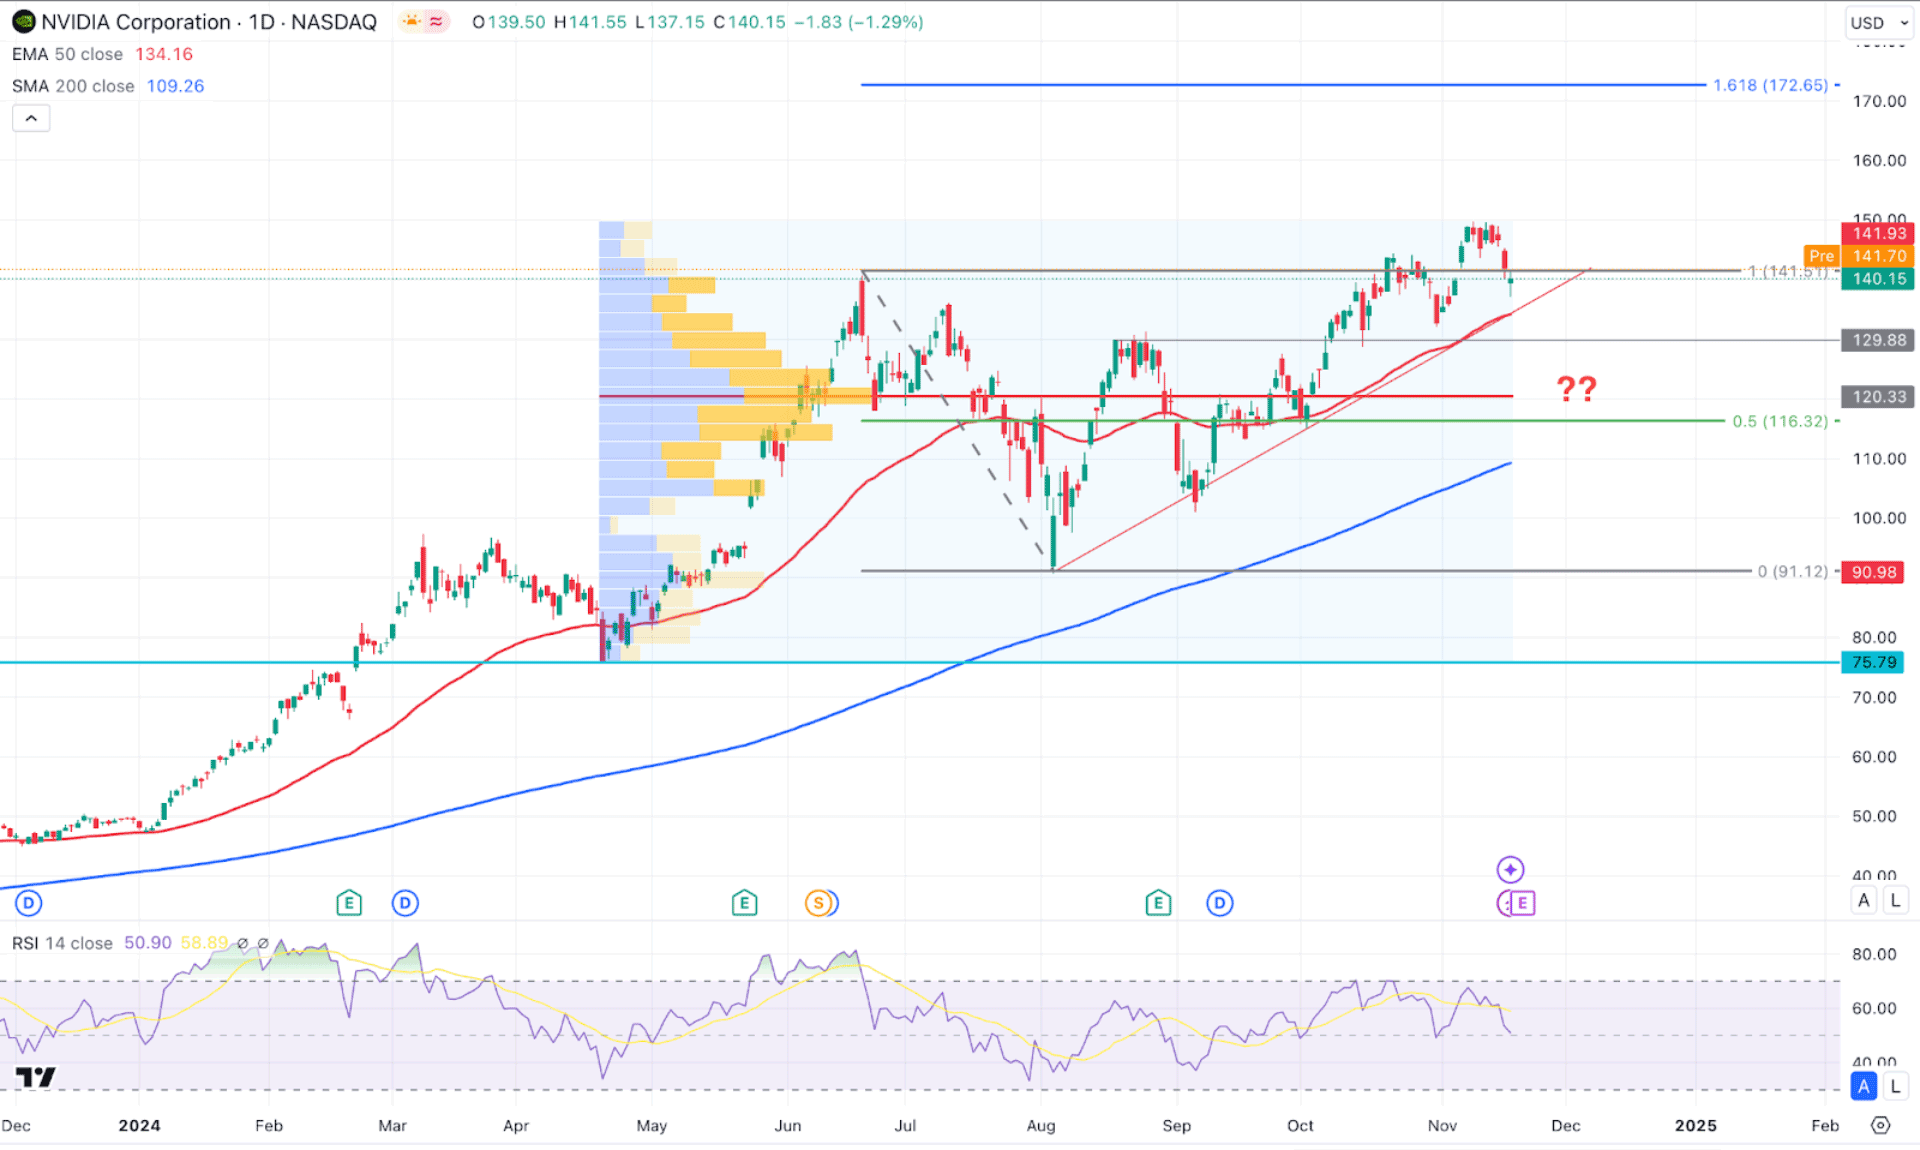
In the daily chart of NVDA, the overall market momentum is bullish, taking the price to a record high level. Moreover, the market cap of the company reached a record level of $3.0 trillion, increasing the possibility of an overbought position. As the price is already high, investors should remain cautious before opening a long position from the current trading zone.
In the higher timeframe, the latest monthly candle closed bearish from the all-time high, showing a bearish possibility. However, the September 2024 low is still protected, which might work as a crucial support line.
In the volume structure, a bullish re-accumulation is present as the largest activity level since the April 2024 low is below the current price. In that case, a bullish continuation is possible as long as the high volume line is below the current price.
Based on the current market outlook, the price is more likely to show downside pressure. The rising trendline support signals the presence of enough liquidity, which needs to be grabbed before aiming higher. In that case, a valid bullish reversal from the 129.88 to 120.33 zone could be a potential long opportunity, aiming for the 172.65 Fibonacci Extension level.
However, an immediate bullish opportunity is present, where a daily candle above the 150.00 level could be a buying signal for a shorter period.
On the bearish side, immediate selling pressure is potent, where a valid bearish daily candle below the 120.00 psychological line could be a potential bearish signal. In that case, the downside pressure might extend, aiming for the 90.98 support level.

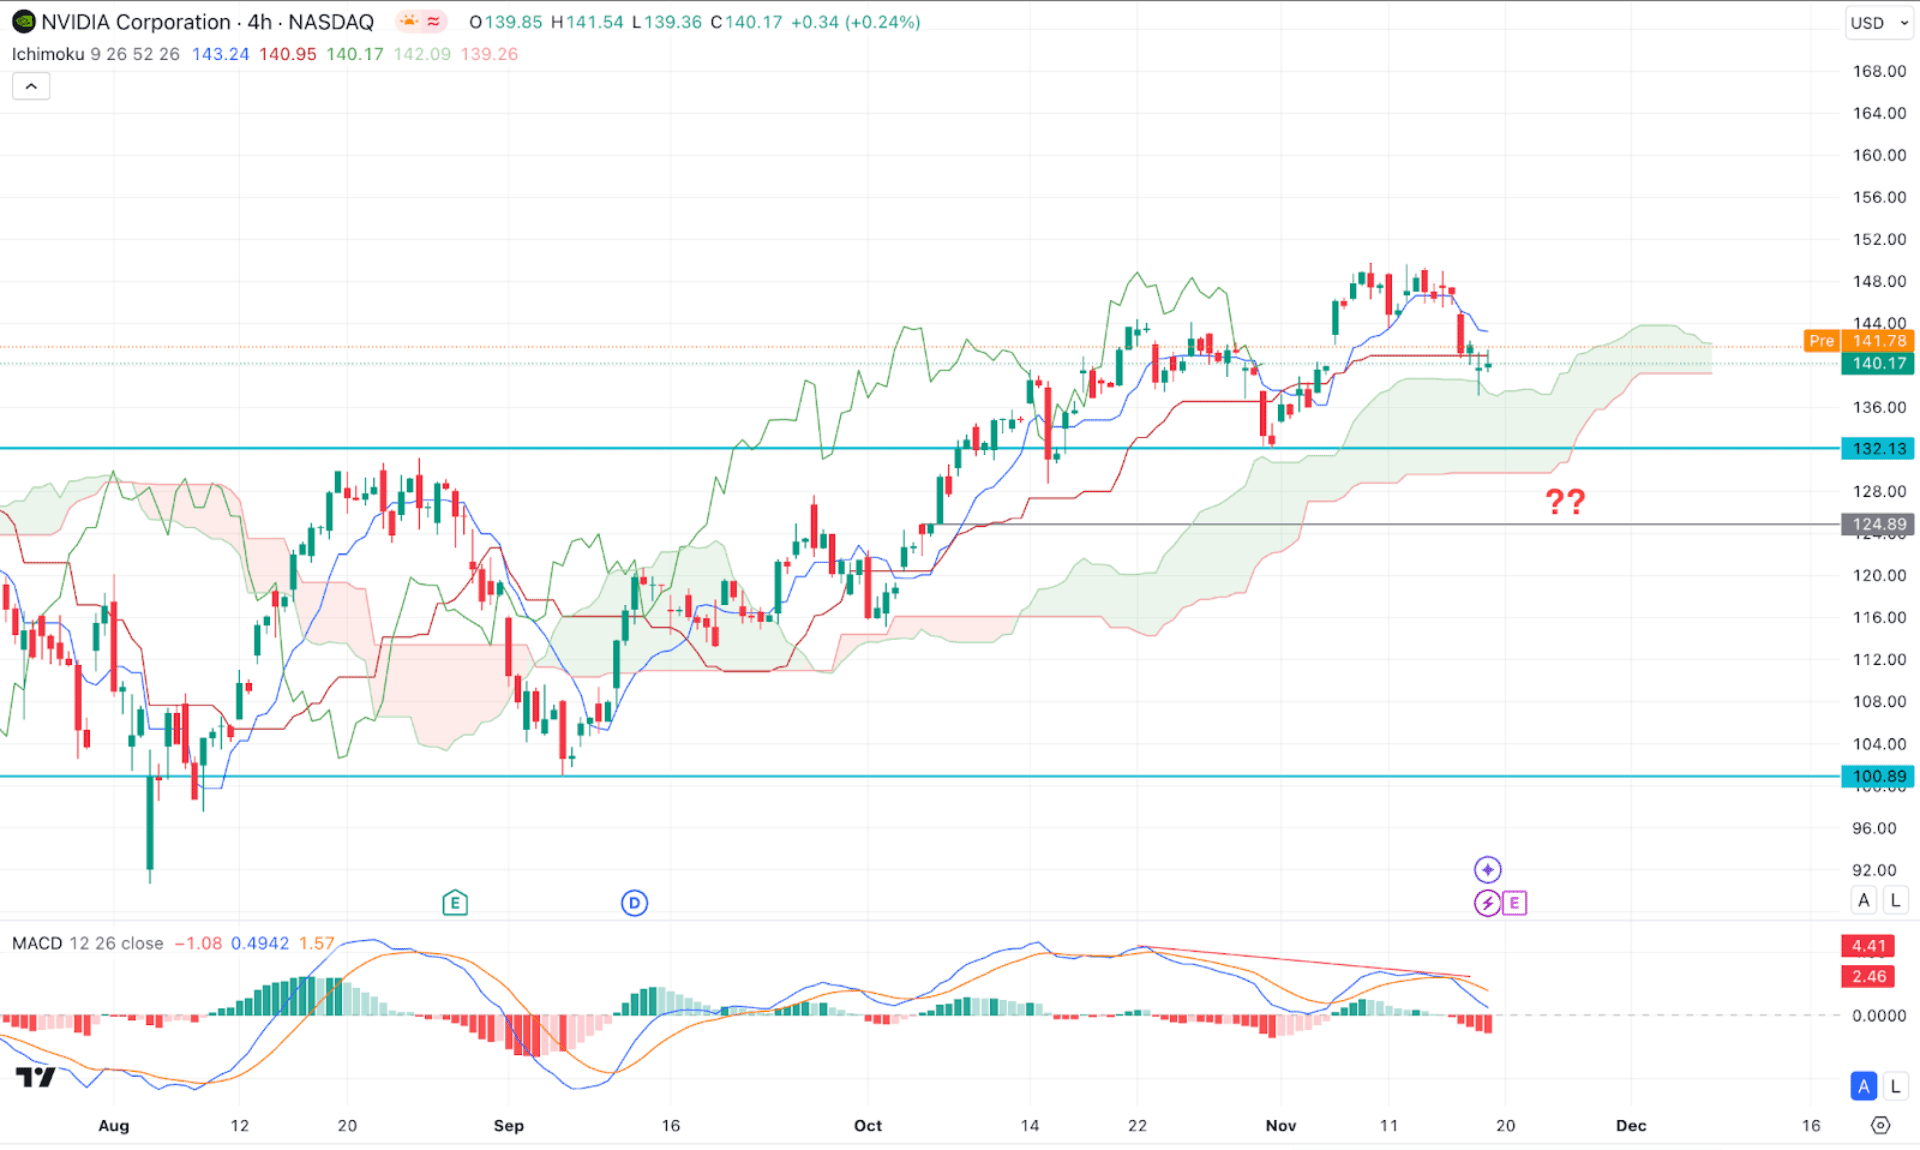
In the H4 timeframe, the ongoing market momentum is bullish as the current price is hovering above the Ichimoku Kumo Cloud. However, the buying pressure from the bullish breakout posint has faded after reaching the all-time high level. As a result, a divergence has formed with most of oscillators, creating a limit to bulls.
On the other hand, the MACD Signal line moved below the neutral line with a bearish crossover in Signal lines. The red MACD Histogram with a divergence in the signal line suggests a potential bearish pressure, which needs to be validated from the price action.
Based on this structure, a potential downside pressure might come as the price already moved below the dynamic Kijun Sen support. In that case, the price is more likely to move down and find a support from the cloud zone.
However, the possible selling pressure might not be enough to consider a trend change. A proper selling opportunity might come after breaking below the 124.89 level with a bearish H4 candle. In that case, the downside pressure might appear, aiming for the 110.00 area.

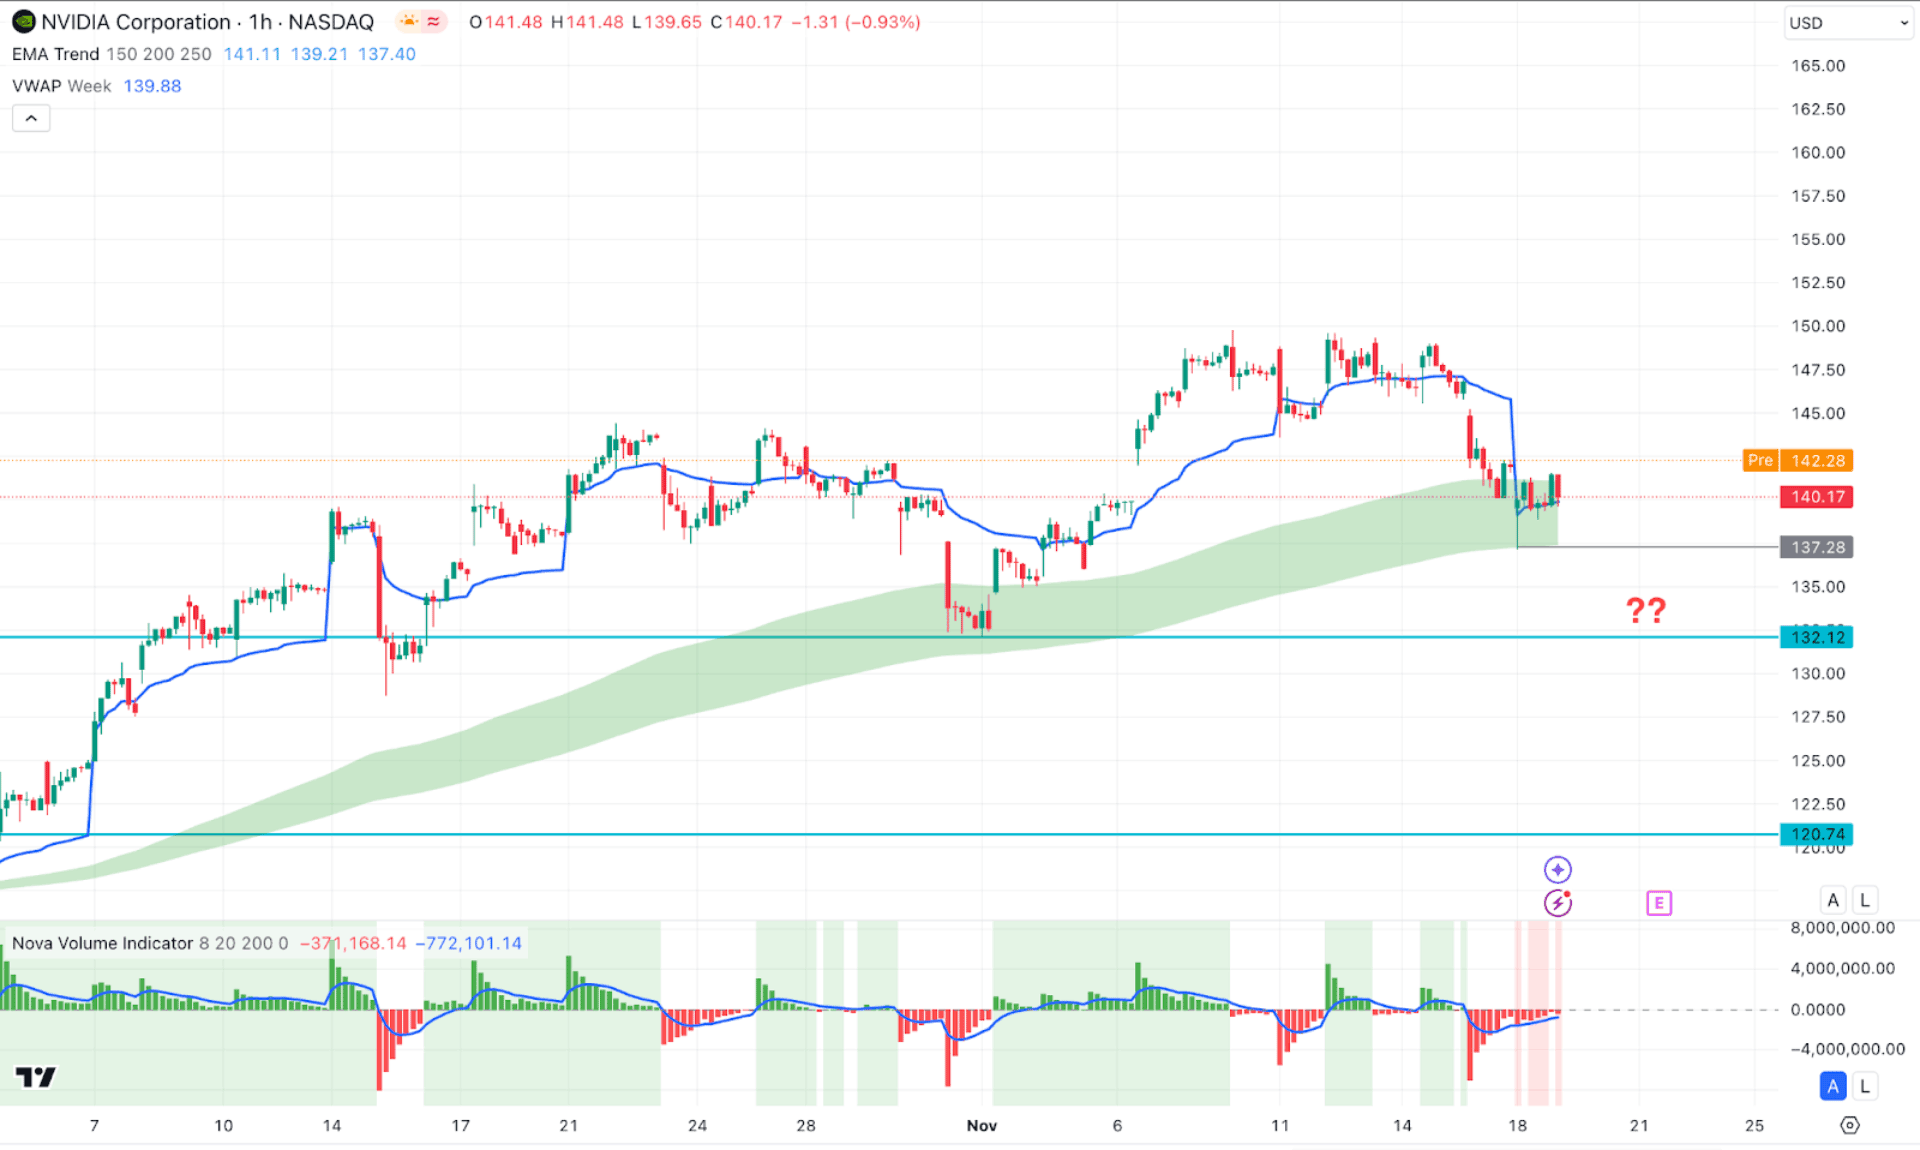
In the hourly timeframe, NVDA is trading within a stable bullish trend, where the current price is trading at a support zone after making a valid swing high. Primarily, the aim of this stock is to look for long trades from the support zone but with proper validation.
In the main price chart, the price moved below the weekly VWAP level, suggesting ongoing selling pressure. However, the Moving Average wave is still below the current price and is working as an immediate support.
In the secondary window, the Red Histogram keeps moving higher, suggesting a weaker sell volume. However, a flip is yet to happen, which can confirm the buy-side volume injection in the market.
Based on this outlook, an immediate bullish opportunity might come after overcoming the VWAP line with a valid hourly candle. In that case, the price might increase the pressure and move beyond the 150.00 area.
On the bearish side, a deeper discount is possible from the 136.00 to 120.74 zone from where another long signal might come. However, a bearish H1 candle below the 120.00 line might signal a bearish overextension, which could lower the price toward the 100.00 area.
Investors should remain skeptical about determining the future price of NVDA. Considering the ongoing market demand for artificial intelligence, NVDA could rise and create a new all-time high after the Q3 earnings report. However, a deeper correction is also pending in the intraday chart, which might initiate a sell-side liquidity sweep.