
Published: November 20th, 2025
Following the Bureau of Labour Statistics' (BLS) decision to postpone the release of the October employment report, stock indices dropped from their highest points on Wednesday. Following the December 9–10 FOMC meeting, the November employment report — which will incorporate the October figures — will be released on December 16. The likelihood of a Fed rate reduction at the FOMC meeting the following month dropped from 70% this past week to 30% on Wednesday.
In the hawkish minutes of the FOMC meeting on October 28–29, "many" officials stated that it would probably be reasonable to maintain a stable interest rate for the balance of 2025.
In the week ending November 14, US MBA requests for mortgages decreased by -5.2%, with the buy mortgage sub-index declining by -2.3% and the loan modification sub-index declining by -7.3%. The standard 30-year fixed-rate mortgage increased by 3 basis points to 6.37% against 6.34% the week before.
Compared to projections of -$60.4 billion, the US trade deficit in August decreased to -$59.6 billion from -$78.2 billion in July.
Due to the abundance of postponed economic releases, this week's US economic agenda is extremely demanding. The Non-Farm Payroll showed a positive sign by coming at 119K, up from -4K in the previous month. Moreover, the Unemployment claim was down to 220K from 232K, while the unemployment rate was disappointing by coming at 4.4%.
Real profits, the S&P US services and manufacturing PMI, the US consumer mood index from the University of Michigan, and the services activity report from the Kansas City Fed are all scheduled for release on Friday.
Let's see what price tells us from the NDX technical analysis:
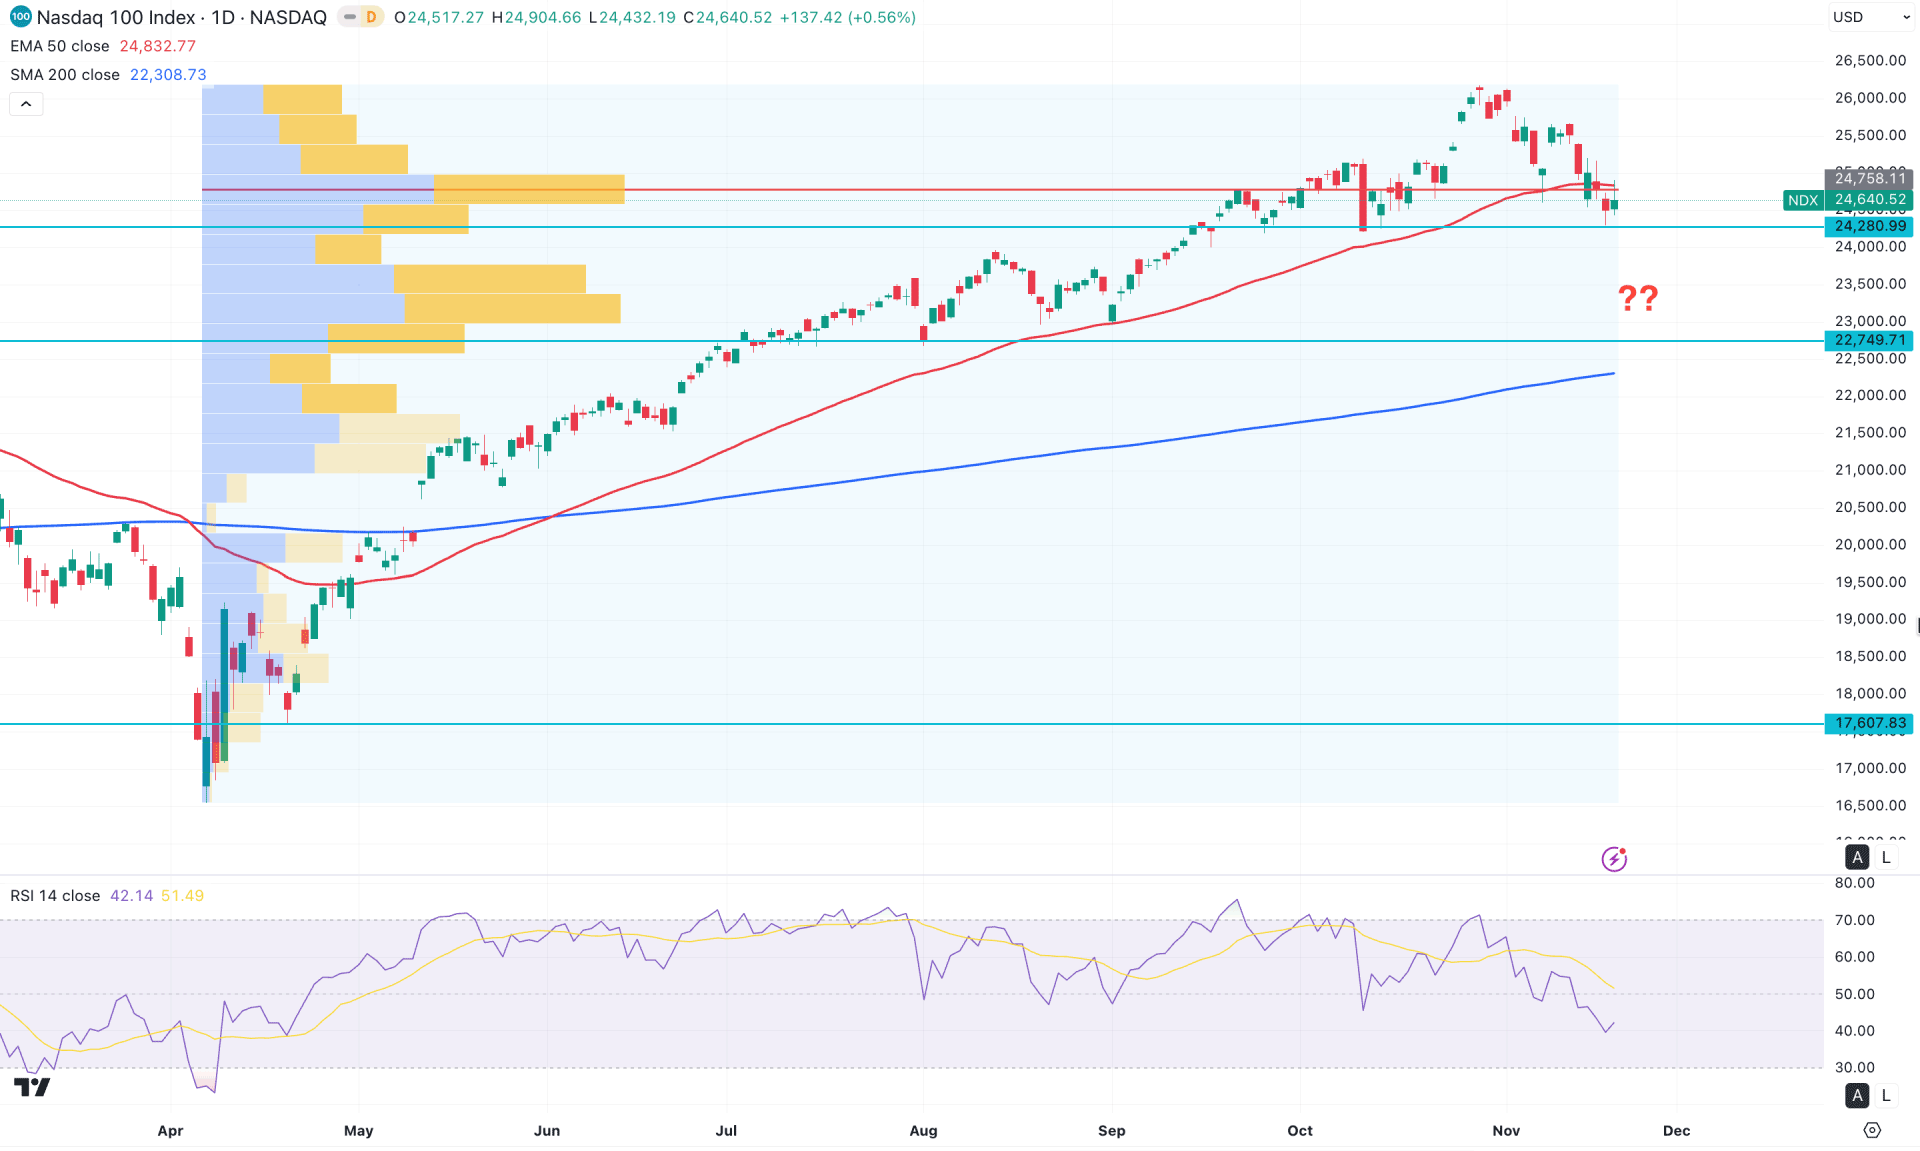
In the NASDAQ 100, the ongoing bullish momentum is clear as the price has been rising steadily since the April 2025 bottom. However, the most recent price action shows a minor bullish overextension, from which an extended downside correction could occur.
On the higher timeframe, a strong bearish reversal is visible on the monthly chart, while a valid close below the October 2025 low could pose a challenge for the bulls. Moreover, three consecutive bearish candles have formed recently, although the momentum is still holding above the 24,280.99 key support level. As long as this crucial support remains protected, the bullish continuation could resume at any time.
On the main price chart, a downside correction is visible below the 50-day Exponential Moving Average (EMA), whereas the 200-day Simple Moving Average (SMA) is still below the current price. Additionally, the high-volume node since April 2025 stands at 24,758.11, which is also above the current price. Primarily, a bearish correction below the dynamic 50-day EMA and the high-volume level signals a struggle for the bulls, even though the broader market momentum remains bullish.
In the secondary indicator window, the Relative Strength Index (RSI) is hovering between the 50.00 and 30.00 area, signaling a sellers' territory. Moreover, the Average Directional Index (ADX) has rebounded but is yet to move above the 20.00 threshold needed to validate a strong trend formation.
Based on the overall market structure, the NASDAQ 100 is struggling to hold the bullish momentum, with 24,280.99 acting as a crucial event level. A bearish break below this line could drag the price down toward 22,749.71 before testing the 200-day SMA.
On the other hand, the major market momentum is still bullish, with no bearish change of character formation. In that case, a bullish breakout above the high-volume line, followed by a daily close above the 50-day EMA, could resume the existing uptrend and potentially create a new swing high above the 26,000.00 psychological level.
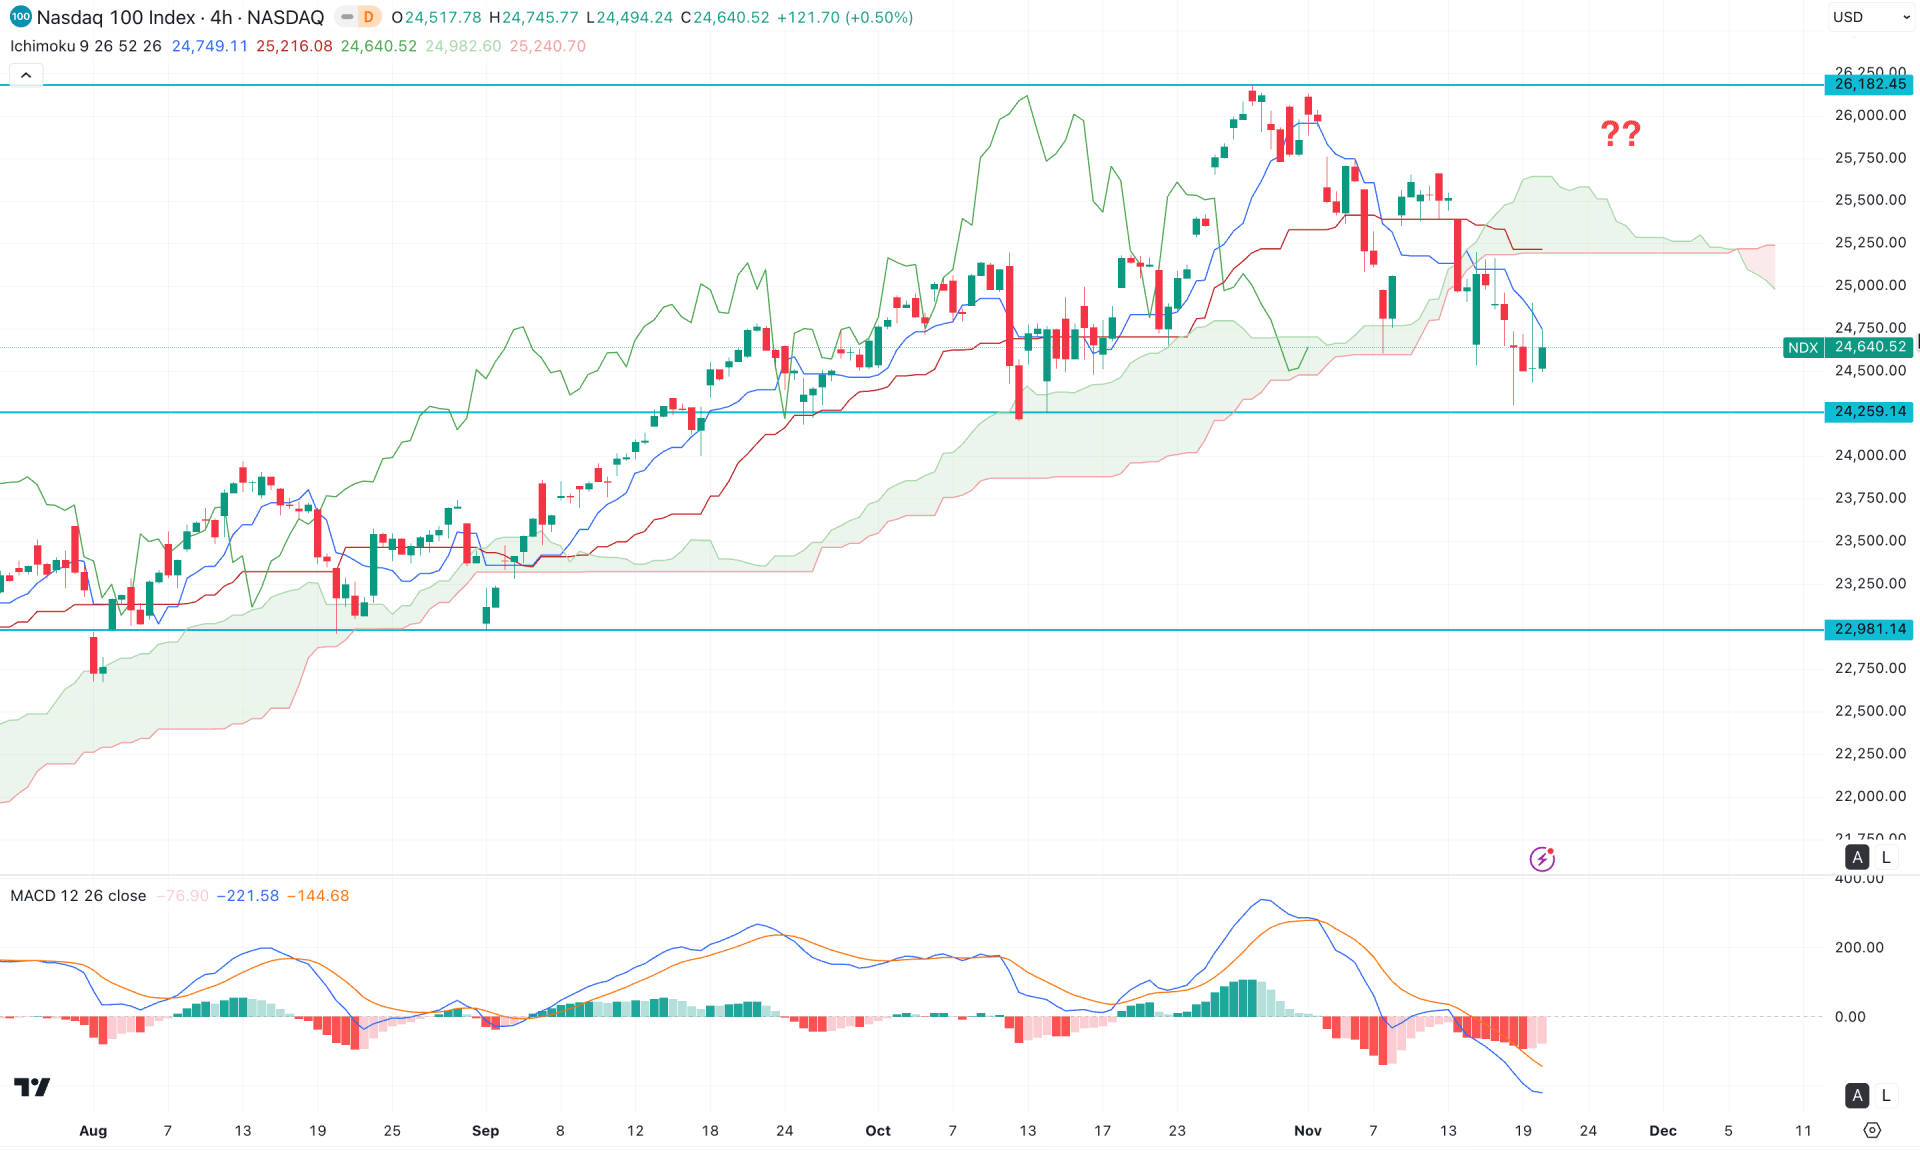
In the H4 timeframe, the recent price is trading below the Ichimoku Kumo Cloud with a corrective momentum. As the existing market momentum is bullish, sufficient bearish signals are needed before opening a short position.
In the Futures Cloud, the Senkou Span A moved below the Senkou Span B, suggesting a strong flip to sellers' zone. Moreover, dynamic Tenkan Sen and Kijun Sen lines are above the current price with a bearish slope, suggesting a confluence of selling pressure.
On the other hand, the MACD Signal line has reached the lower peak, suggesting a potential bottom formation. Moreover, the Histogram started to lose the bearish pressure and is yet to move to the neutral point.
Based on this outlook, the downside pressure could be limited as no sufficient confirmation is available for the downside continuation. In that case, a bullish flip above the cloud could resume the existing bullish trend at any time.
On the other hand, an extended downside pressure below the 24259.14 support level with a consolidation might lower the price towards the 22981.14 support level.
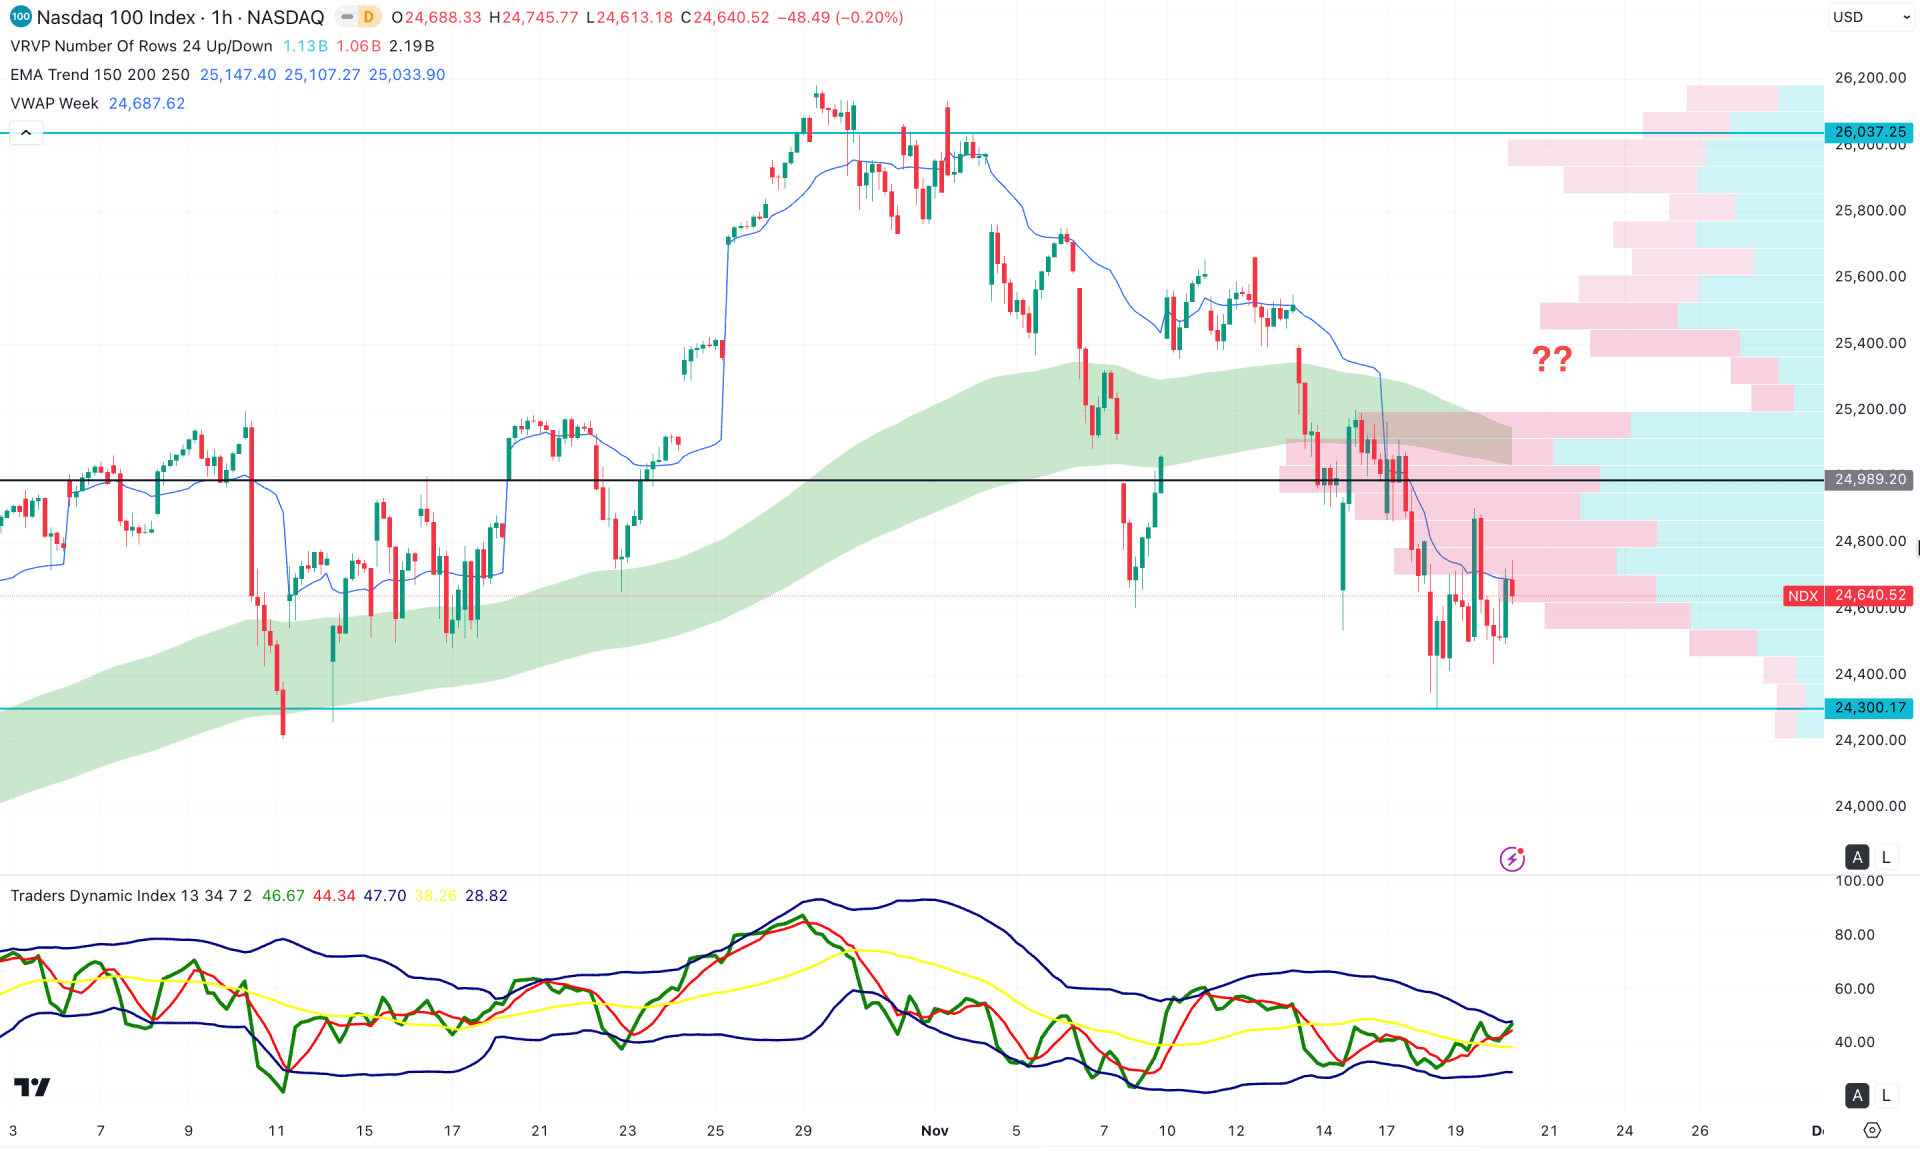
In the hourly timeframe, a corrective bearish pressure is visible where the dynamic EMA wave is acting as an immediate resistance. Moreover, the price shows multiple violations of the weekly VWAP line, suggesting a corrective momentum.
In the indicator window, the Traders Dynamic Index (TDI) has reached the upper peak area with a short squeeze. It is a sign of a strong buying pressure in the market with limited room for upside.
Based on this outlook, the corrective downside pressure needs a proper bullish breakout before offering a long opportunity. Primarily, a bullish pressure with a consolidation above the 24989.20 resistance level could resume the major bullish trend at any time. However, as long as the price hovers below the intraday high volume line, more downside pressure could come.
Based on the major market outlook, the Nasdaq 100 (NDX) is still trading within a bullish trend with no sign of exhaustion at the premium zone. However, a minor downside correction is visible, which might create a long opportunity from the intraday dip.


