Published: October 17th, 2024
The USDCHF maintained its advances for the second day in a row. Strong employment and inflation figures have reduced anticipation for rapid reduction by the Federal Reserve (Fed), which has helped the US dollar (USD) gain strength. There is presently no anticipation of a greater 50-basis-point rate decrease in November, with a 92.1% chance of a 25-basis-point cut, based on the CME FedWatch Tool.
The increased US Treasury yields following two days of losses have helped the US Dollar Index (DXY), which compares the worth of the US dollar to its six main counterparts. As of this writing, the 2-year and 10-year rates on US Treasury obligations are 3.94% and 4.03%, respectively, while the DXY is trading above the 2-month peak.
Safe-haven movements may restrict the Swiss franc's (CHF) decline amid escalating Middle East conflicts. Israel stepped up its bombings on Lebanon Wednesday, including one that demolished a major town's municipal buildings and killed 16 people, including the mayor. Based on Reuters, this is the worst attack on a state building in Lebanon since the start of the Israeli airstrikes.
The Swiss National Bank (SNB) is likely to slash interest rates by an additional 25 basis points in December after the country's inflation rate dropped to 0.8% in September, its lowest level in three years. For the third straight decrease, the SNB lowered the benchmark interest rate by 25 basis factors to 1% in September, pushing borrowing costs down to their lowest position since early 2023.
Let's see the upcoming price direction of this currency pair from the USDCHF technical analysis:

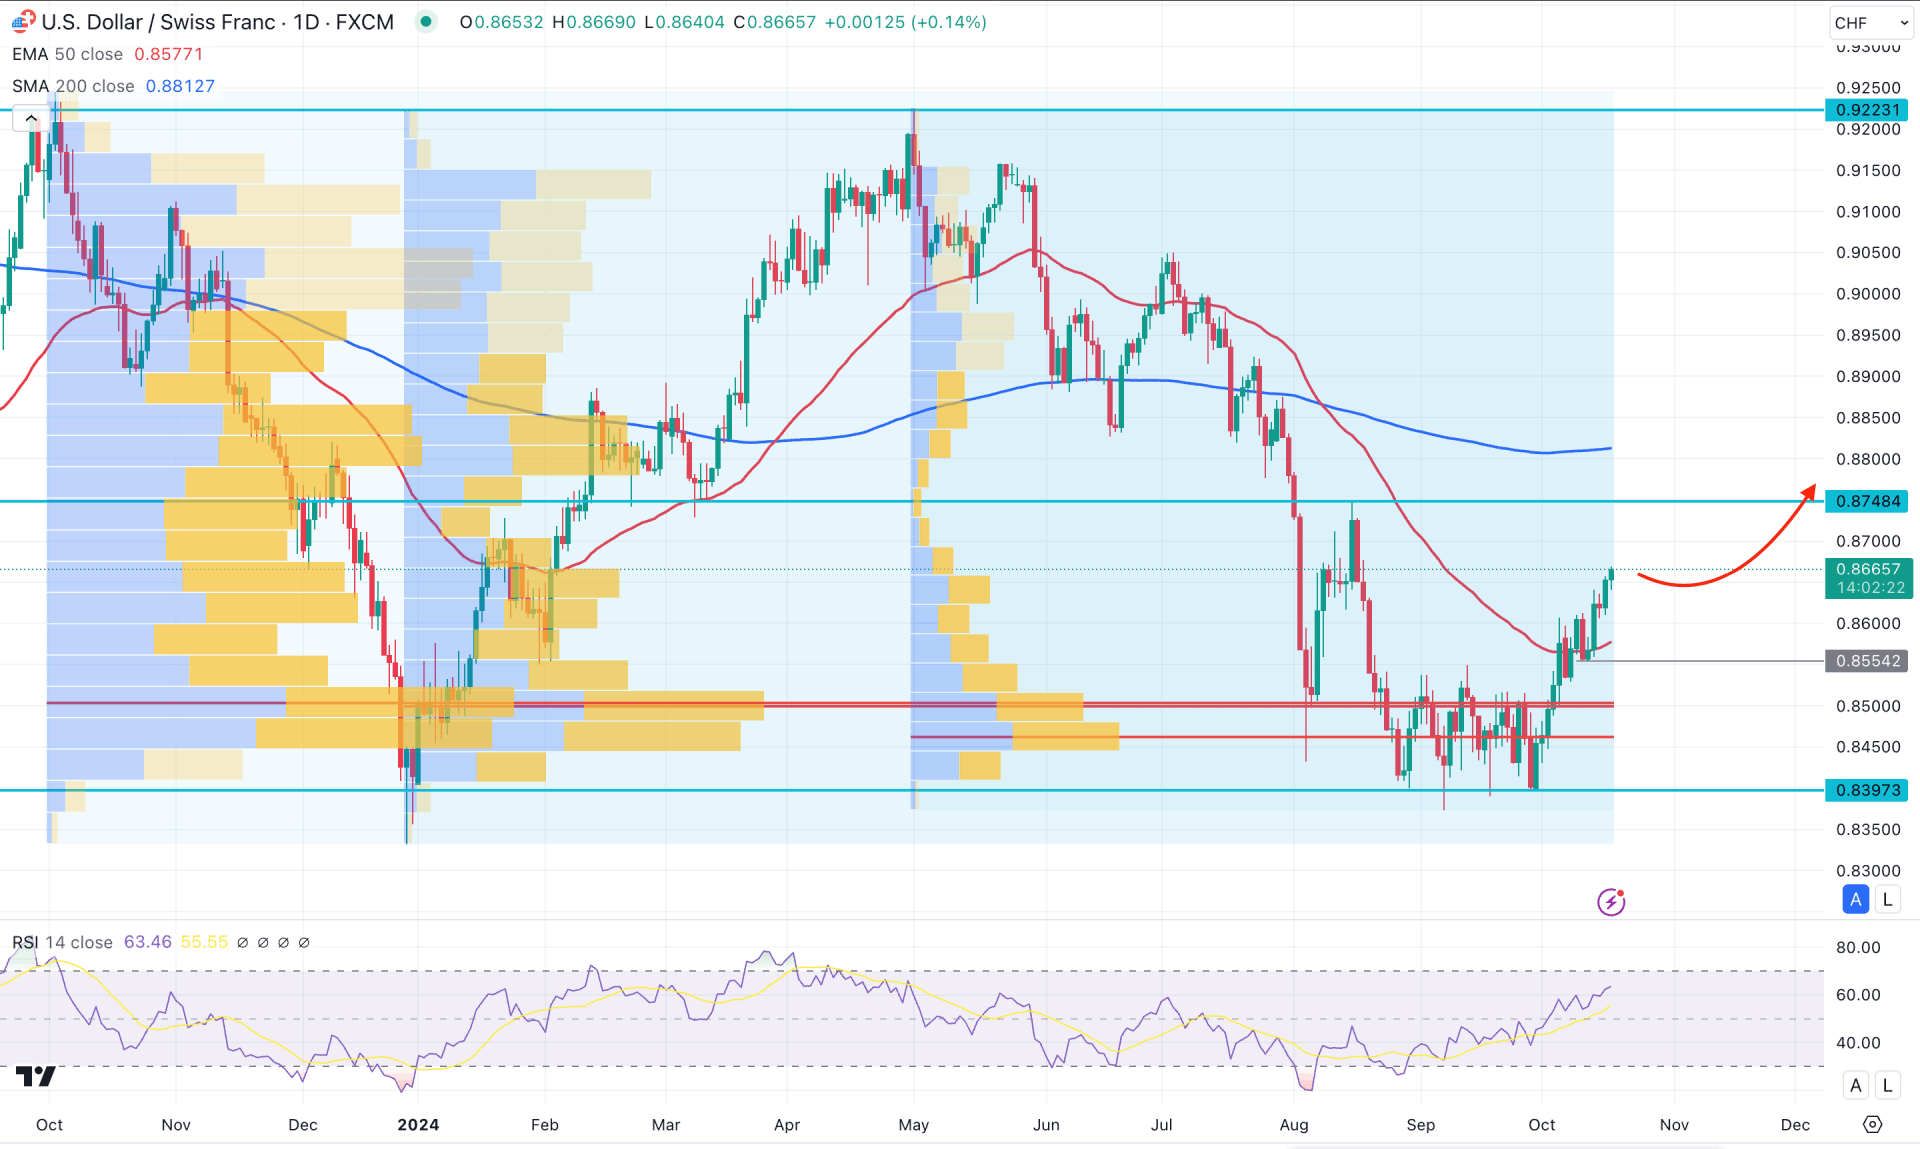
In the daily chart of USDCHF, impulsive buying pressure is visible from the recent consolidation, suggesting a potential reversal signal.
In the higher timeframe, the current price is trading within a bullish month, which is a remarkable gain after five consecutive bearish candles. If a valid monthly close appears above the September 2024 high, the buying pressure might extend.
The recent price is trading above a consolidation, where the current high volume line is within an immediate bullish order block. As per the High Volume level indicator, the most active levels since October 2023, January 2024, and May 2024 are closer together. It is a sign that long-term investors have joined the market from the near-term low. The weekly price showed a valid bullish reversal from the bullish engulfing pattern with a continuation above the 0.8612 high.
In the main price chart, the recent price was above the 50-day EMA with a valid daily candle formation. It is a sign of a minor trend shift, where the long-term trend of 200-day SMA is still above the current price.
The indicator window shows the same story, where the current RSI level showed a U-shape recovery, above the 50.00 neutral line. As the current RSI line still hovers below the 70.00 overbought line, we may consider it as a pending bullish continuation opportunity.
Based on the daily outlook of USDCHF, buying pressure above the 50-day EMA is likely to extend higher and test the resistance of the 0.8748 level. However, a minor downside correction might appear, with near-term support at the 0.8554 level.
On the bullish side, a break above the 0.8784 level could open the door to reaching the 0.9000 psychological line. However, selling pressure with a daily candle below the 0.8550 level could extend the selling pressure towards the 0.8397 level.

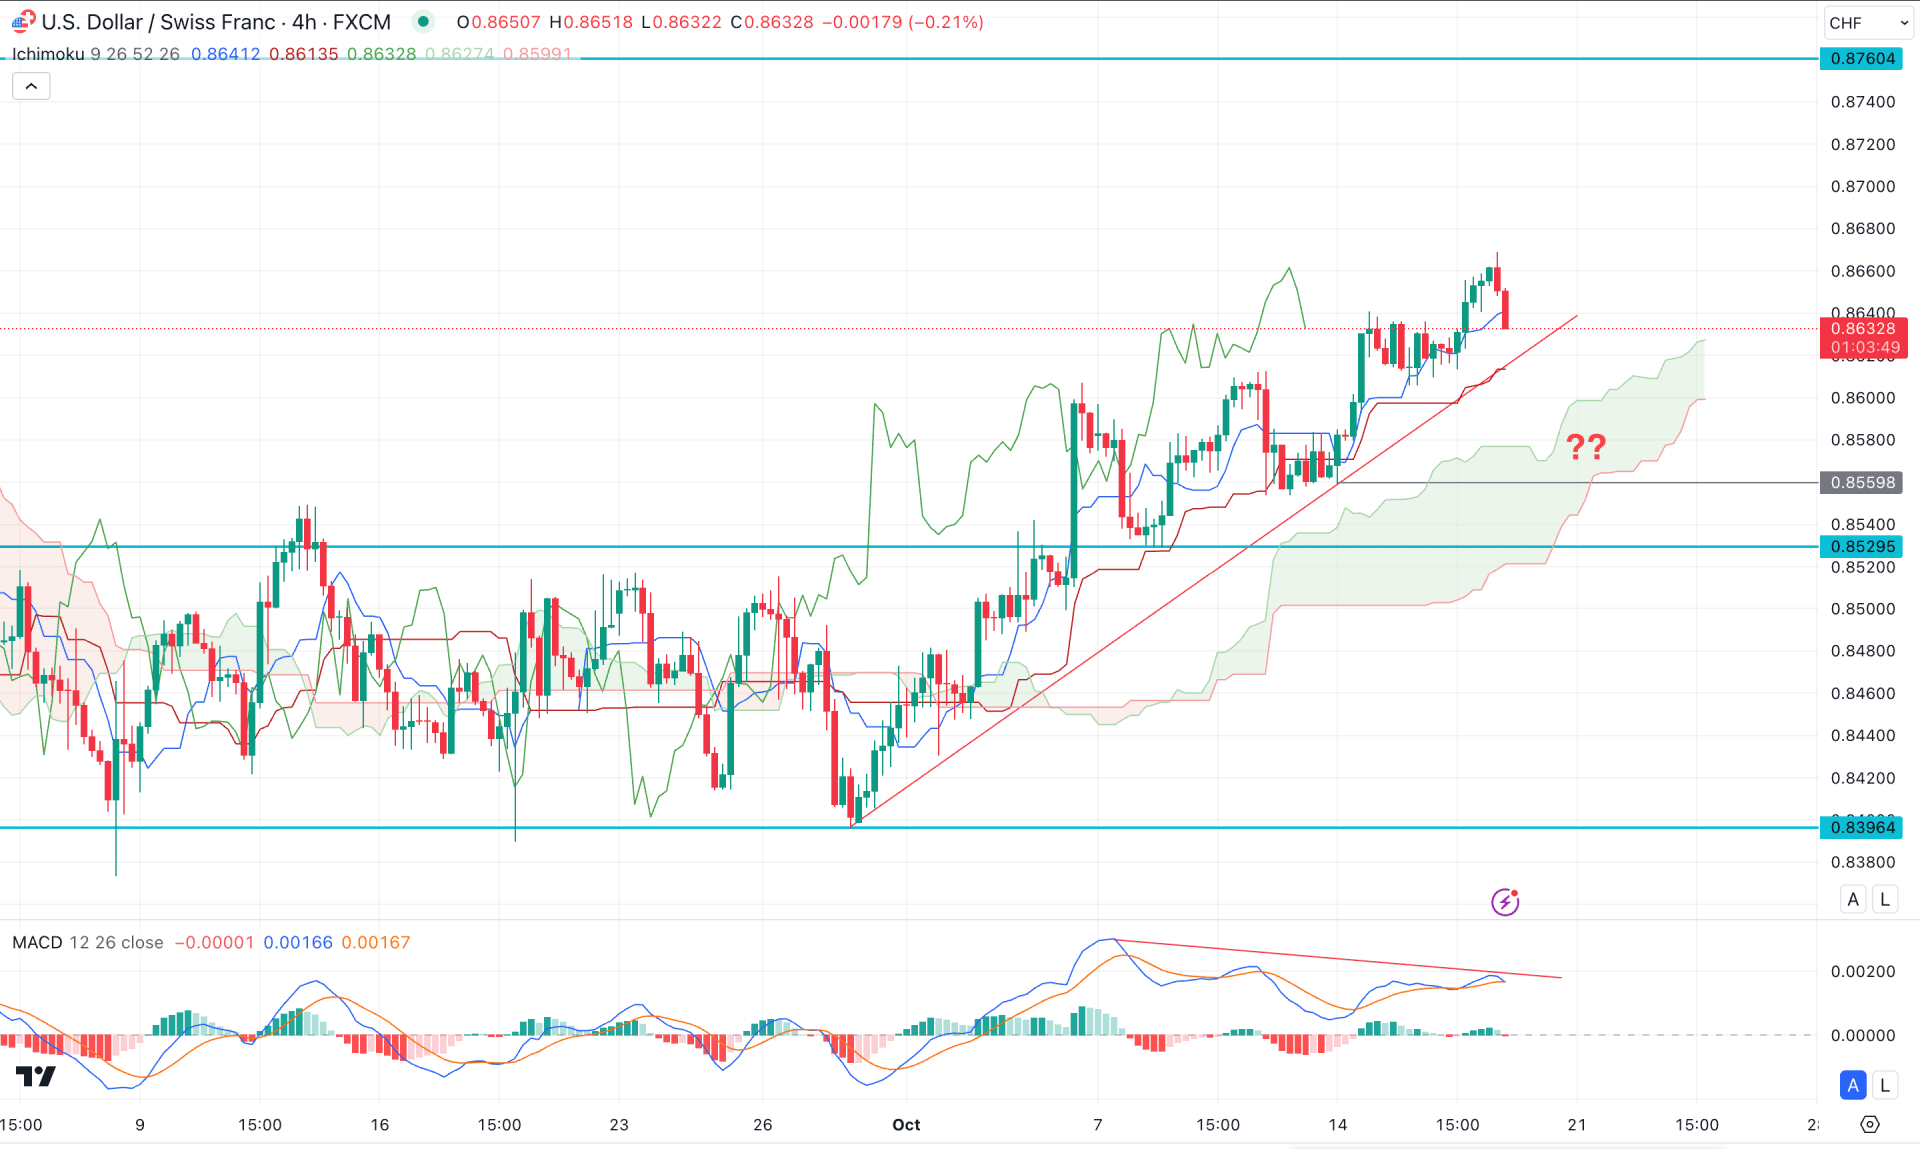
In the H4 timeframe, the ongoing buying pressure from the range breakout is visible, here the current price is hovering between the dynamic Tenkan Sen and Kijun Sen line.
The future cloud shows a steady bullish pressure as both Senkou lines are aimed higher. It is a sign of a potential bullish continuation from the cloud support.
On the other hand, the MACD Signal line shows a divergence with an ongoing trendline liquidity build. In that case, investors should closely monitor how the price reacts in this liquidity zone.
Based on the H4 outlook, a selling pressure with an immediate rebound from the 0.8580 to 0.8520 zone could open a long opportunity, aiming for the 0.8760 level.
On the other hand, a valid bearish trendline breakout with consolidation below the 0.8520 level could lower the price in the 0.8400 area.

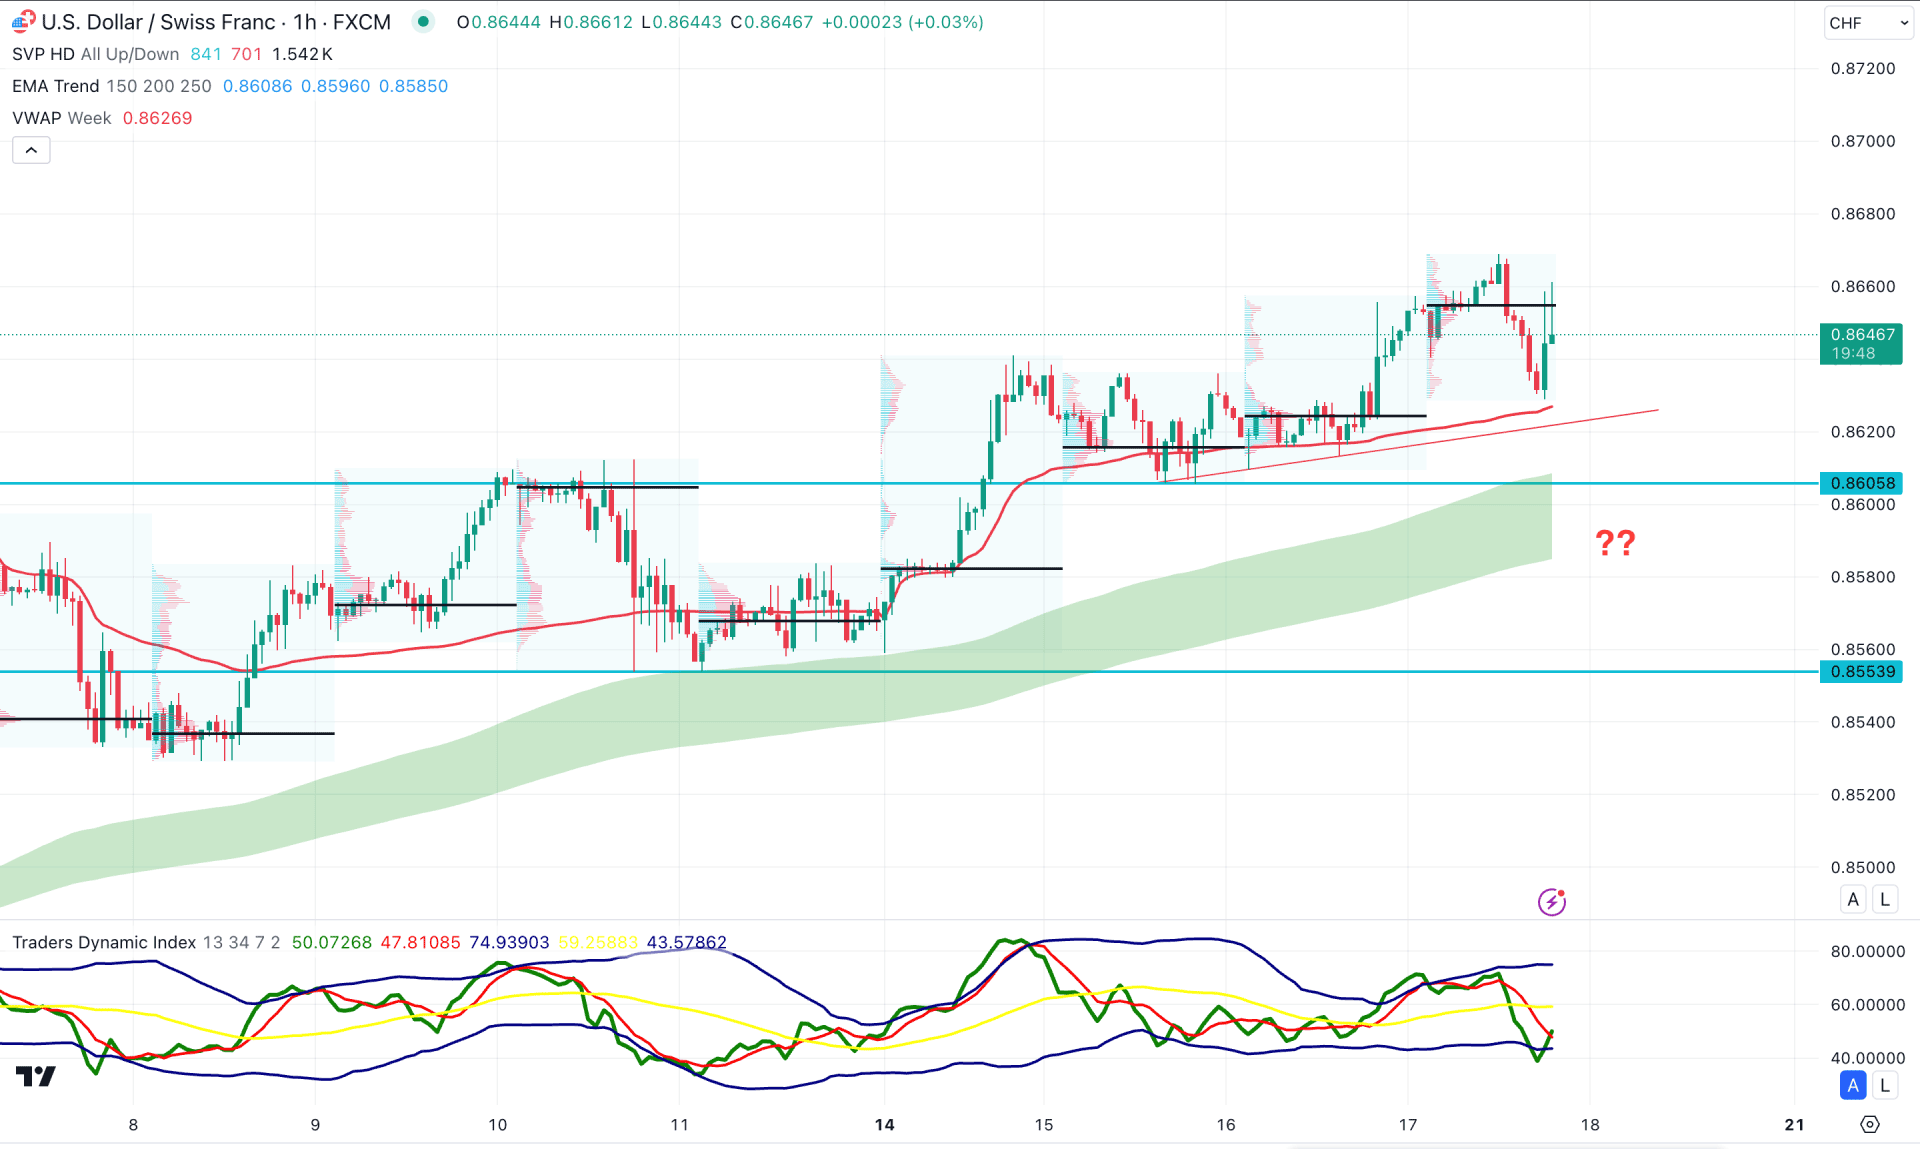
In the hourly chart, USDCHF is trading within volatile momentum, with a bullish market trend. An upward continuation is valid as long as the Moving Average wave remains below the current price.
In the indicator window, a valid bottom is visible as the TDI level reached the lowest point in the last 2 weeks. However, a rising trendline support could signal a presence of liquidity, which needs to be filled before forming a bull run.
Based on the hourly structure, a valid bullish rebound from the 0.8630 to 0.8600 area could be a long opportunity, aiming for the 0.8700 level.
The alternative approach is to find a bearish break below the cloud low with a hold for at least three sessions before heading for the 0.8553 level.
Based on the current multi-timeframe analysis, USDCHF is more likely to extend the buying pressure in the coming days. However, investors should monitor how the price reacts in the intraday chart as a sufficient downside correction is pending.