Published: November 26th, 2024
EURUSD corresponds to its daily damages after President-elect Donald Trump announced his intention to implement a 25% tariff on imports from Canada and Mexico and a 10% increase in taxes on all Chinese products entering the United States (US). Both currencies may continue to weaken due to weakened market sentiment.
The Federal Reserve (Fed) officials' remarks on Tuesday have kept the US dollar (USD) weak. Although the USD has limited downside risks, as evidenced by solid initial S&P Global United States Purchasing Managers' Index (PMI) data. These strong numbers suggest that the Fed may take a more measured approach to future rate cuts.
According to Austan Goolsbee, president of the Federal Reserve Bank of Chicago, the Fed will probably keep cutting interest rates to achieve a neutral position that neither promotes nor inhibits economic growth. As reported by Bloomberg, Minneapolis Fed President Neel Kashkari emphasized that it is still suitable to consider an additional rate reduction at the Fed's December conversation.
Growing worries about potential negative effects on the Eurozone economy are putting upward pressure on the euro. The ongoing conflict in Ukraine, political unrest in Germany and France, and the possibility of a second Trump administration are the main causes of these risks.
The European Central Bank's (ECB) December rate cut of 25 basis points (bps) has already been fully priced into the market. Furthermore, the probability of a more hostile 50 basis point rate cut has risen to 58%, indicating increased market skepticism about the region's economic prospects.
Let's see the upcoming price direction of this pair from the EURUSD technical analysis:

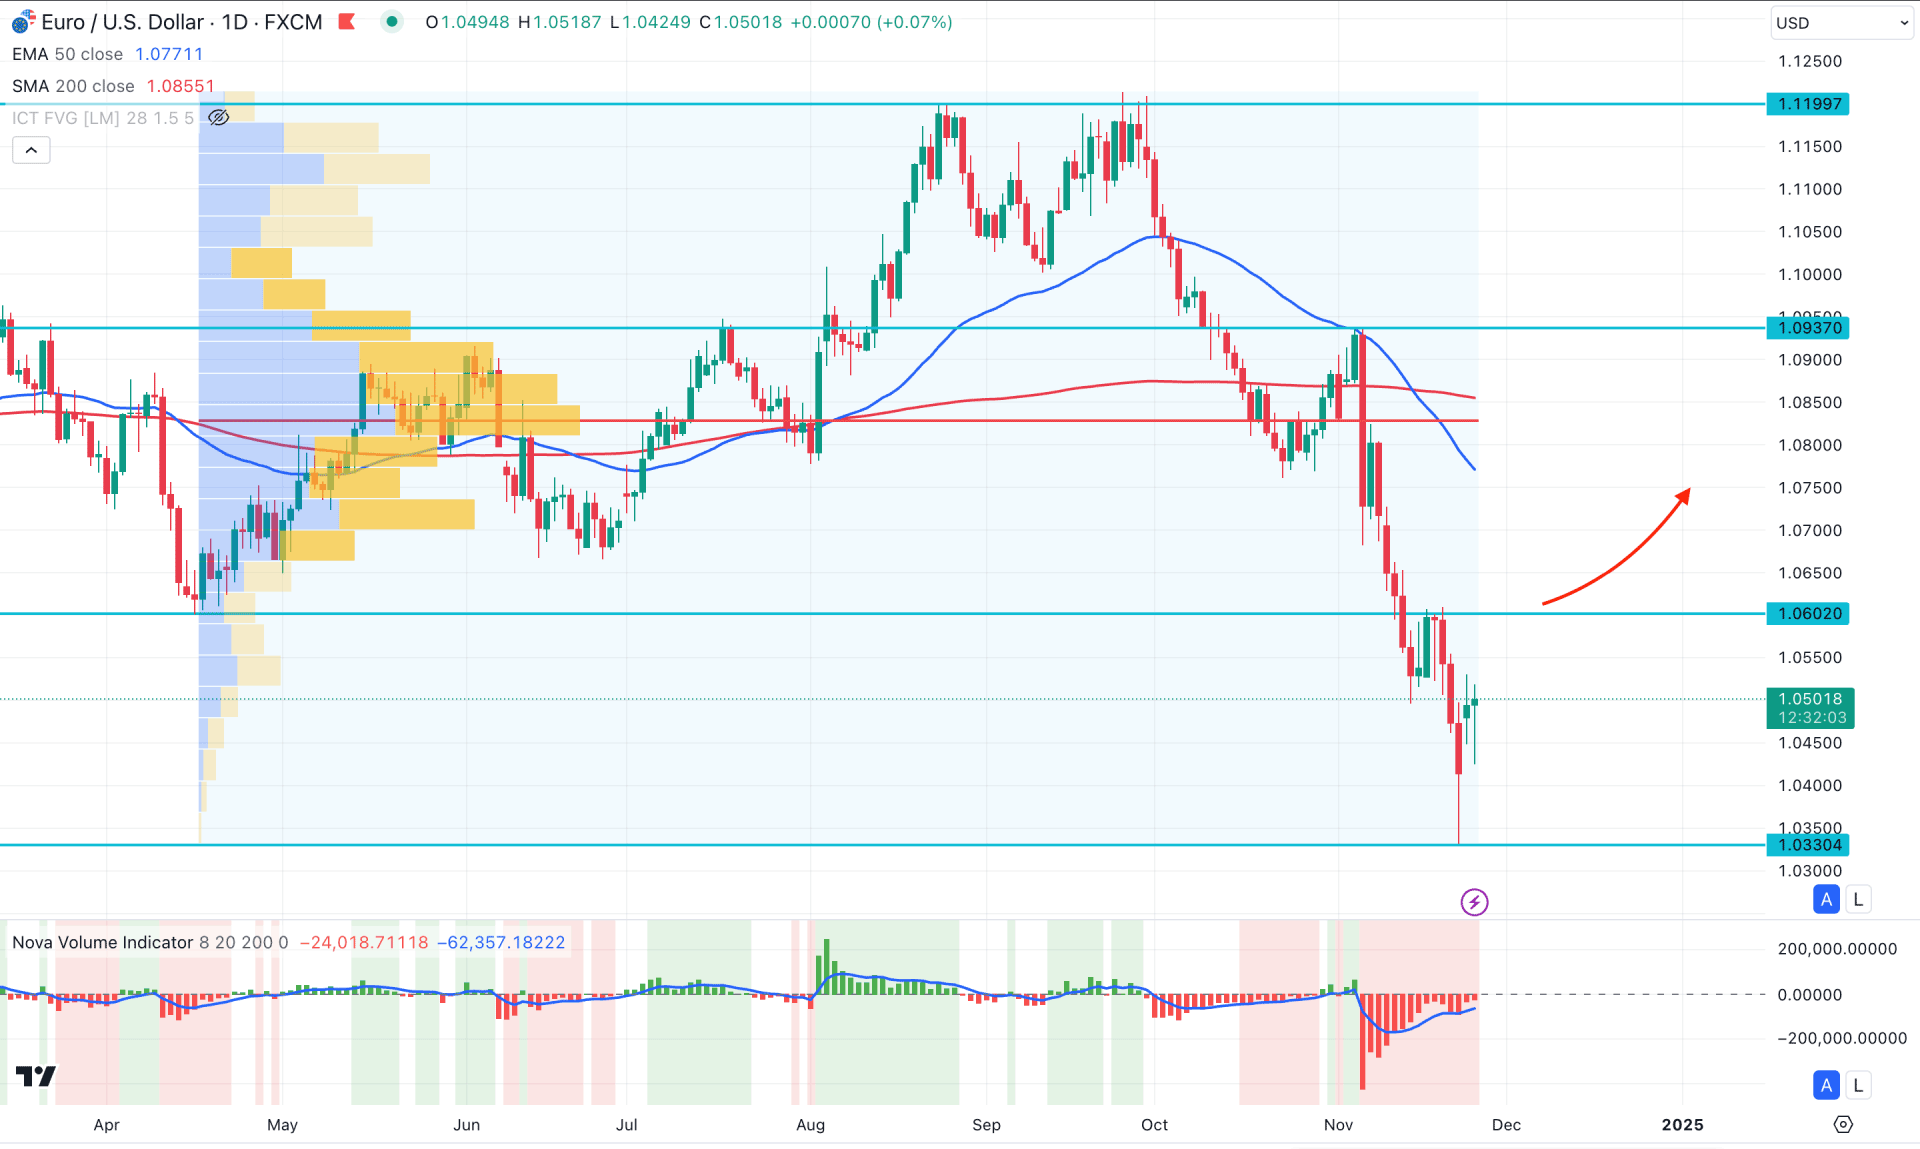
In the daily chart of EURUSD, the overall market momentum is bearish, where the current price hovers below the multi-week low. As the current price trades at a crucial low with bearish exhaustion, investors might expect a bullish correction before setting a stable trend.
In the higher timeframe, a strong bearish reversal is visible in October, taking the price toward the 1.5-year low. On the next candle, the price continued pushing lower, reaching a strong liquidity zone. As a new yearly low has formed, investors should monitor how the price reacts in this zone to find the future price direction.
In the main price chart, bearish exhaustion was seen below the previous yearly low, which signals a weaker selling pressure in the market. Moreover, the high volume line since April 2024 is at the 1.0827 level, which is way above the current price.
In dynamic lines, a mean reversion is pending as the 200-day SMA has become flat above the high volume line. Moreover, the 50-day EMA showed a bearish cross from the 200-day SMA, signaling a death cross. In that case, a bearish continuation might happen after having sufficient sellers attempt from the current resistance level.
Based on the daily market outlook of EURUSD, the volume Histogram shows a neutral momentum from the oversold zone. The latest Histogram is nearing the neutral point, from where a bullish flip could signal buy-side volume generation.
Considering the mean reversion, investors should monitor how the price trades at the 1.0602 level as a bullish break above this line could open a long opportunity. On the bullish side, the high volume line of 1.0820 level could be the primary target. Moreover, overcoming this level could find the 1.0937 and 1.1100 levels as major barriers before forming a long-term bull run.
On the bearish side, investors should find a range bound market below the 50 day EMA. A sufficient internal liquidity formation within the 1.0330 to 1.0770 zone could be the primary bearish signal, from where downside opportunity might come from the lower timeframe’s price action.

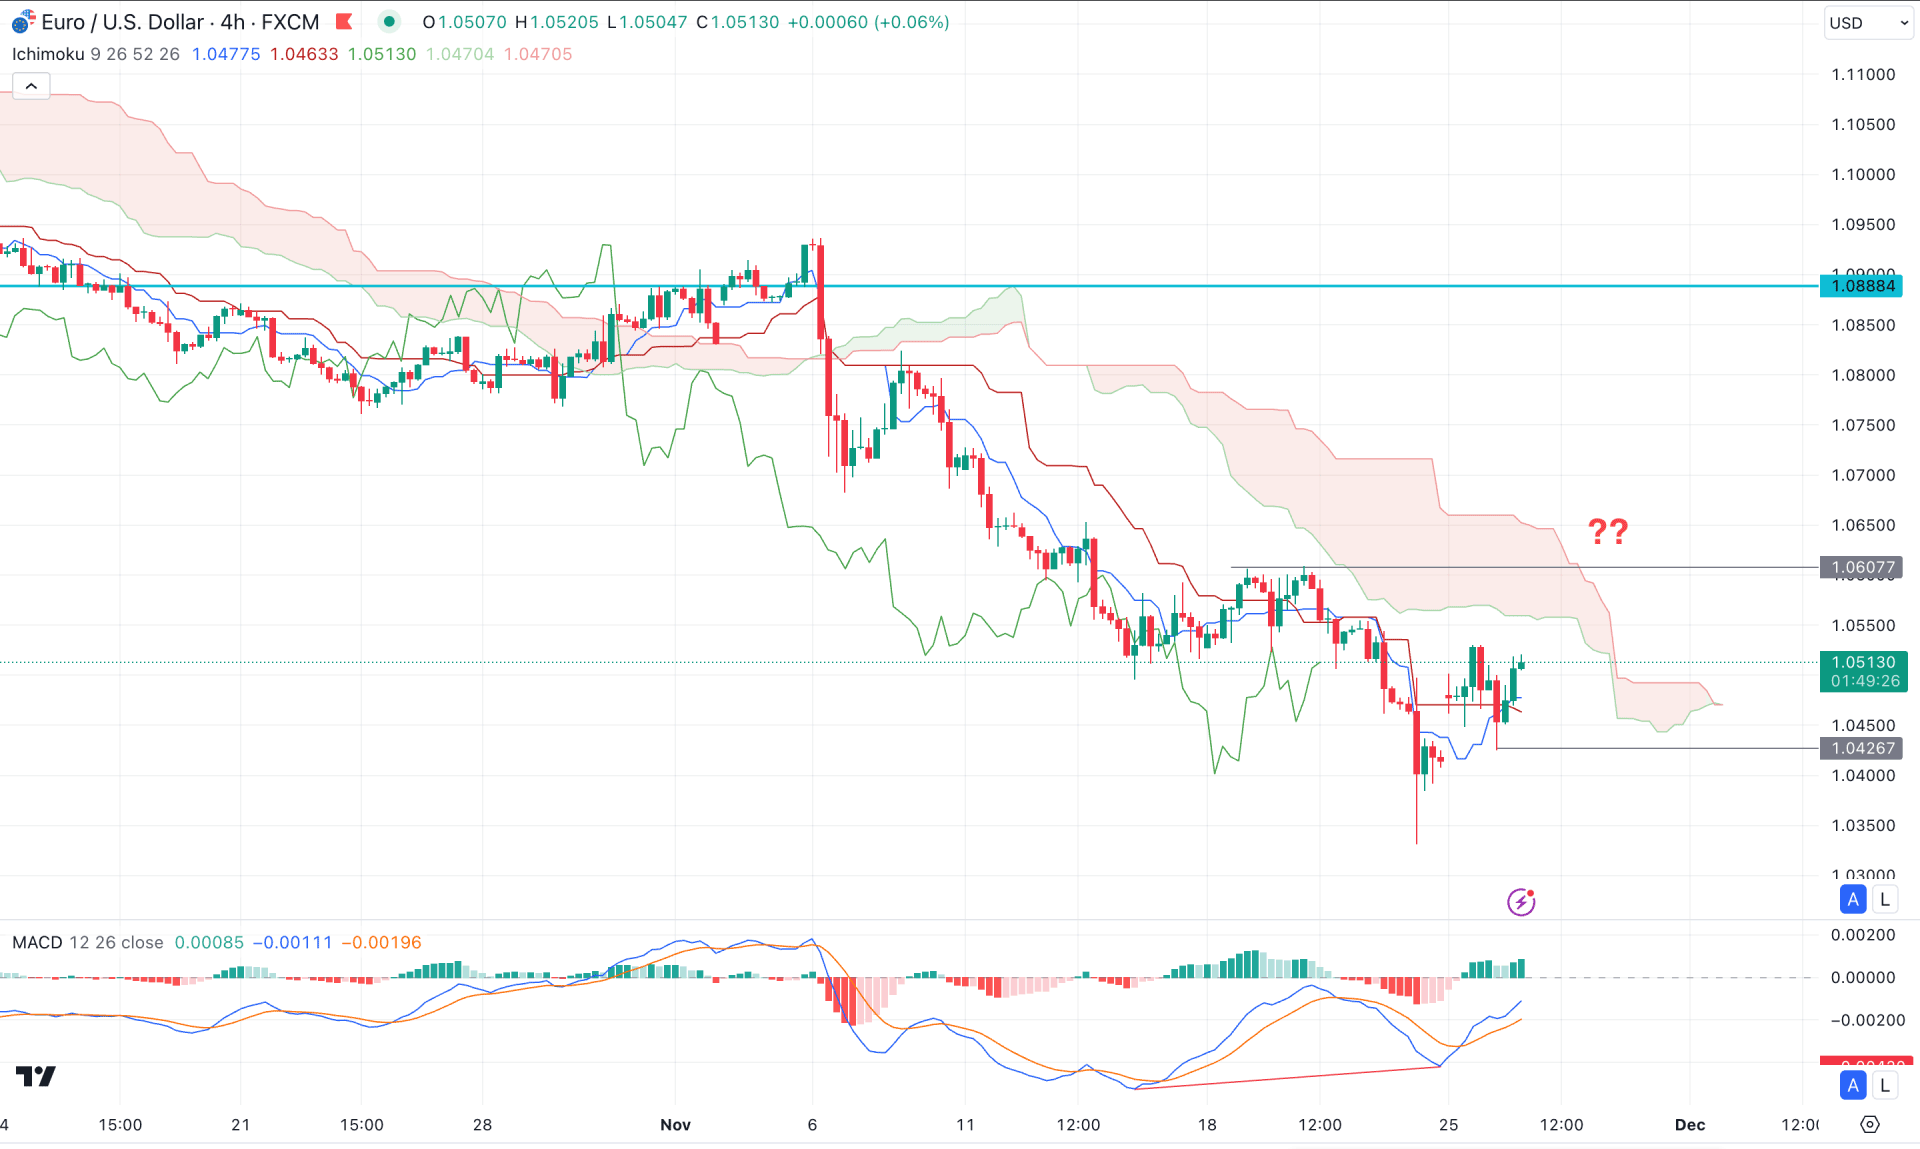
In the H4 timeframe, the recent price trades below the Ichimoku Cloud level, suggesting a stable bearish pressure. However, bearish exhaustion formed this week, from which the price almost recovered the inefficiency.
In the main chart, the Senkou Span A reached the Senkou Span B level in the Futures Cloud, while a bullish crossover is present in the Kijun Sen.
A potential divergence is also visible with the MACD indicator, where the MACD EMA failed to form the low following the price trend.
Based on this outlook, any bullish recovery with a stable H4 candle above the 1.0607 level could validate the trend reversal. In that case, the price might increase the upward pressure and find resistance at the 1.0888 level.
On the bearish side, a rebound below the Kijun Sen level might resume the existing trend toward the 1.0300 level.

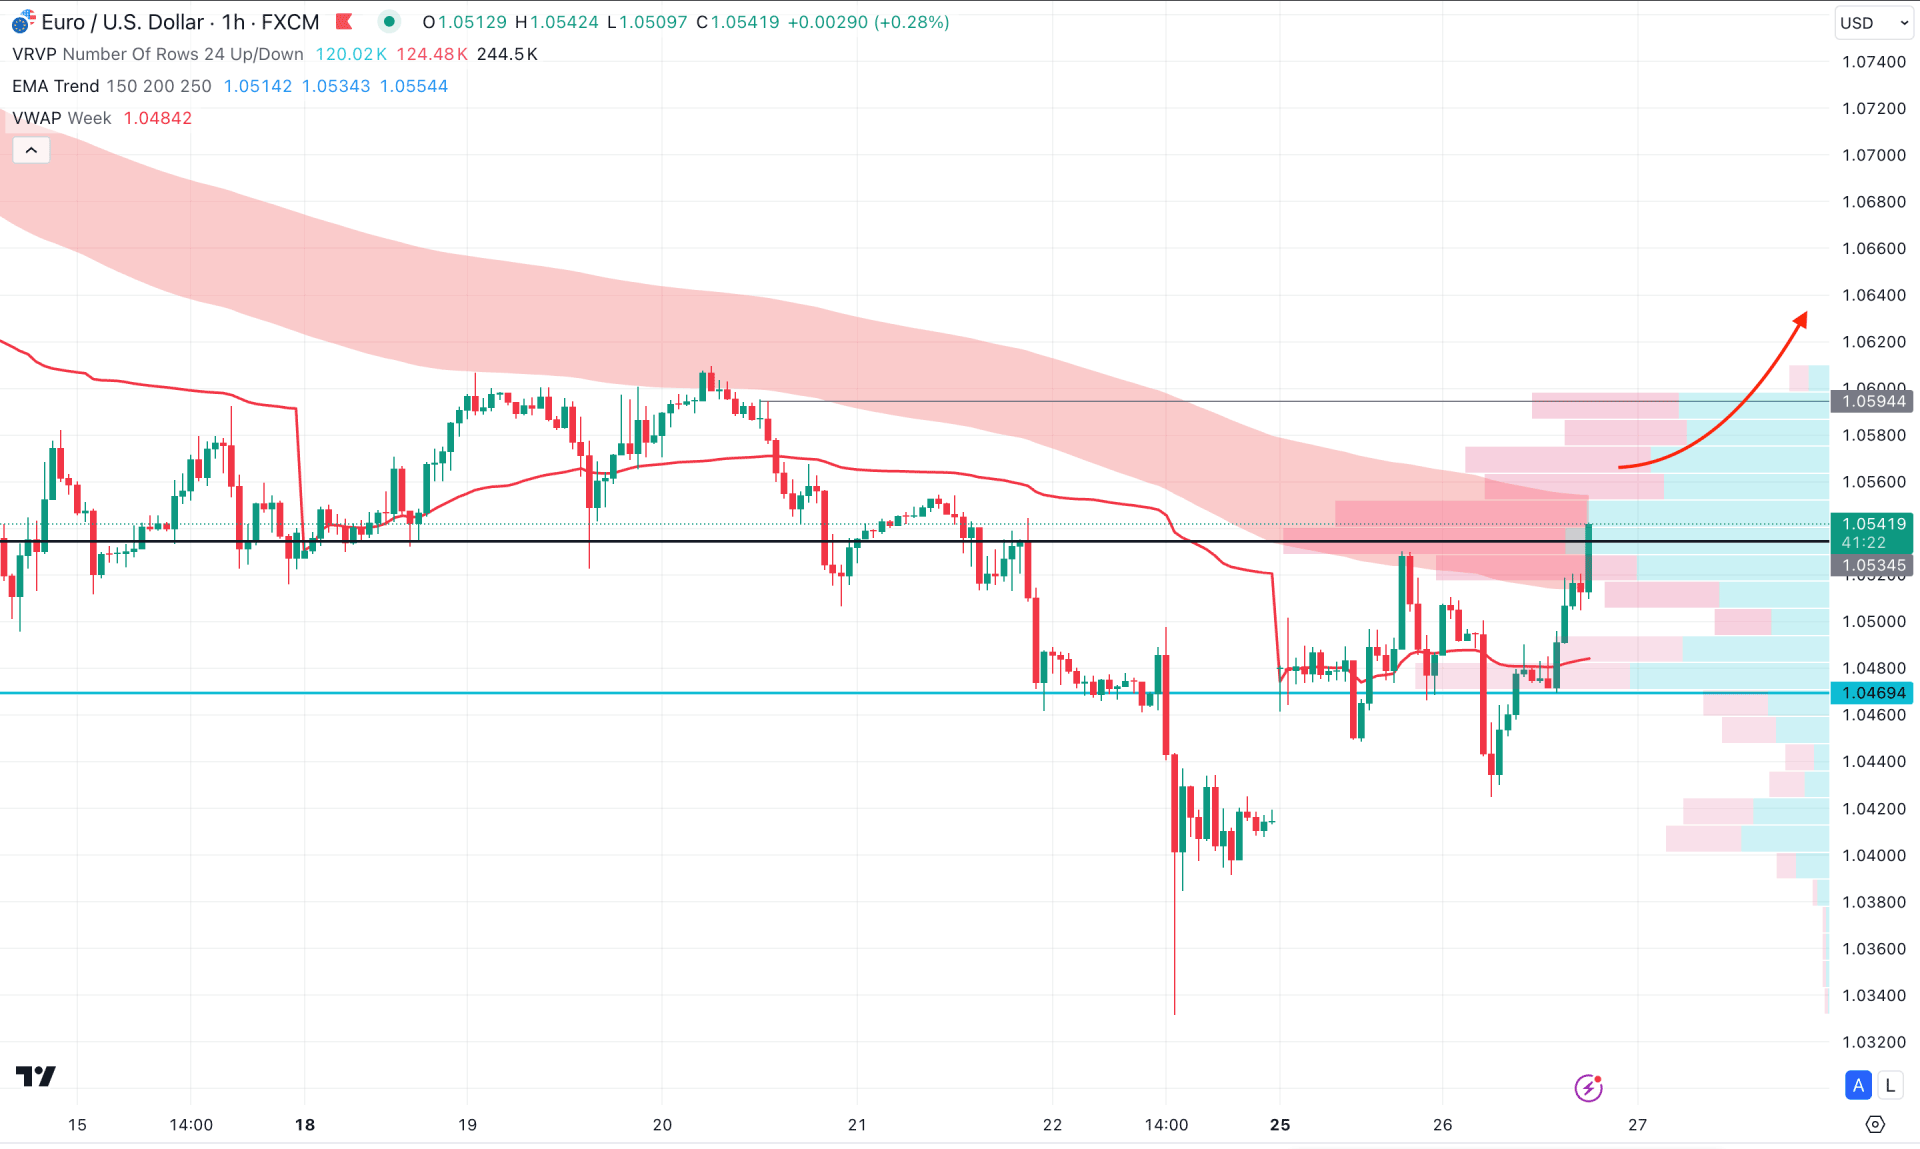
In the hourly time frame, the EURUSD is trading with a bullish counter-impulsive momentum, where the current price is facing a resistance from the Moving Average wave.
The Moving Average weave signals the resistance zone from the MA 150 to 250. Therefore, overcoming this zone could be a strong milestone for EURUSD bulls. Moreover, the early buy signal is present as the price moves above the weekly VWAP line with bullish momentum.
The visible range high volume line from the current tradable range is also below the current price and working as a primary support.
Based on the hourly outlook of EURUSD, any immediate bearish recovery with an hourly candle below the 1.0469 level could signal a high probable bearish opportunity, aiming for the 1.0300 level.
On the other hand, consolidation above the 1.0500 to 1.0560 zone could signal a bullish continuation aiming for the 1.1000 area.
The EURUSD is trading below the crucial yearly low, followed by a strong range-bound market. In that case, any recovery with a rebound within the range could signal a sell-side liquidity sweep. However, the intraday price is still bullish, from where a bullish breakout from the near-term resistance could signal a market reversal.