
Published: June 25th, 2026
The Euro (EUR) continued its downward trend against the USD for the fourth day in a row. The pair has recovered from Wednesday's 13-month low but failed to sustain the gain.
German consumers' perceptions of the nation's economic activity increased slightly from June's -29.7 to July's -29.2, up from the previously projected -29.8. However, the reading did not meet market projections of -27.5.
Although consumer mood has stabilised over the past few months, it is still lower than it was before the commencement of the Middle East crisis, according to the Nuremberg Institute for Market Choices (NIM). According to the NIM, readiness to buy is still low and most consumers still anticipate that the economy will deteriorate over the next 12 months.
Conversely, growing wagers that the Fed would raise interest rates in the second part of the year are supporting the US dollar. The Core PCE came in line at 0.3%, which reduced some loss for the Euro.
Let's see the complete price projection from the EURUSD analysis:
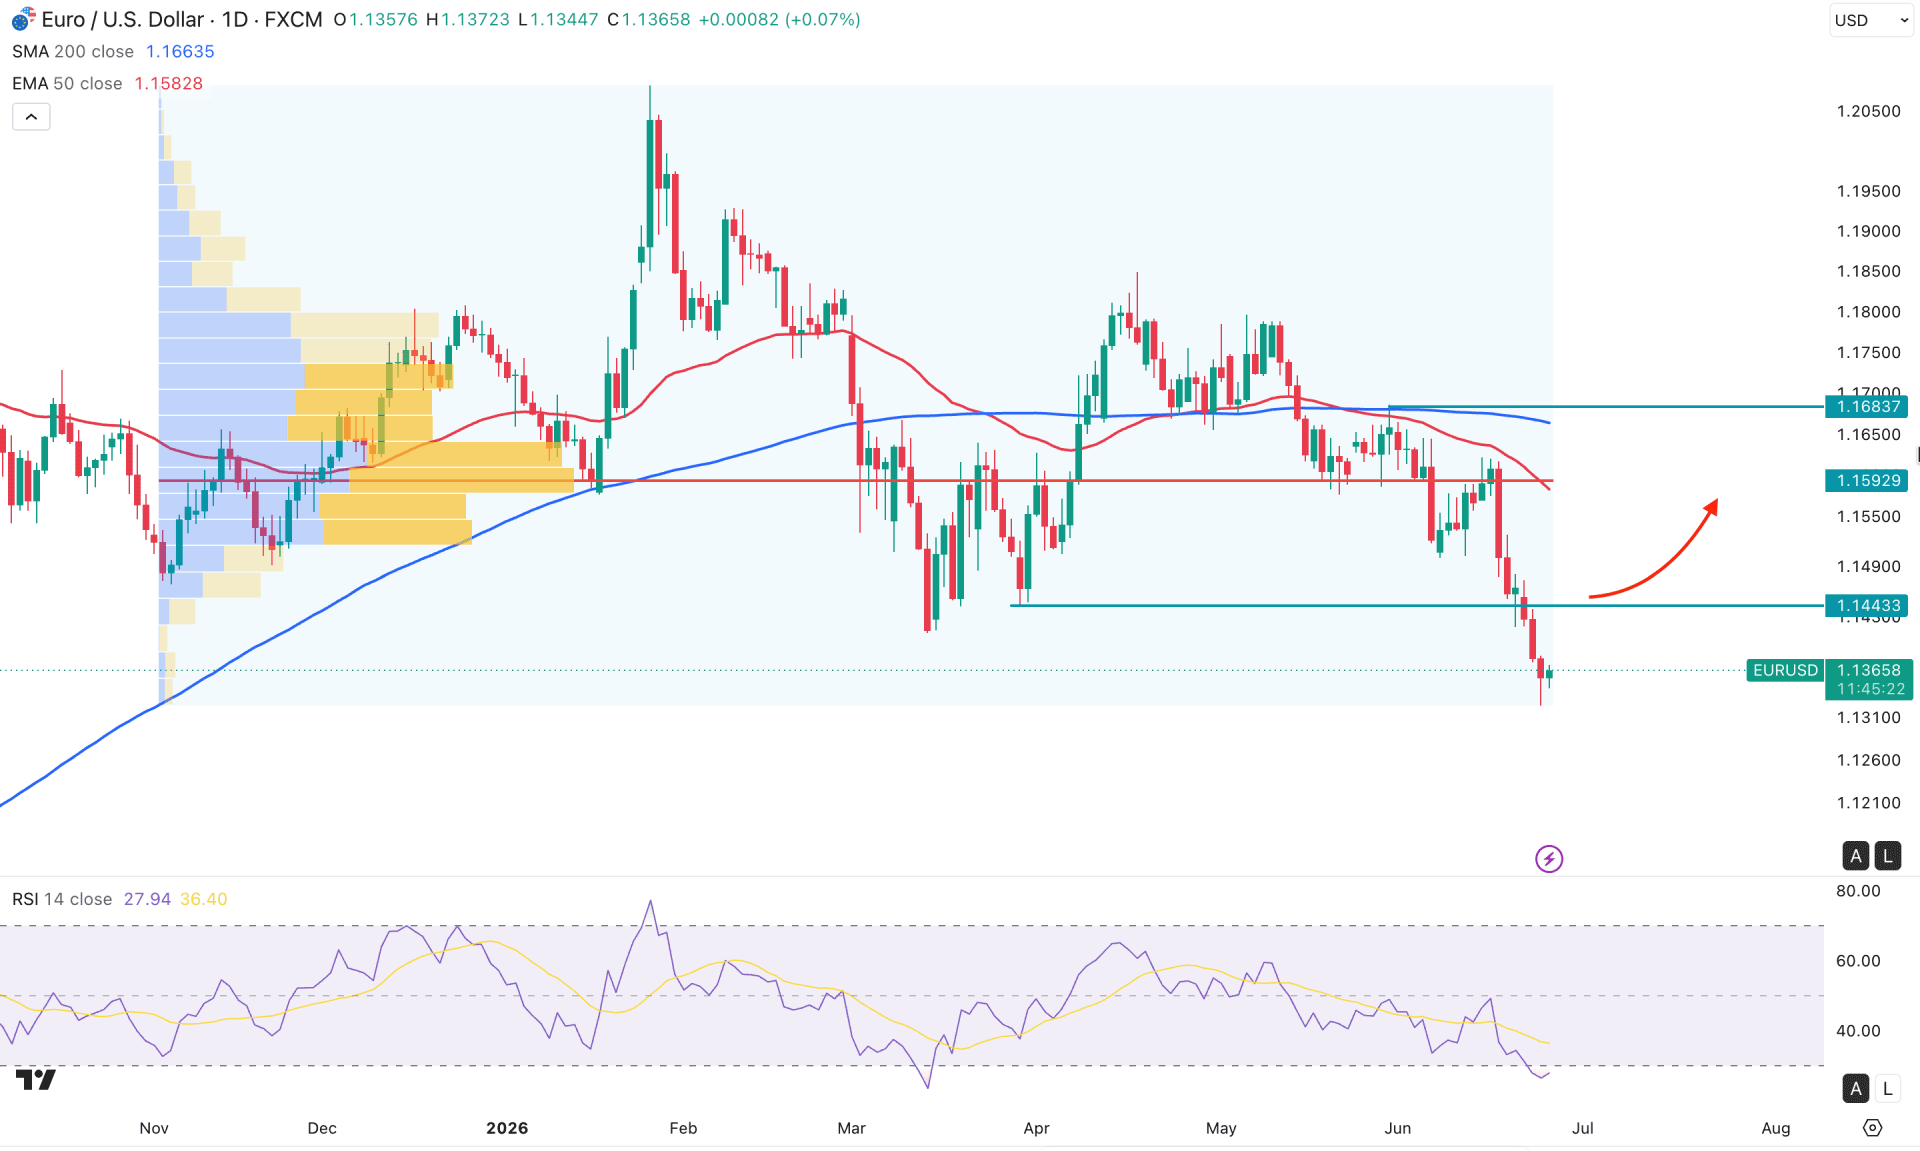
In the daily chart of EURUSD, the recent price shows an extensive bearish continuation, followed by a possible ABCD correction. The most recent price is trading within a corrective bullish wave, which signals strong selling pressure in the market. However, a significant low is achieved below the March 2026 low that can attract buyers into the market.
In the monthly timeframe, a strong break is visible from a decent range-bound market at the top, signaling a possible bearish continuation. However, the weekly timeframe is still in the buyers' area, even if a new low is achieved in 2026. Further signals are needed before forming a long-term bearish trend.
In terms of volume, sellers are dominating the market, as the largest activity level since November 2025 is above the current price, from where an impulsive wave is clear.
In the main price chart, the Death Cross formation is visible, where the 50-day EMA is having a bearish crossover with the 200-day SMA.
Moreover, the 50-day EMA has a bearish slope in line with the high volume resistance at the 1.1592 level, which is a strong sellers' zone.
Primarily, both dynamic lines and static high-volume resistance levels are above the current price, which signals a valid bearish continuation opportunity. However, the relative strength index has reached the oversold area, signaling extreme selling activity in the market. Although no bottom formation is valid, the primary aim for the RSI reading is 28 for a decent bullish correction.
Based on the current market structure, EURUSD is trading at the yearly low price, from where a sufficient bullish rebound is possible. A sudden recovery above the 1.1443 level with a bullish daily candle close could increase the possibility of testing the 1.1592 resistance level.
Moreover, overcoming the 50-day EMA could be another achievement for buyers before following long-term bullish strength towards the 1.2100 area.
The alternative trading approach is to wait for a decent bullish rebound and form selling pressure at the 1.1443 area to 1.1592 area. A valid bearish rejection from the 50-day EMA could increase the possibility of creating a new swing low and possibly retest the 1.1000 key support level.
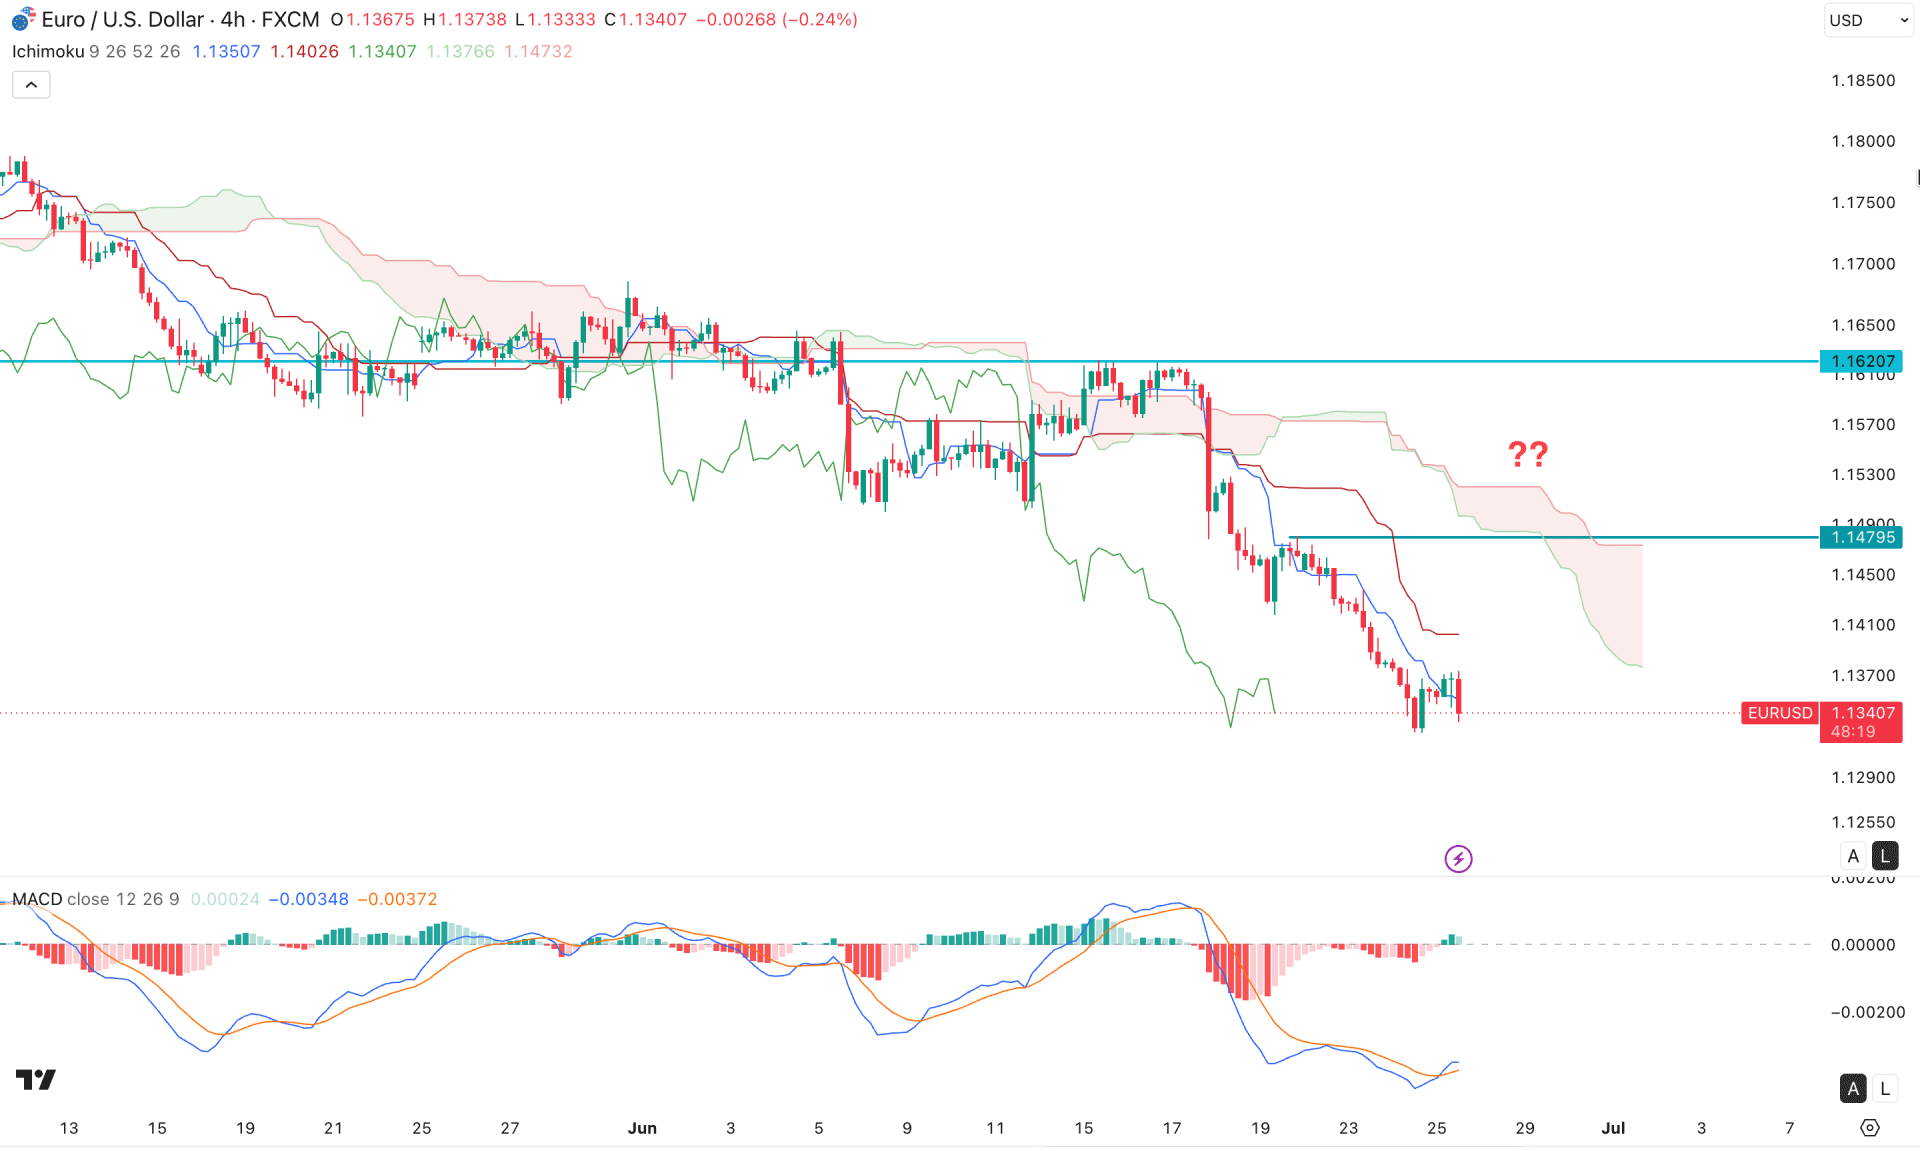
In the four-hour timeframe, the price is trading within an impulsive bearish pressure. The price keeps moving lower in the Ichimoku cloud area, where the future cloud is solid for bearish continuation.
On the other hand, the MACD indicator shows a different story, where the signal line is forming a bullish crossover at the bottom. The histogram is still around the neutral area, signaling indecision.
Based on this market structure, any recovery below the dynamic area signals ongoing bearish continuation. In that case, the price is likely to create a new swing low and test the 1.1270 area. On the other hand, the current price is near a crucial low from a higher timeframe where a moderate bullish move is possible.
However, the bearish structure is intact as long as the price remains below the 1.1479 swing high. Breaking above this level could eliminate the entire structure and increase the possibility of testing the 1.1620 resistance level.
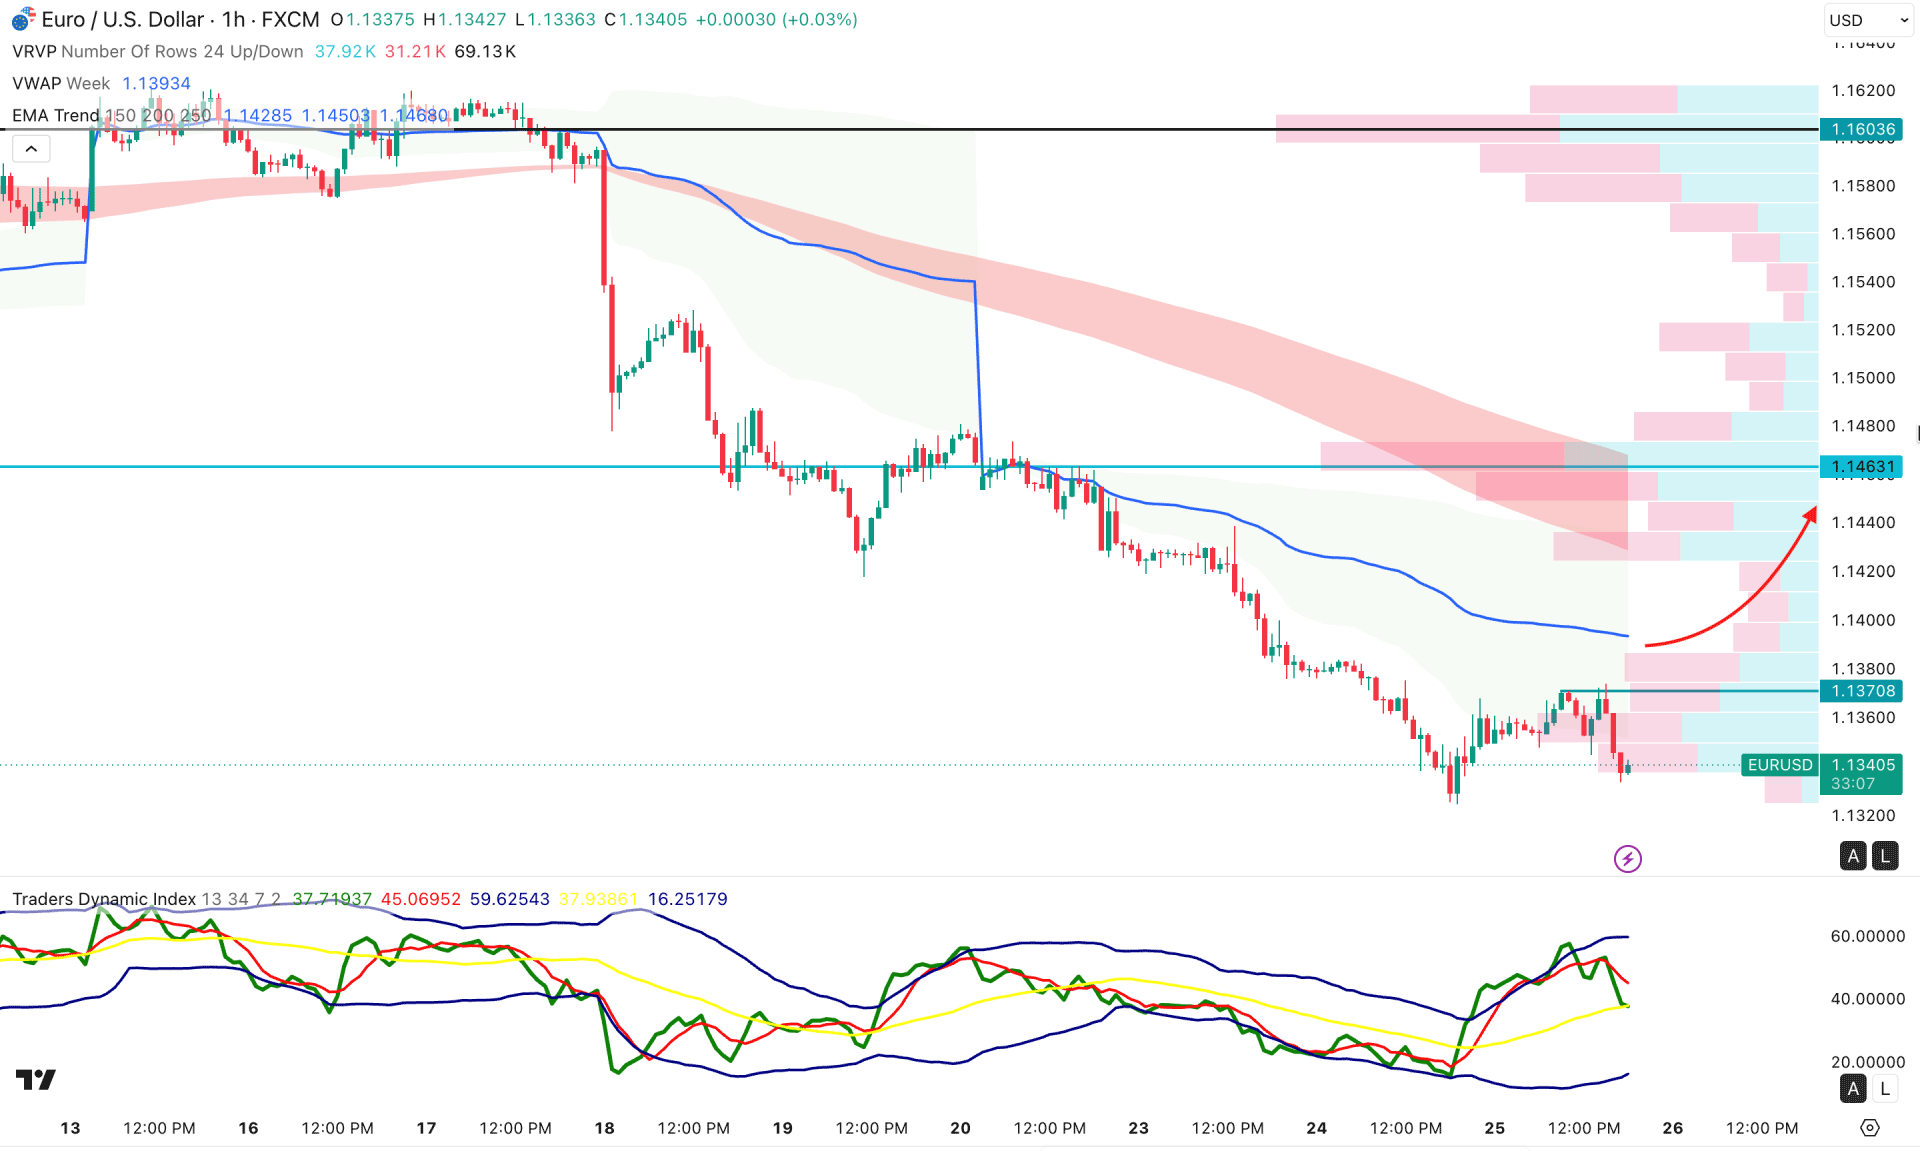
The hourly chart is also showing an ongoing bearish correction, where the current price is lower after forming a minor recovery. The weekly VWAP line is above the current price,, followed by a bearish traction in the EMA wave. However, the higher timeframe level is far above the current price, signaling potential bullish recovery.
The Traders Dynamic Index is having a downward trend after reaching the upper area, but the entire structure is still above the 50.00 level.
Based on the hourly structure, investors should closely monitor how the price trades below the 1.1370 swing high. A valid break above this level could increase the possibility of testing the 1.1461 resistance level before heading toward the 1.1600 area.
On the other hand, any failure to overcome the 1.1370 level could be a bearish event that can create a new swing low below the 1.1300 area.
Based on the overall market, EURUSD is trading within a bearish trend where the current price is at the yearly low area. Although the internal structure is bearish, a decent bullish correction is still pending. In that case, any sign of a downside liquidity sweep on the intraday chart could be a short-term long opportunity. However, a valid bullish recovery could come with confirmation in the daily chart.


