Published: September 12th, 2024
The European Central Bank (ECB) cut interest rates by 25 bps in total in light of the Eurozone's slowing inflation. Statistics demonstrating how the German Consumer Price Index (CP) reached the ECB's 2% objective in August and dropped to its lowest point in more than three years validated the bets. In light of the moderate strength of the US dollar (USD), this weakens the common currency and works as a tailwind for the EURUSD pair.
According to the US CPI report, which was made public on Wednesday, consumer prices are declining in the US in general. However, the core CPI cast doubt on expectations for a bigger rate decrease by the Federal Reserve (Fed) the following week, indicating that inflation at its core is still sticky. An increase in the yield on US Treasury bonds supports this and pushes the USD Index (DXY), which measures the US dollar over an array of currencies, toward the monthly peak.
Nevertheless, the markets have completely priced in the likelihood of a 25 bps percentage drop at the conclusion of the FOMC meeting on September 17–18 and the impending beginning of the Fed's policy loosening cycle. This limits any further strengthening of the safe-haven Greenback despite the market's positive sentiment. This calls for prudence for bullish traders and should provide some cushion for the EURUSD pair as it approaches the critical central bank event threat.
Let's see the further aspect of this pair from the EURUSD technical analysis:

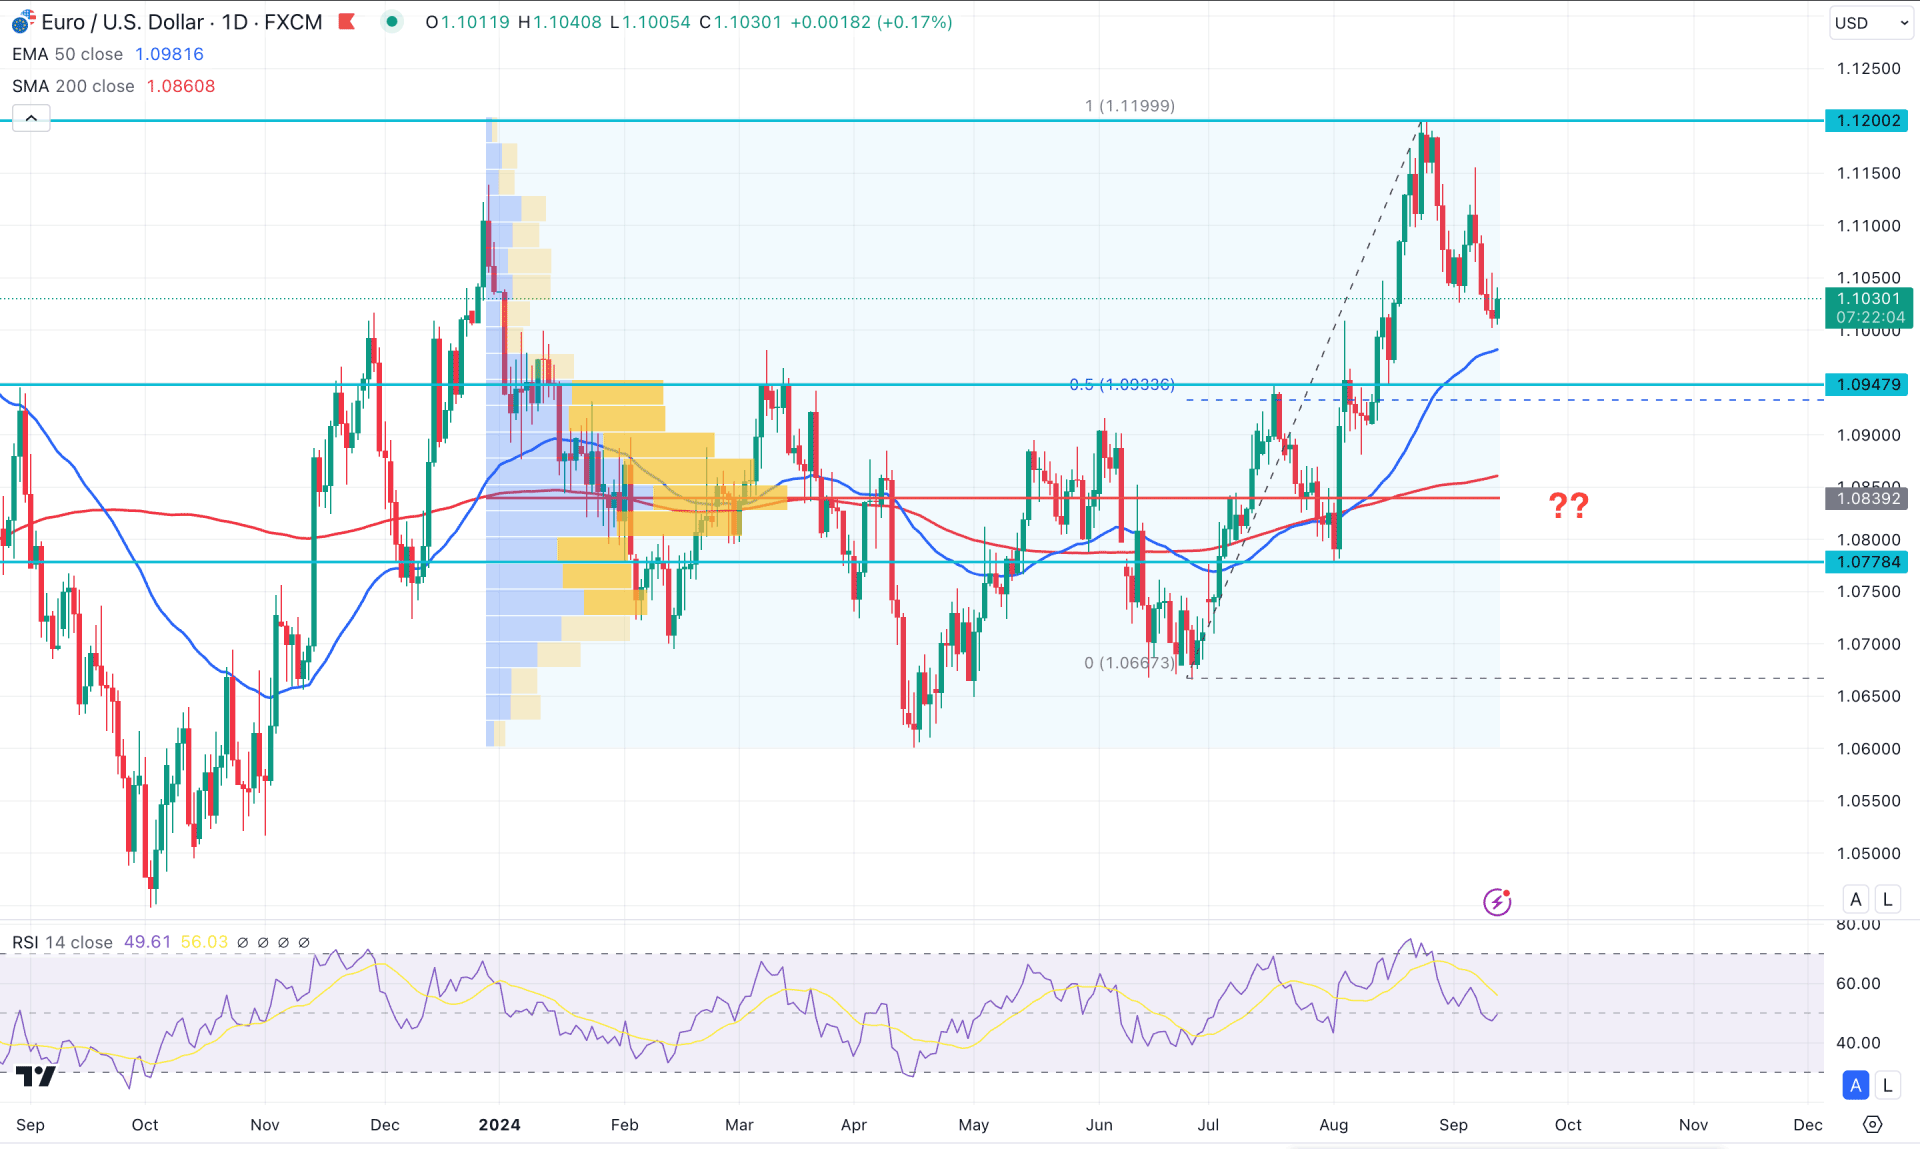
In the daily chart of EURUSD, the EURUSD has passed volatile trading days since the beginning of 2024. A strong consolidation phase ended in July 2024 with a valid bullish breakout. As the price aims higher and reaches a new yearly high, upward continuation is likely in the coming days.
In the broader context, the weekly price trades with a bearish two-bar reversal at the premium zone, while the current monthly candlestick shows a strong bullish close. It is a sign that the long-term market momentum is bullish, which can resume after finding a suitable profit-taking.
In the volume structure, the largest activity level since December 2023 is 1.0839, which is 1.81% below the current price. As the ongoing upward pressure is above the high volume line, we may expect institutional investors to support the buying momentum. In that case, a minor downside correction might appear, but the bullish possibility is valid as long as the high volume line remains below the current price.
In the main chart, the 50 day Exponential Moving Average is the immediate support level, suggesting a bullish continuation. Moreover, the 200 day Simple Moving Average is the major support, remaining with a bullish slope at the high volume line.
Based on the daily market outlook, the price has a higher possibility of showing a bearish correction and move below the 1.0947 static support level. In that case, 1.0940 to 1.0839 zone would be a bullish zone, aiming for the 1.1200 level.
The alternative trading approach is to look for an immediate selling pressure from the 1.1000 zone, which could increase the downside possibility towards the 1.0850 level.

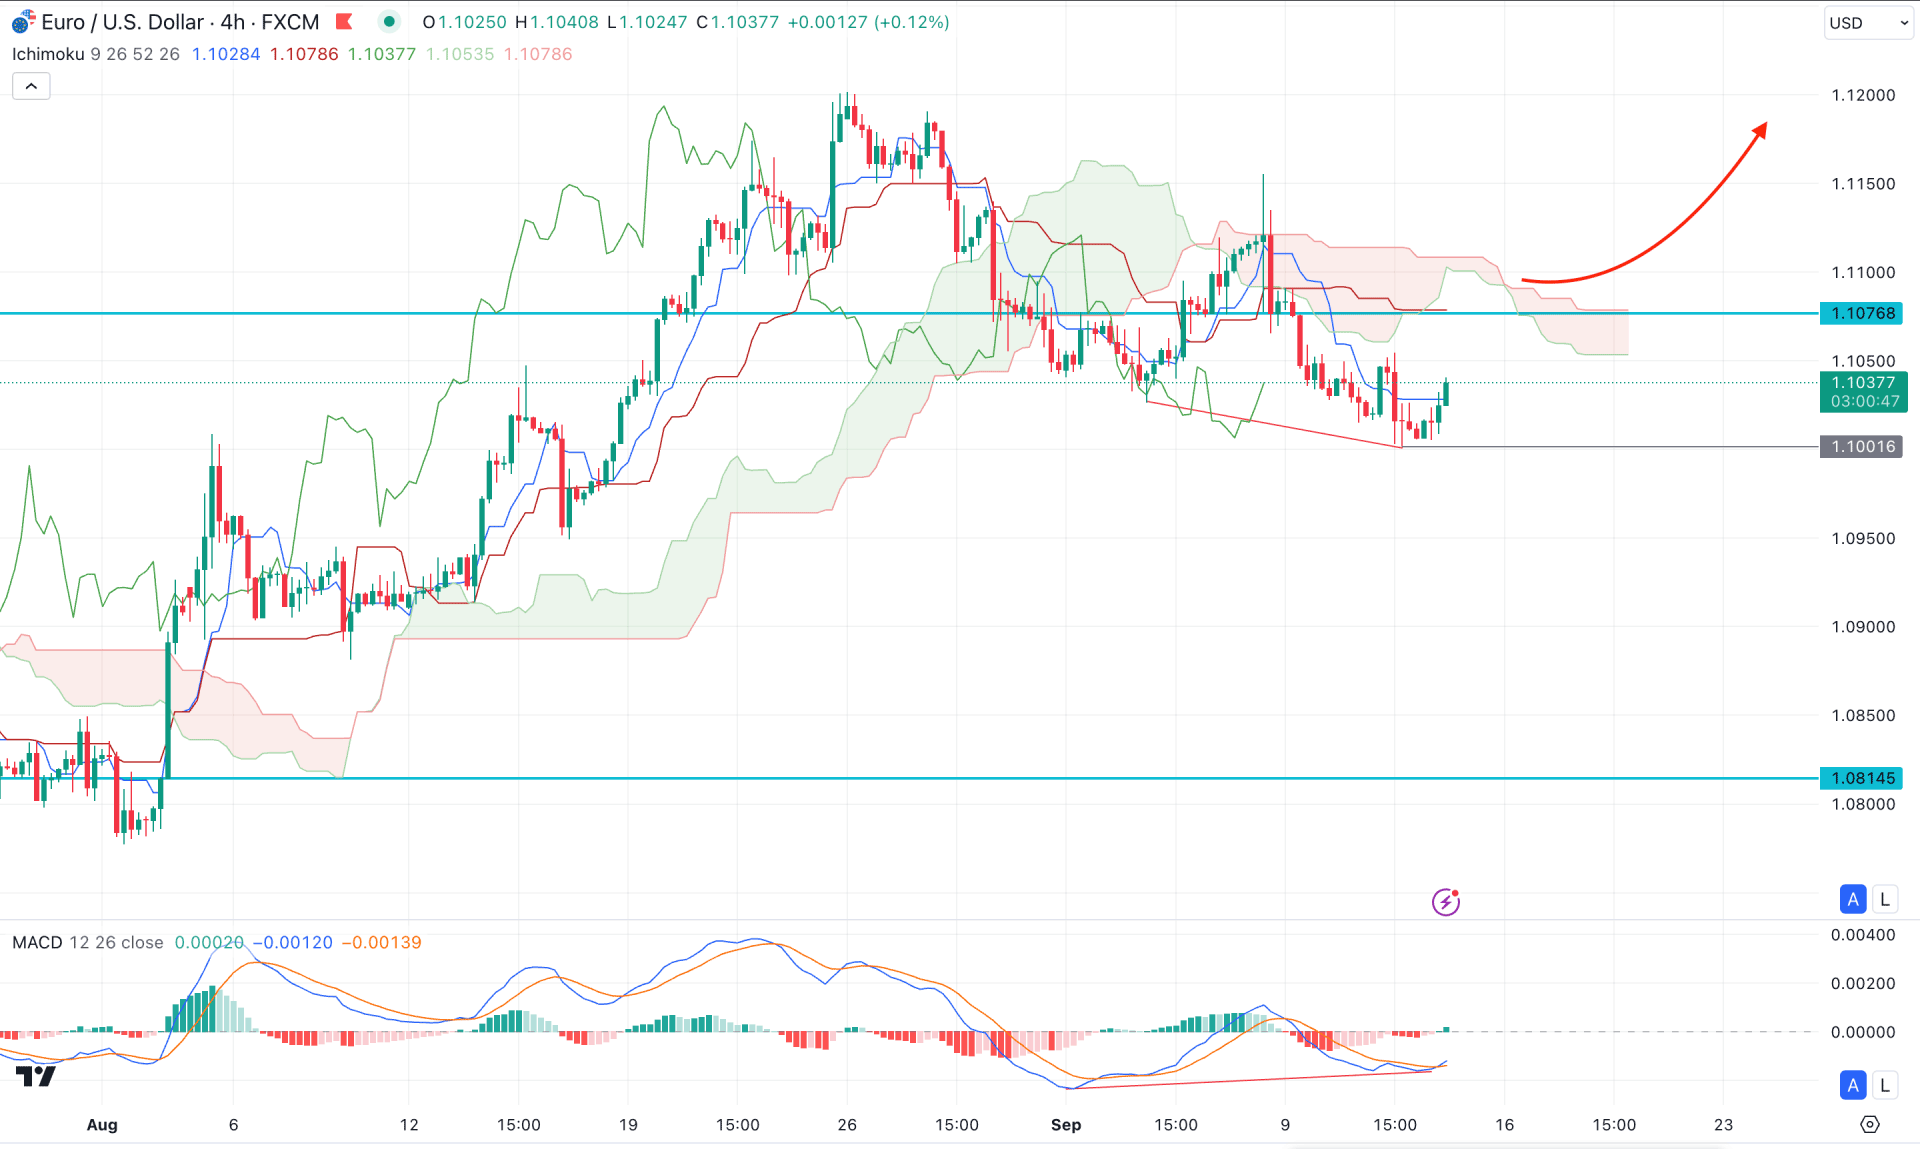
In the H4 structure, the recent price trades below the Ichimoku Kumo Cloud with a corrective pressure. It is a sign that a bearish momentum is visible, with no evidence of strong selling pressure.
In the futures cloud, the Senkou Span A and Senkou Span B remain flat, suggesting a neutral momentum, while the Kijun Sen is flat below the current price.
Based on the H4 structure, the MACD signal line shows a strong divergence, which might work as a strong bullish signal in this pair. Following the major trend, a bullish break with a daily close above the 1.1076 level could activate the bullish continuation, aiming for the 1.1000 level.
On the other hand, if the price does not hold above the Kijun Sen, the existing bearish trend might resume, with an aim at the 1.00900 level.

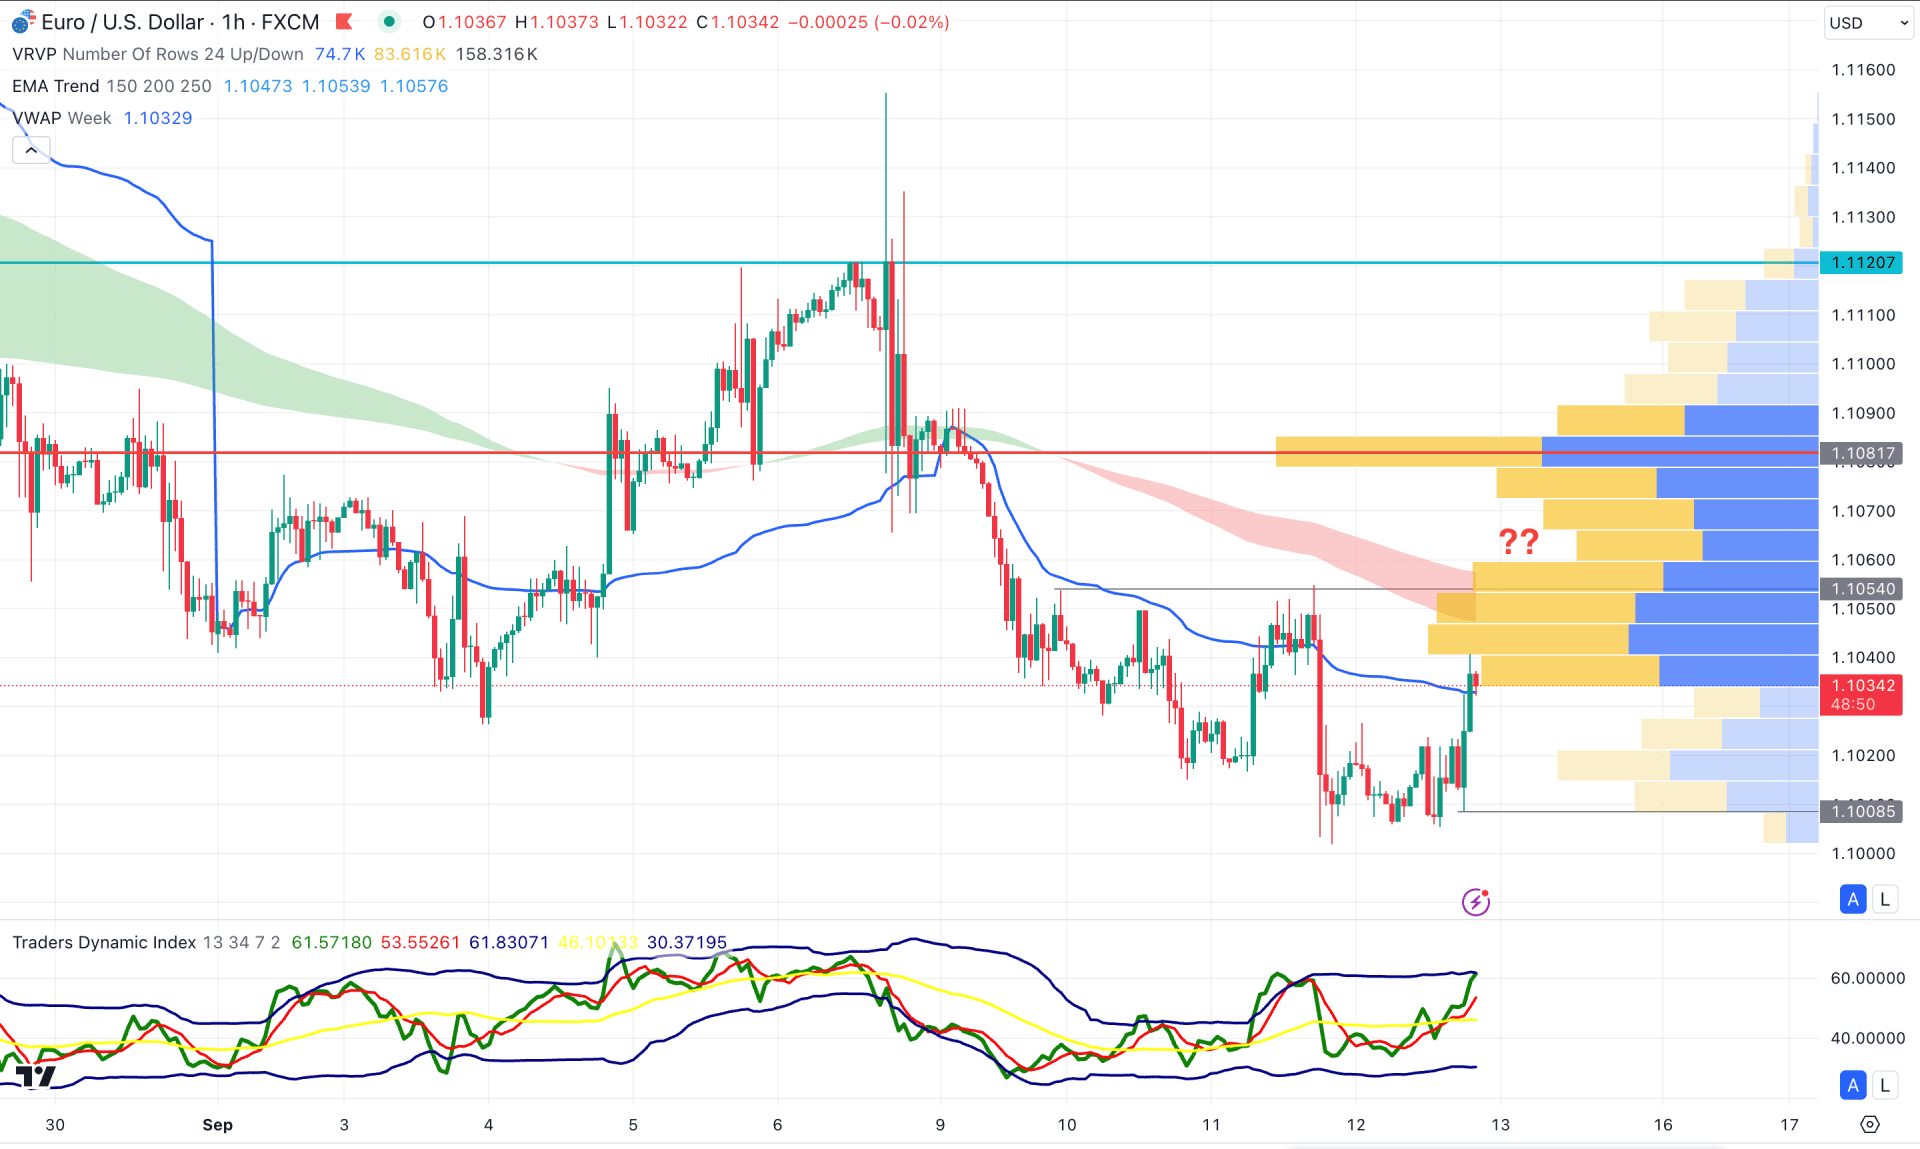
In the hourly chart, the visible range high volume line is above the current price, while the weekly VWAP is working as an immediate resistance. Moreover, the selling pressure is supported by the strong bearish slope in the MA wave.
Based on this structure, a minor upward correction is pending, which might extend the momentum at the MA wave area. In that case, a valid bearish reversal from the 1.1054 to 1.1086 area could b a bearish opportunity, aiming for the 1.1000 level. However, a bullish break above the high volume line might resume the long-term bullish trend above the 1.1200 area.
Based on the current market outlook, EURUSD is trading in a critical zone, where the long-term bullish trend might find a path after a considerable downside correction. Investors should monitor how the price reacts to the near-term price action, as a bullish breakout from the H4 chart might provide a valid long opportunity.