Published: September 26th, 2024
In Australia, the August slowdown in inflation is preserving the possibility of a rate reduction before the end of the year. The cash rate swaps indicate a 20% probability of a quarter-point decrease in November with the chance of a December move increasing to 75%.
As the labor market's demand declined, job openings decreased by 5.2% in all three months ending in August, marking the ninth consecutive quarter of declines in this data released on Thursday.
The Reserve Bank of Australia warned households on Thursday not to take on too many loans when interest rates begin to fall, even though it has ruled out cutting rates this year.
Let's move on to the European Central Bank (ECB), and it's important to remember that the bank's evaluation of price inflation and economic circumstances played a role in the decision it made to loosen monetary policy this past week. Even though it did not announce a rate cut specifically for October, the ECB acknowledged that inflation in the country is still high.
While retaining a cautious perspective for future actions, ECB President Christine Lagarde declared that the economy should benefit from the reducing consequences of monetary policy constraints, with inflation anticipated to climb back to 2% by 2025.
Let's see the possible future price movement from the EURAUD technical analysis:

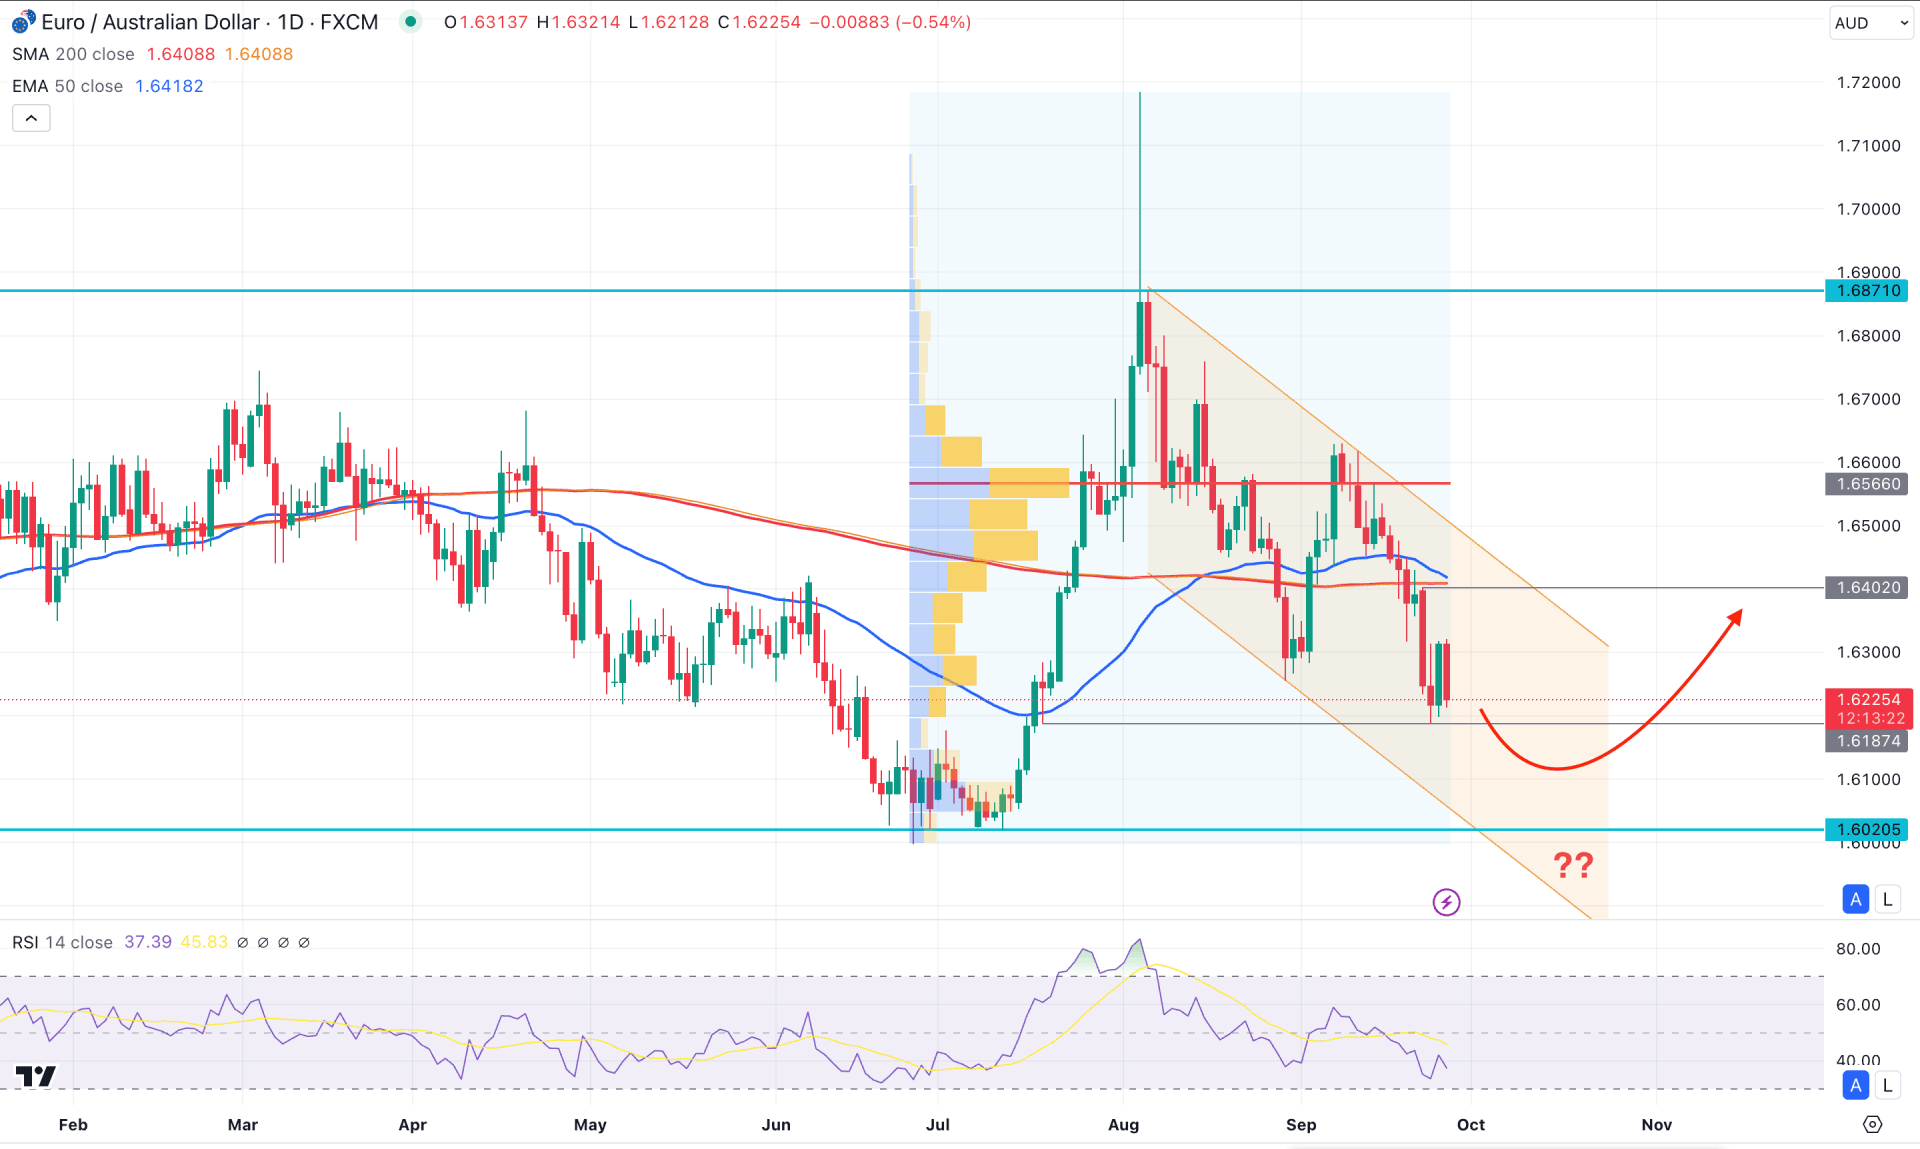
In the daily chart of EURAUD, the ongoing market momentum is bearish, while the current price hovers within the descending channel. Primarily, the bottom is not confirmed within the range, which might need a bit more time to validate a bullish opportunity.
Looking at the volume structure, the bearish pressure is valid as the current high volume line since July 2024 is at the 1.6566 level, which is above the current price. Primarily, a pending correction within a channel and high volume lines as resistance signal a possible bearish pressure in this pair. However, investors should look at the higher timeframe to validate the current market momentum.
In the monthly chart, the Shooting Star candlestick formation in August 2024 is an alarming sign to bulls as a bearish continuation below the candle's low could initiate a long-term bearish pressure.
In the main chart, the 200-day Simple Moving Average is above the current price, while the 50-day EMA is aimed to form a bearish crossover. It is a sign of a running bearish pressure, where a successful cross among dynamic lines could validate the Death Cross formation.
In the secondary window, the 14 day Relative Strength Index (RSI) remains steady below the 50.00 neutral line, suggesting an additional selling pressure.
Based on the daily outlook of EURAUD, the ongoing corrective pressure might extend by taking the price below the near term support level to complete the channel formation. In that case, investors might expect a decent bearish opportunity once the price breaks below the 1.6187 low.
On the other hand, any sufficient bullish signal from the 1.6187 to the 1.6080 zone could signal an early bullish opportunity before overcoming the channel resistance, Moreover, a valid buying pressure above the 1.6402 level could validate the long-term bullish opportunity, aiming for the 1.6871 resistance level.

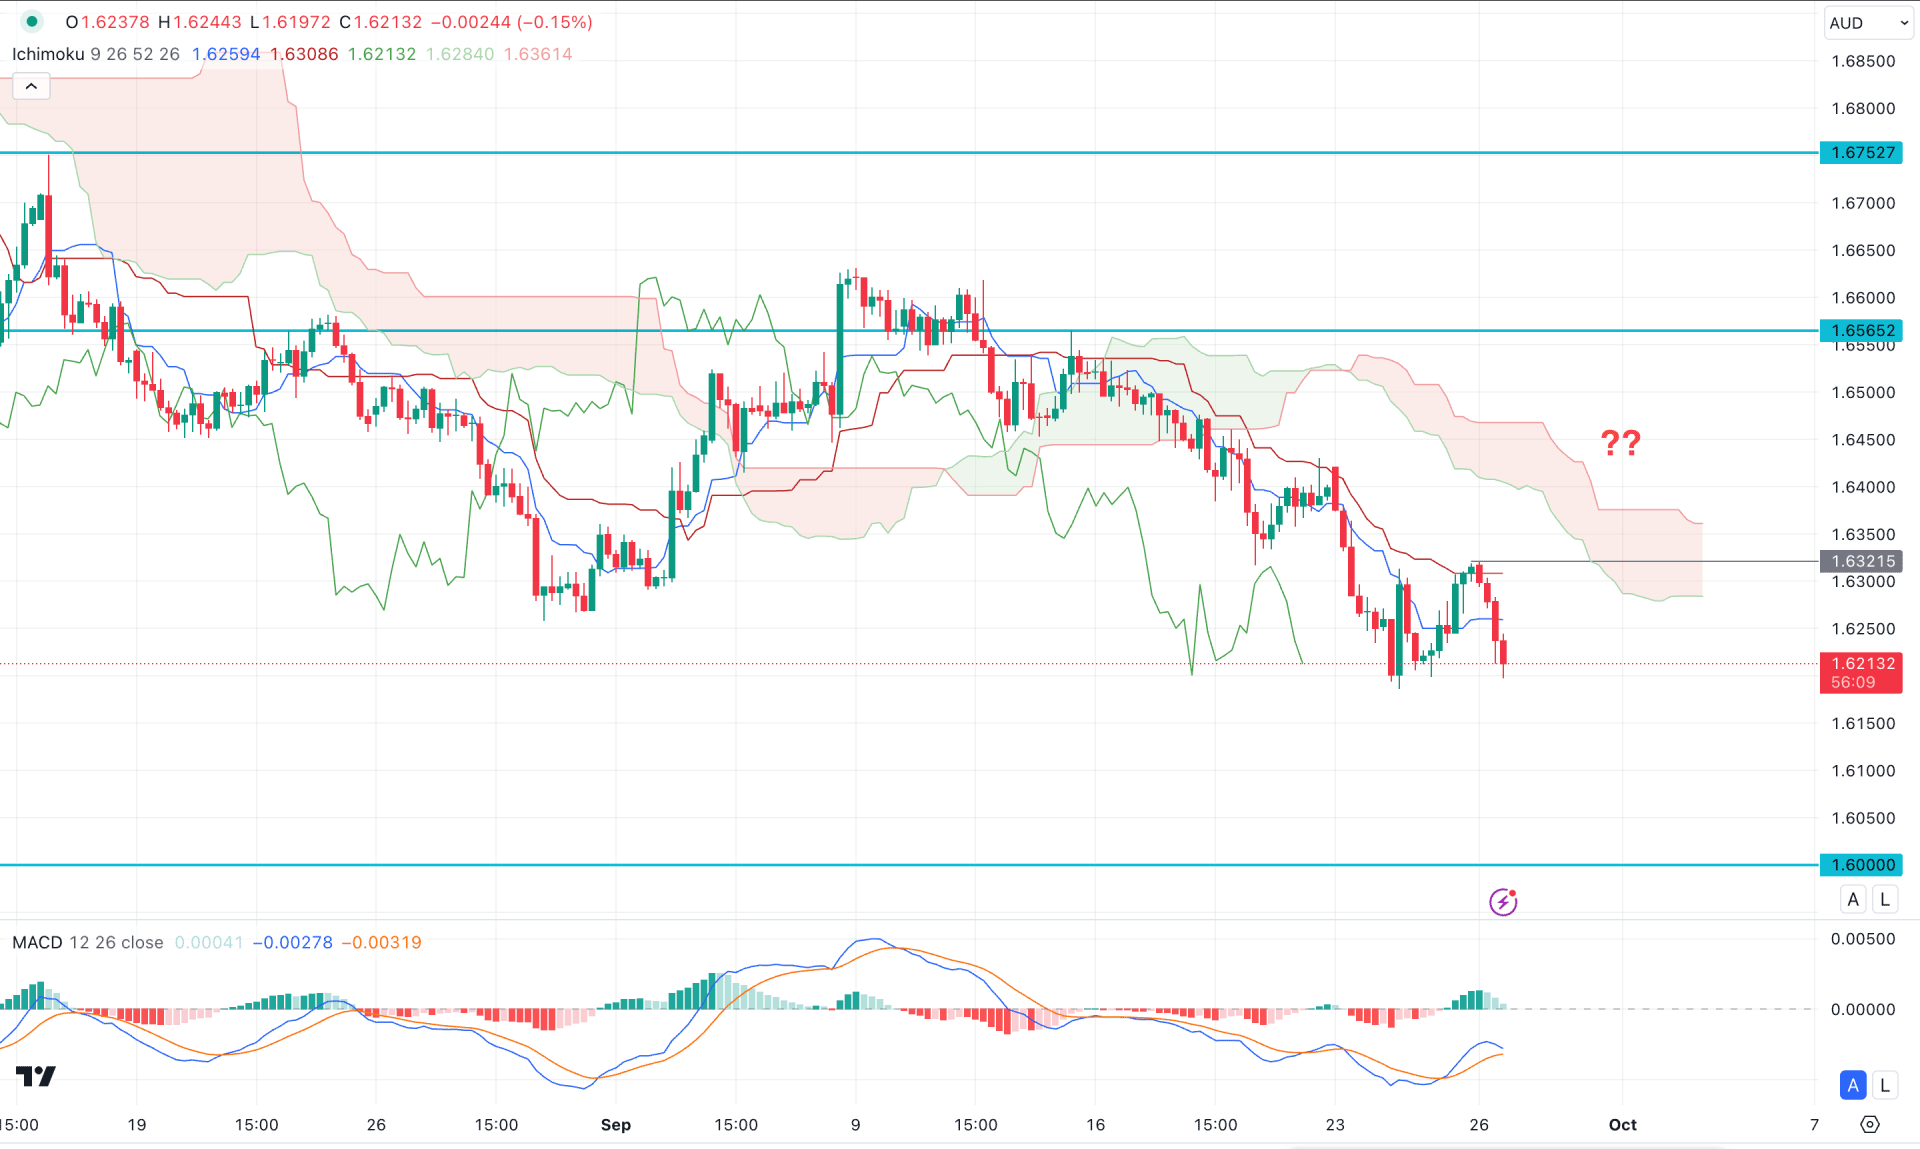
In the H4 timeframe, the ongoing bearish pressure is valid below the cloud low as the recent price keeps moving higher, creating lower lows.
In the indicator window, the MACD Histogram rebounded and reached the neutral zone, suggesting a possible downside pressure. Also, the dynamic Tenkan Sen and Kijun Sen are above the current price, while the Ichimoku Futures Cloud is on the sellers' side.
Based on the H4 structure, the price may continue moving higher as long as the 1.6321 high is protected. However, a bullish recovery with a counter-impulsive momentum needs a valid H4 close above the 1.6450 level before reaching the 1.6752 level.

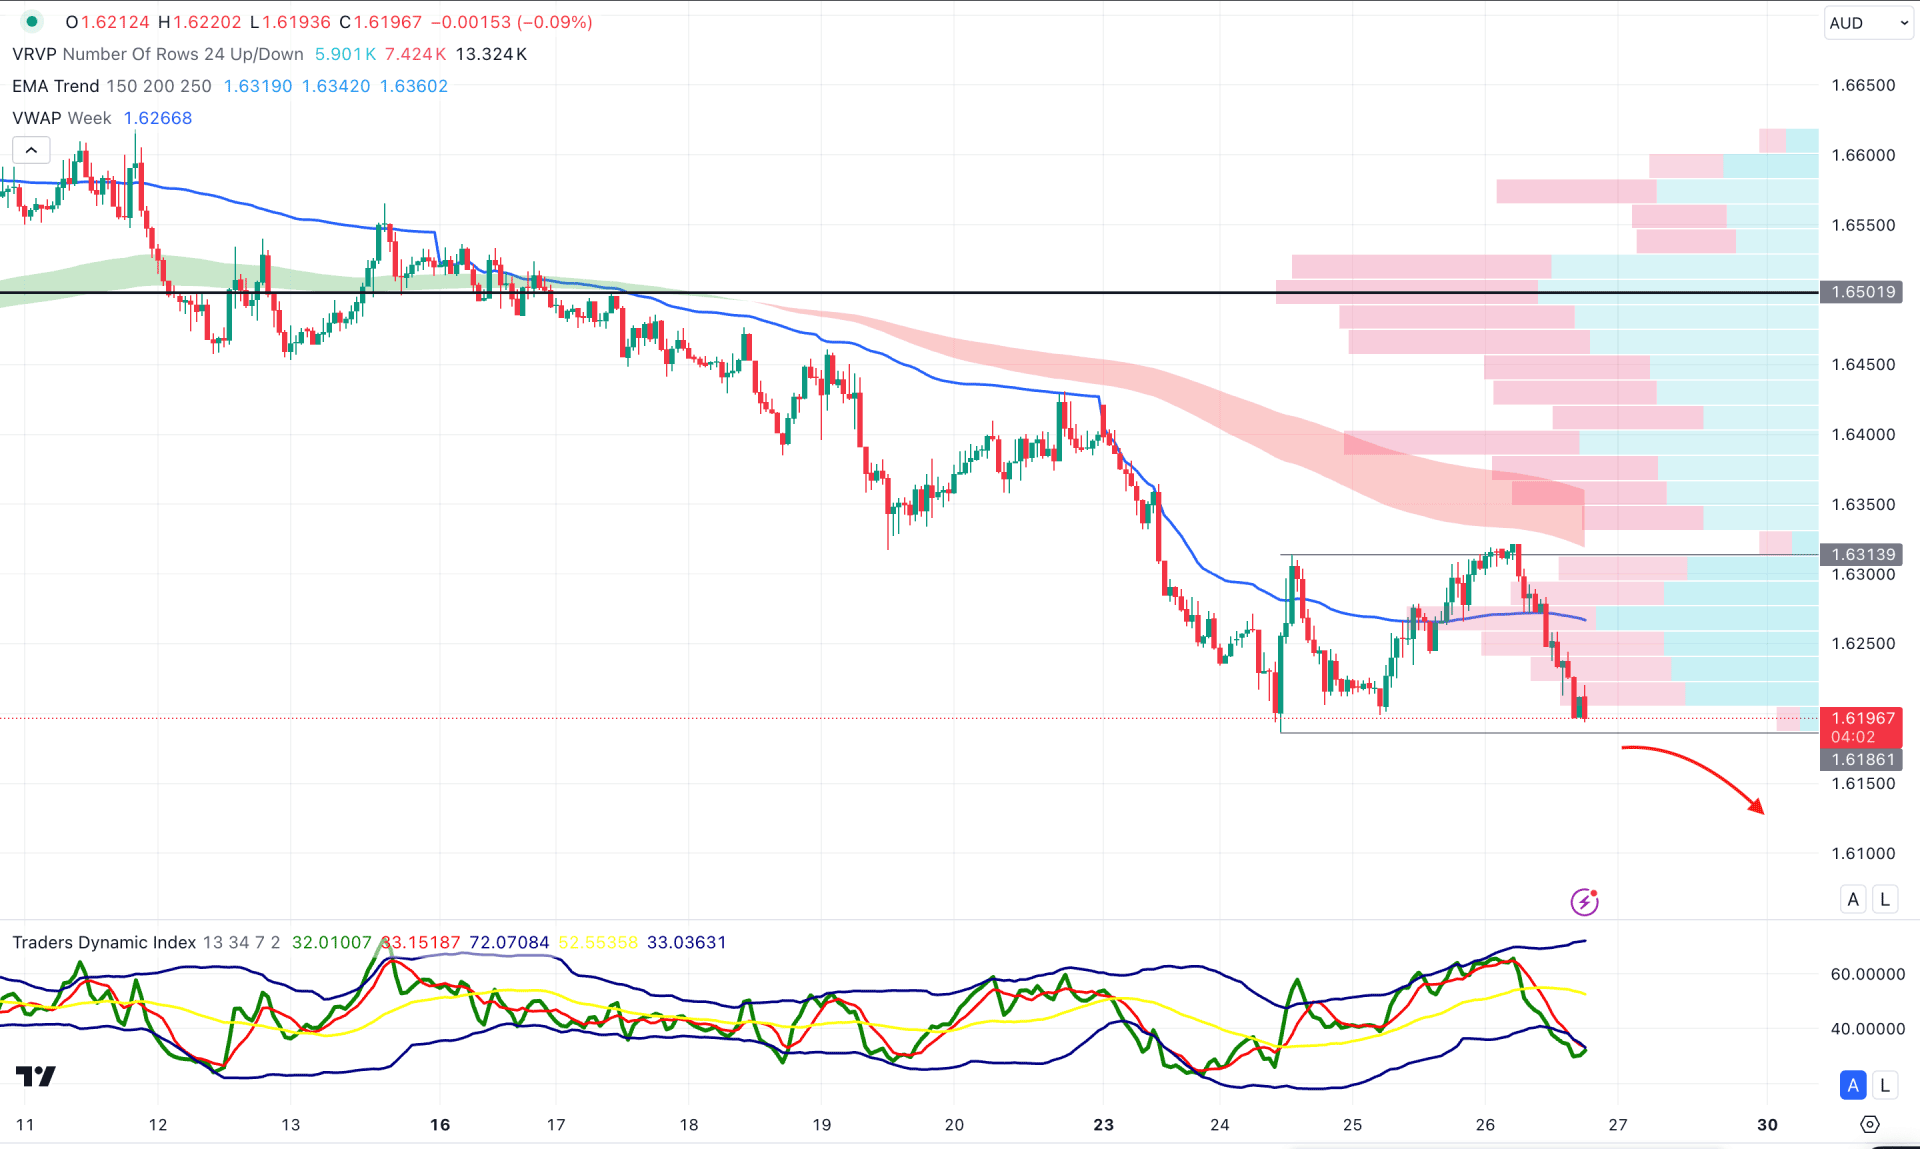
In the hourly time frame, the recent price trades below the Moving Average cloud, supported by the visible range high volume line. Moreover, multiple bearish daily candles were formed below the weekly VWAP line, suggesting a confluence of bearish factors.
In the indicator window, the Traders Dynamic Index (TDI) reached the lowest level in a month, suggesting extreme selling pressure in the market.
Based on the hourly outlook, investors should monitor how the price remains below the VWAP line. A break below the 1.6186 level could open the room for reaching the 1.6000 psychological line.
Alternatively, the price might initiate a bullish correction toward the 1.6250 to 1.6300 zone but a valid H1 candle above the 1.6300 level might invalidate the bearish opportunity any time.
Based on the current market momentum, EURAUD is more likely to aim lower and break below the near-term support level. The intraday price has already completed the minor bullish correction, which signals an early bearish opportunity.