Published: September 14th, 2022
Cryptocurrency investors are keen to see the long-awaited Ethereum merging event this week, where the network will be changed from Proof-of-work (PoW) to energy-efficient Proof-of-stake (PoS). The merger is expected to reduce energy consumption by 99.95%, with a development in the Network’s security and sustainability.
According to a prominent crypto analyst, the successful merging event could influence short futures positions to be closed and move back to the positive territory in the sport price. Other analysts from Nansen researchers, Ethereum whale investors have been staking the token since the beginning of this year, intending to eliminate the price volatility. As the capital from institutional investors started scaling in mid-June, it might show a bullish price action after the merge.
Ethereum’s native token ETH has seen a massive change in trading volume by 33.49% in the last 24 hours to $22,872,717,726, where the current market cap of the token is $195,854,059,082.
Let’s see the future price direction of Ethereum (ETH) from the ETH/USDT Technical analysis:
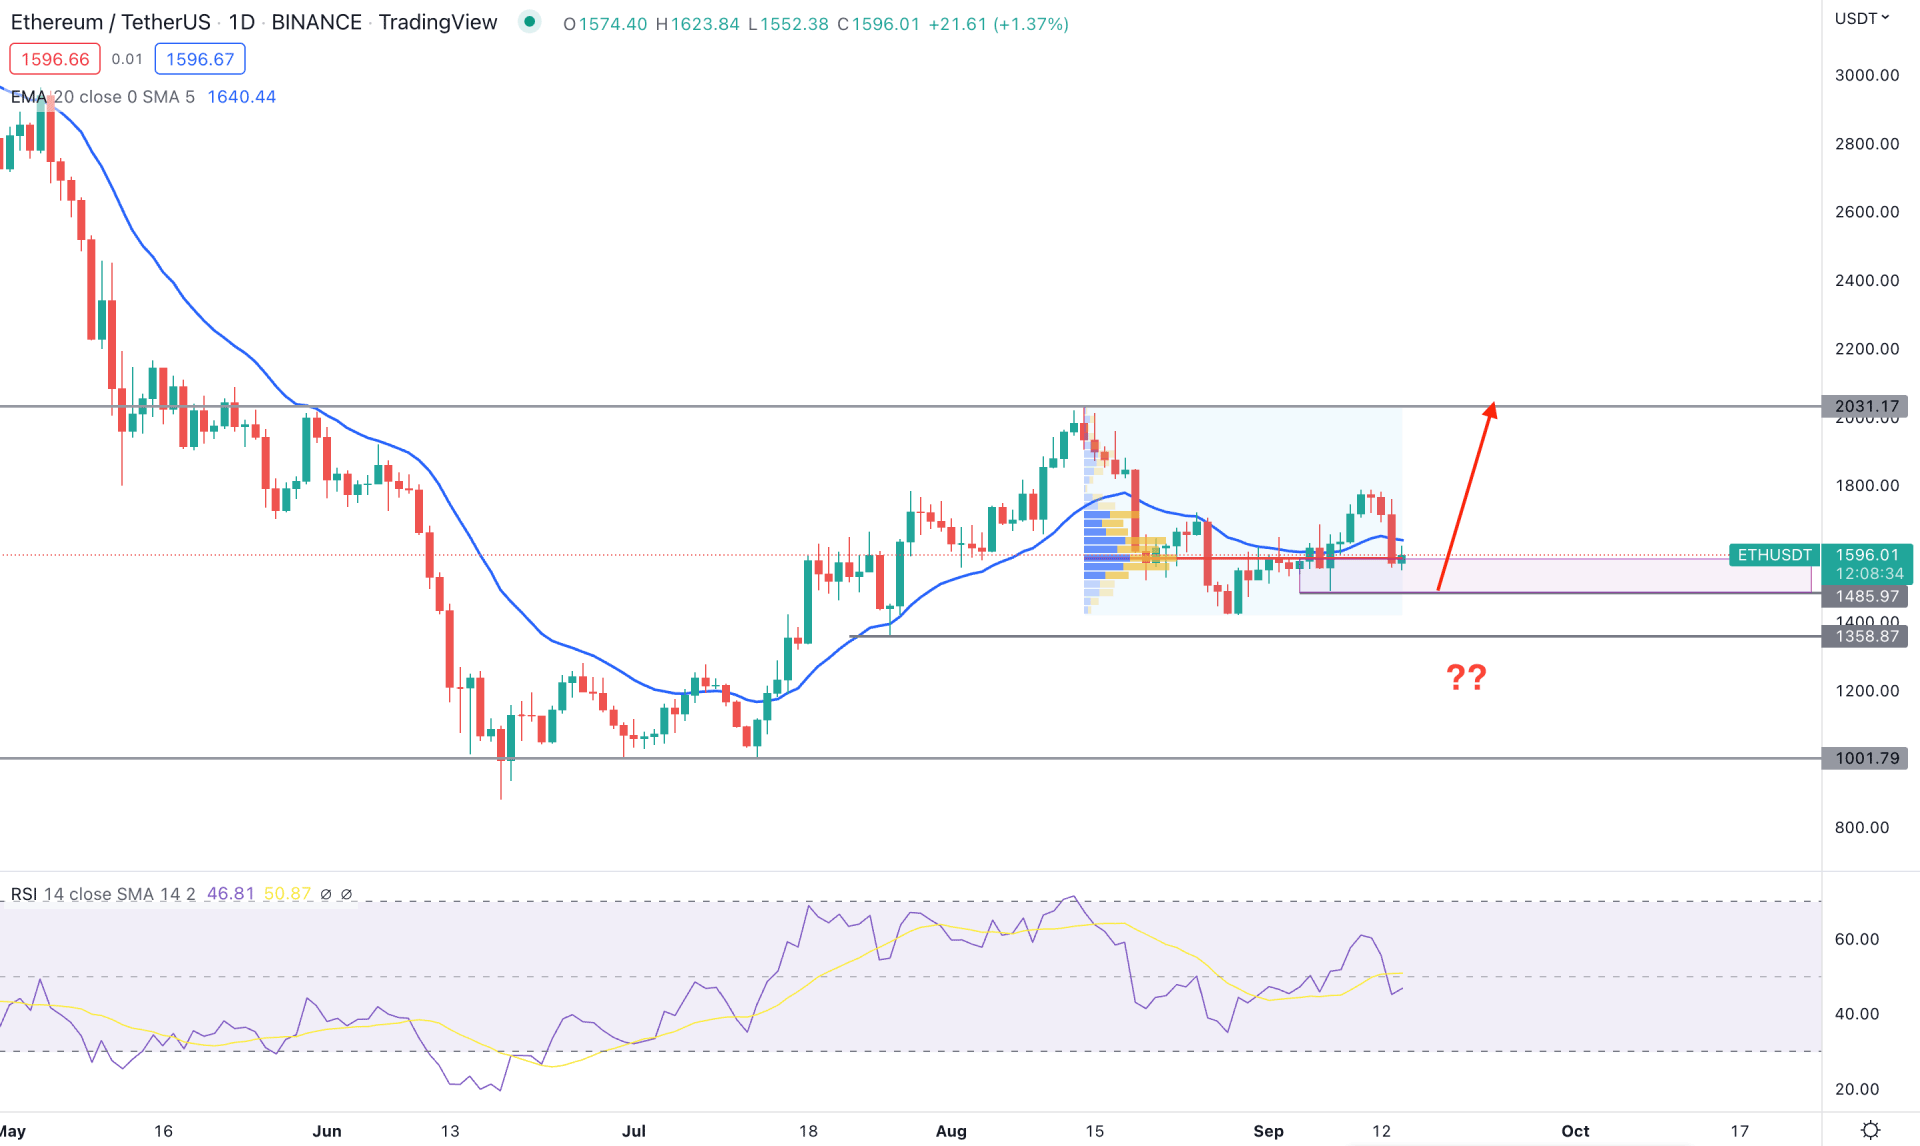
In the ETH/USDT daily chart, the current price trades in a sideways momentum, even if the price faced a 10% decline after the US CPI report. The selling pressure pushed the price to close a daily candle below the dynamic 20 EMA, but it is still above the 1485.97 support level.
According to the visible range trading volume indicator, the highest trading volume from August 2022 high to the September low is at the 1584.47 level, which is closer to the current price. Therefore, investors should closely monitor this price level, from where any breakout could come with solid momentum.
Events like Ethereum merging would significantly change the ETH price action, where investors may experience an unexpected spike before showing a fresh move. The RSI level on the daily chart is neutral at a 50% area, which is a sign of a range breakout.
Based on the daily ETH/USDT chart, investors should closely monitor the intraday price at 1485.97, and 1358.86, from where any bullish rejection could increase the price towards the 2200 mark.
On the other hand, a strong bearish daily close below the 1350.00 level could open room for reaching the 1001.79 support level from where buying pressure may come with appropriate price action.
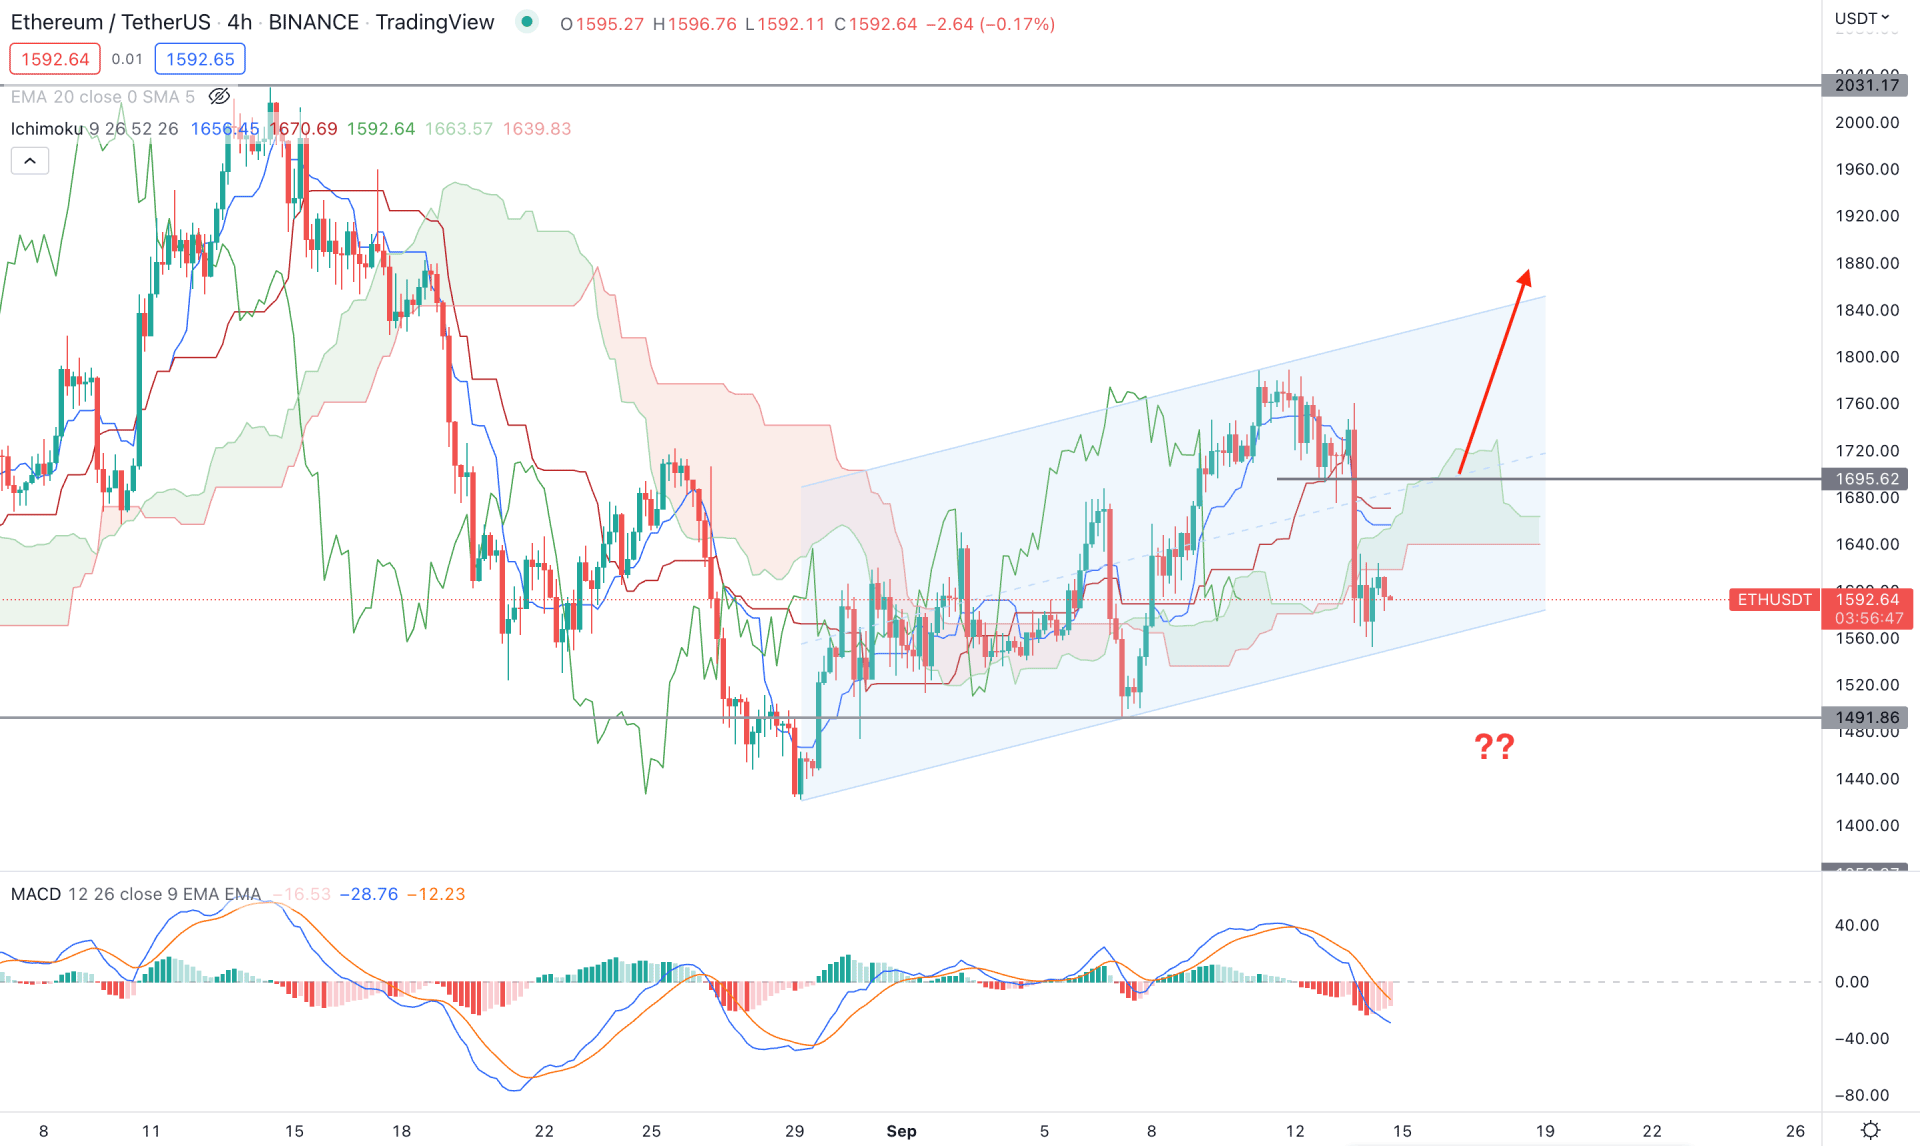
In the intraday H4 chart, ETH/USDT trades under corrective pressure, where the current price is moving sideways within an ascending channel. It is the third time the price has moved below the Kumo Cloud area in September but failed to make any new lower low below it. Moreover, the channel support is active at the 1550.00 level, which needs to be violated before forming a bearish possibility.
Based on the future cloud structure, the price viewpoint is bullish from the flat Senkou Span B and upward Senkou Span A. Moreover, the MACD Histogram started losing the selling pressure, where a bullish crossover in MACD lines would indicate a trend change.
Based on the H4 ETH/USDT price prediction, a new bearish H4 candle below the 1491.86 swing low would increase the selling pressure towards the 1300.00 level. On the other hand, any bullish rejection from the channel support and an H4 candle above the Kijun Sen would increase the bullish possibility towards the 2000.00 psychological level.
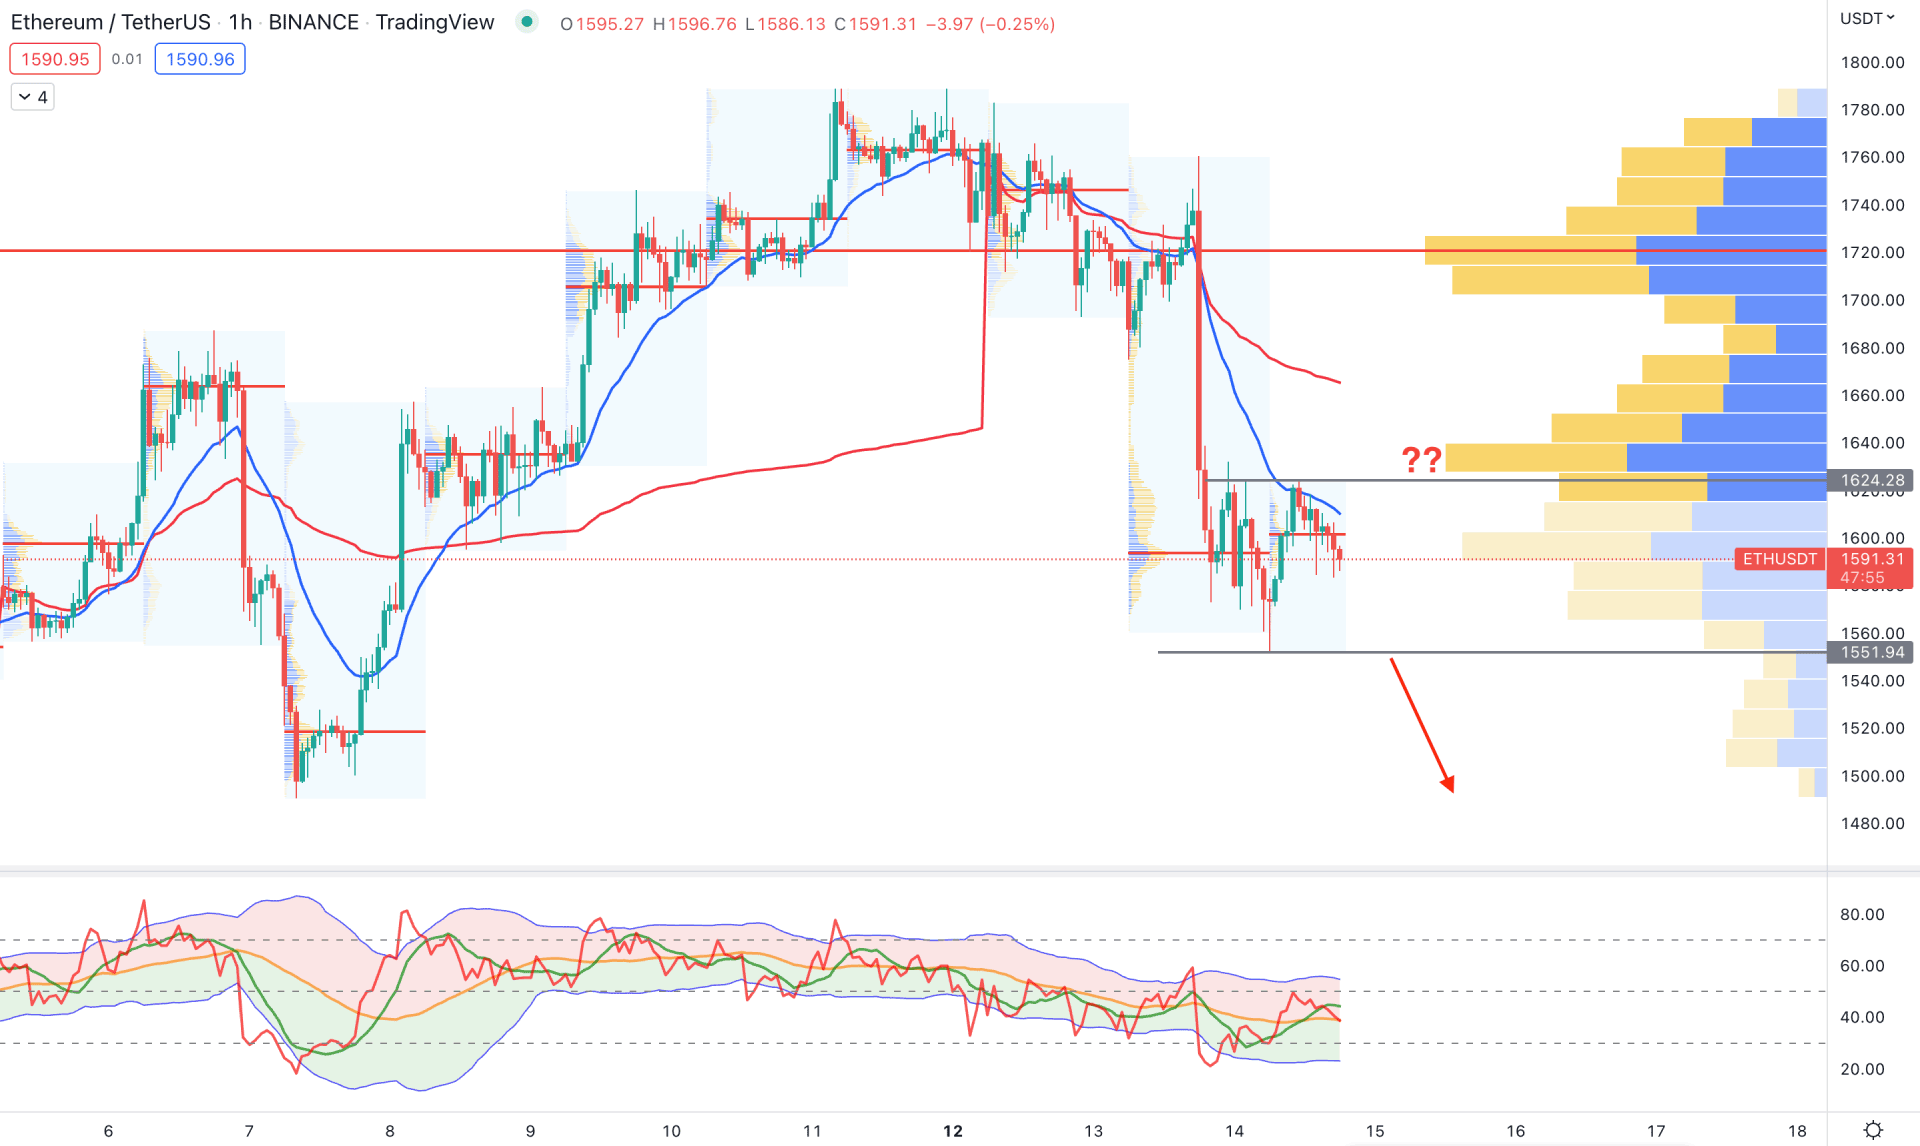
In the H1 chart, ETH/USDT trades under selling pressure as the visible range high volume level is at 1720.00 level, which is above the current price. However, in the Post-CPI price action, the H1 price remained under a tight range from 1624.28 high to 1551.94 low, from where a breakout could open a trading opportunity.
The dynamic 20 EMA and weekly VWAP are above the current price, while the current intraday high volume level is at 1600.00 level. The trades dynamic Index indicator shows a corrective pressure in the H1 chart, where the test of the lower band is pending, leading to selling pressure in the main window.
Based on the H1 price prediction, a bearish opportunity is potent if an H1 candle comes below the 1551.94 level, which would lower the price toward the 1450.00 level. On the other hand, a bullish break above the 1625.00 level might raise the price towards the 1720.00 high volume level.
Based on the current multi-timeframe analysis, ETH/USDT is more likely to show buying pressure from the merging event sentiment, where close attention to the near-term swing level is needed to find the potential bullish opportunity.


