
Published: February 6th, 2024
Disney Stock (DIS) has been involved in a turbulent endeavor in the preceding four years. The quarterly net income of $264 million is negligible to the $5.4 billion it disclosed pre-pandemic, resulting in a stock value decline of 52%.
Nevertheless, the lower stock price might not precisely mirror the demand dynamics of the organization. The primary entertainment divisions of Disney, which consist of its theme parks and streaming services, are undergoing expansion. The main obstacles consist of maximizing returns on capital investment and improving cost-effectiveness.
Despite economic setbacks, Disney+ has experienced robust subscriber growth, with an additional 7 million subscribers added in the most recent quarter. This expansion has contributed to a 12% annual increase in DTC segment revenue to $5 billion. In addition, a reduction of $1 billion in operational losses signifies an encouraging trend that may culminate in profitability by the conclusion of September.
One notable issue is Disney's substantial indebtedness, incurred due to acquiring Fox's entertainment assets. Disney stock is valued at 14.6 times its operating income for the fiscal year 2019, which is higher than its historical average.
Although a revival to profitability levels before the pandemic could potentially invigorate the stock, the present valuation may constrain substantial gains. However, with persistent investments, strategic debt reduction initiatives, and advancements in streaming economics, the stock may eventually acquire investors' attention.
Let’s see the upcoming price direction of this stock from the DIS technical analysis:
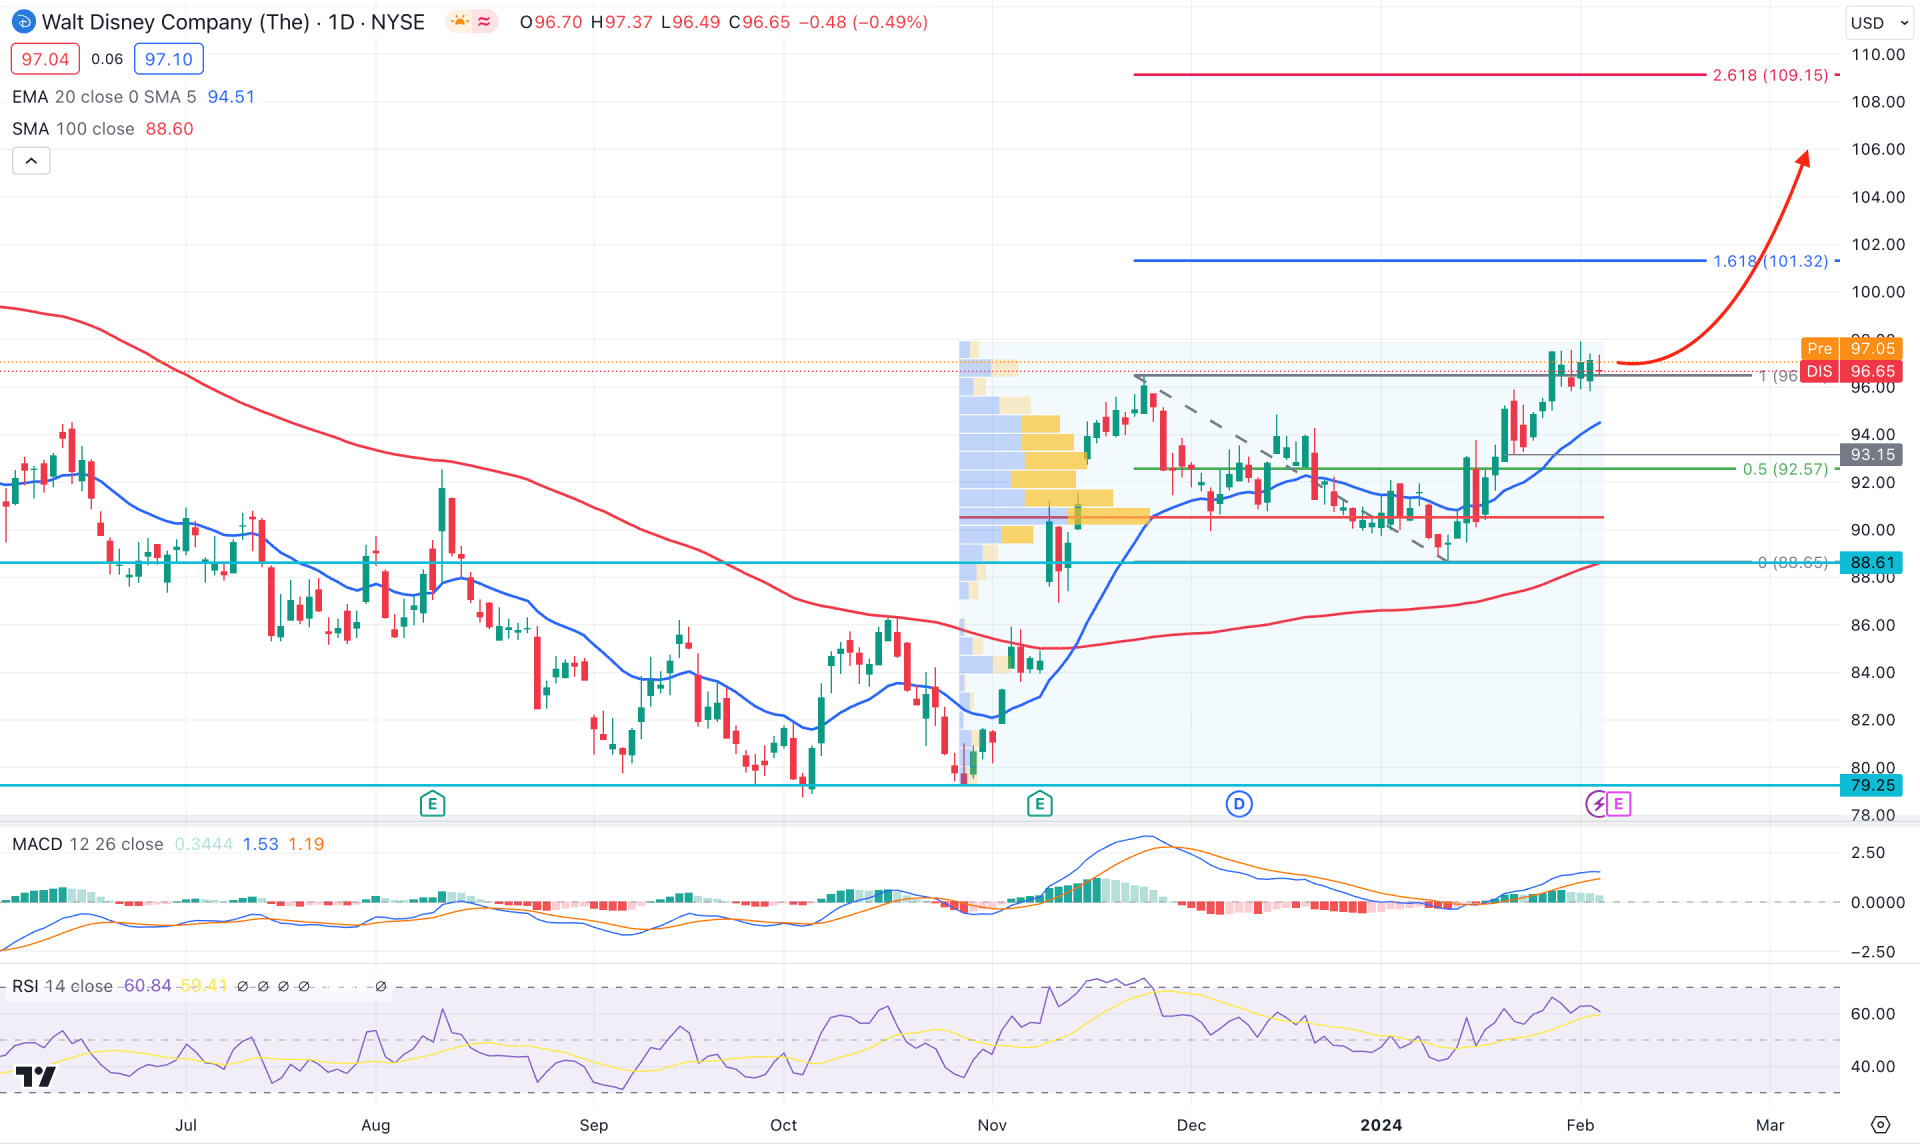
In the daily chart of DIS, the overall market momentum is bullish. The bull run from October 2023 formed at the top at the 96.55 level before moving sideways as a channel formation. Later on, a descending channel breakout is in play, where the dynamic 100-day SMA is a major support.
In the daily context, the ongoing impulse after the corrective pressure below the 20-day EMA suggests a solid trend trading opportunity from near-term support areas. The volume looks positive to bulls as the most active level since October 2023 is at 90.54 level, which is below the current price and above the 88.61 bottom.
In the higher timeframe, a solid bullish monthly candle is present after an inside bar, while the last three weekly candles show a positive sentiment. Technical indicators are also positive to bulls, where the 14-period RSI hovers above the 60.00 line, while the MACD Histogram maintains the positive line.
Based on the daily market outlook, Disney Stock (DIS) bulls have a higher possibility of extending the buying pressure. In this context, a daily candle above the 100.00 psychological level could be a valid long opportunity, targeting the 109.15 level.
On the bearish side, there are several barriers, where the 100-day SMA could be a major support. Therefore, a daily downside pressure below the 90.47 high volume level could signal a bearish continuation towards the 88.61 level.
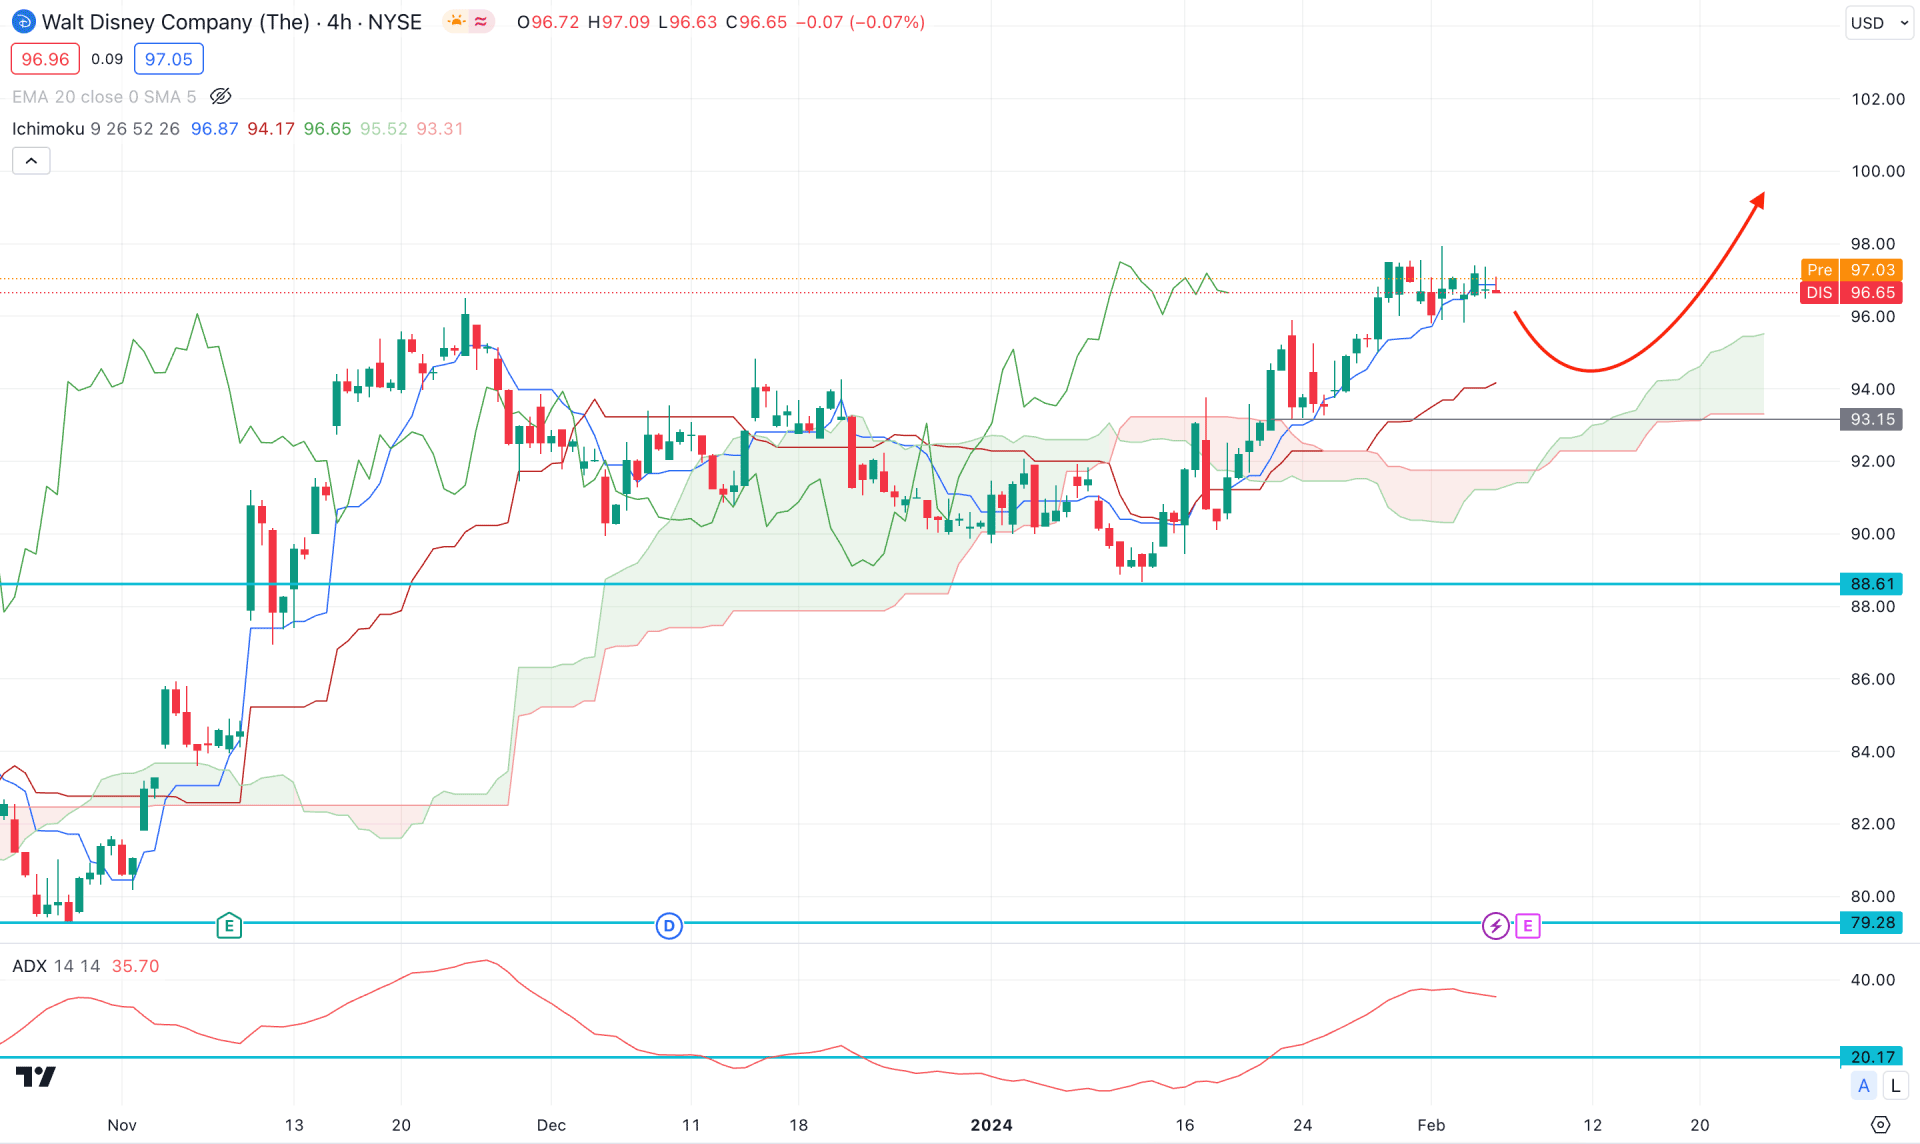
In the h4 chart, the current price trades above the Ichimoku Cloud area, where the thickness of the future cloud is solid. The Senkou Span A is above the Senkou Span B in the future cloud, while both lines show an upward direction.
In the indicator window, the Average Directional Index (ADX) remained stable above the neutral 20.00 line. It is a sign of a strong trend, which could end up as a continuation pattern.
Based on this outlook, the most recent support level is the dynamic Tenkan Sen, where the current price hovers. As the recent price struggles to hold the buying pressure above this line, investors should monitor how the price reacts on this line.
In this context, the dynamic Kijun Sen and static 93.15 level would be major barriers for sellers. In that case, a bullish reversal is possible as long as the price trades above these lines. However, a solid downside recovery with an H4 candle below the cloud low could be a short-term bearish opportunity, targeting the 82.00 area.
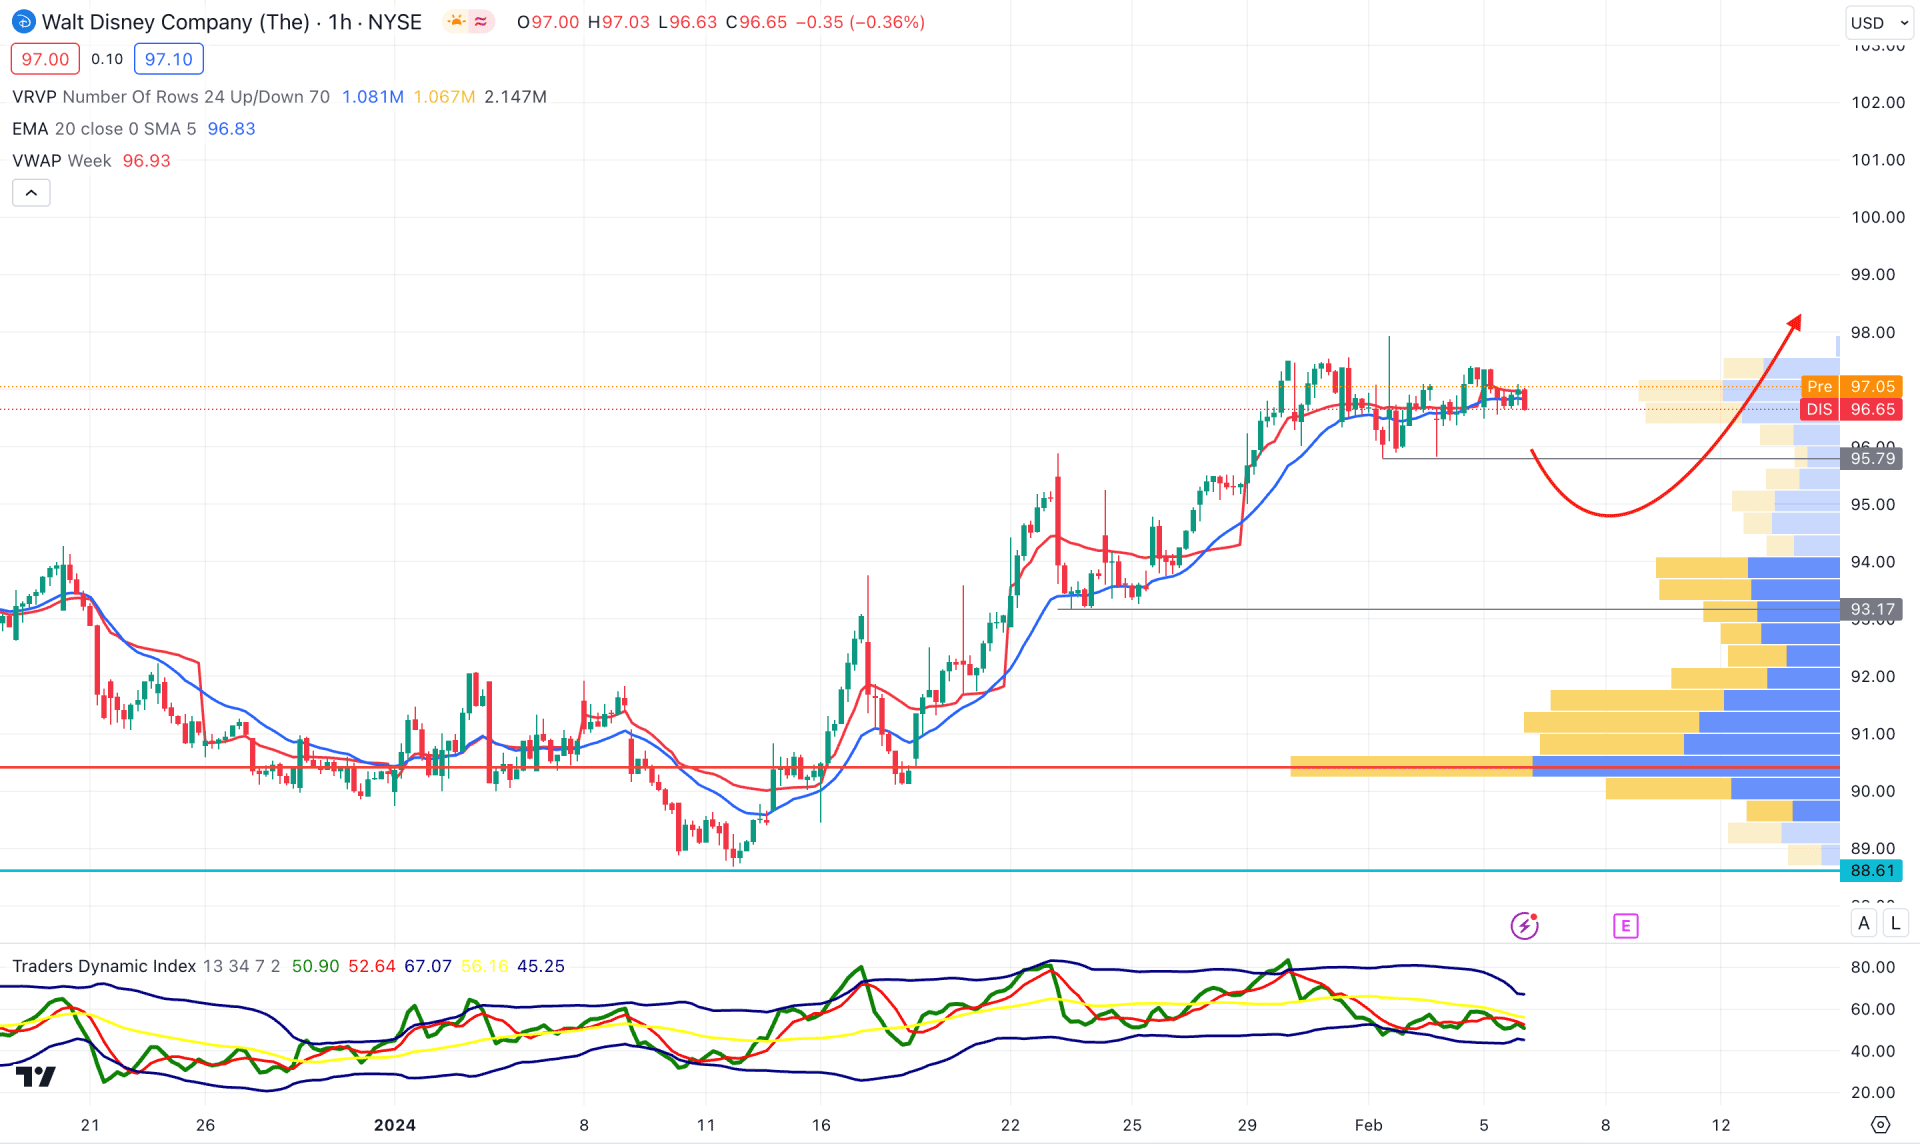
In the hourly chart, the current price trades sideways at the top, with multiple violations of the dynamic 20 EMA. Moreover, the visible range high volume level is way below the price, with a pending downside correction as a mean reversion.
The Trades Dynamic Index Indicator suggests a corrective price action, where the current level is below the 50.00 line with a sideways momentum.
Based on this outlook, a downside recovery is potent, where a bearish H1 candle below the 95.79 level could be a bearish opportunity, targeting the 92.00 level. A bullish reversal from the 94.00 to 90.40 area could provide a bullish reversal opportunity at any time, targeting the 106.00 level.
Based on the current market outlook, DIS has a higher possibility of extending the long-term buying pressure after a minor recovery. In that case, investors should closely monitor how the intraday price forms a bottom before offering a long opportunity.


