Published: December 10th, 2024
This week, AVGO projects fourth-quarter fiscal year 2024 revenues of about $14 billion, indicating a 51% increase from the previous year.
The Analysts' Consensus Estimate for earnings is $14.06 billion, representing a 51.29% increase over the reported amount from the same quarter last year.
Over the last 30 days, the profit consensus mark has remained consistent at $1.39 per share, representing a 25.23% increase over the amount reported in the quarter before this one.
Broadcom's growing AI and Gen AI products should have helped the company's fourth-quarter fiscal results. AI revenues are expected to increase by 10% repeatedly to exceed $3.5 billion in the fourth quarter of fiscal year 2024.
AVGO anticipates that non-AI revenues will rebound in the upcoming quarter. Overall networking income will increase by over 40% annually. Revenues from server storage are anticipated to decrease by the high single digits annually but increase by the mid-to-high single digits sequentially.
According to AVGO, fourth-quarter FY 2024 semiconductor earnings will be approximately $8 billion, a 9% increase from the previous year.
Broadcom's growing clientele is notable, including companies like Meta Platforms META and Alphabet GOOGL.
Alphabet is among Broadcom's specific application integrated processors (ASICs) consumers. These chips facilitate machine learning and artificial intelligence and increase their efficiency. Since Meta Platforms uses AVGO's ASICs to create Metaverse hardware, it has also grown to be a significant client.
Let's see the upcoming price direction of this stock from the AVGO technical analysis:

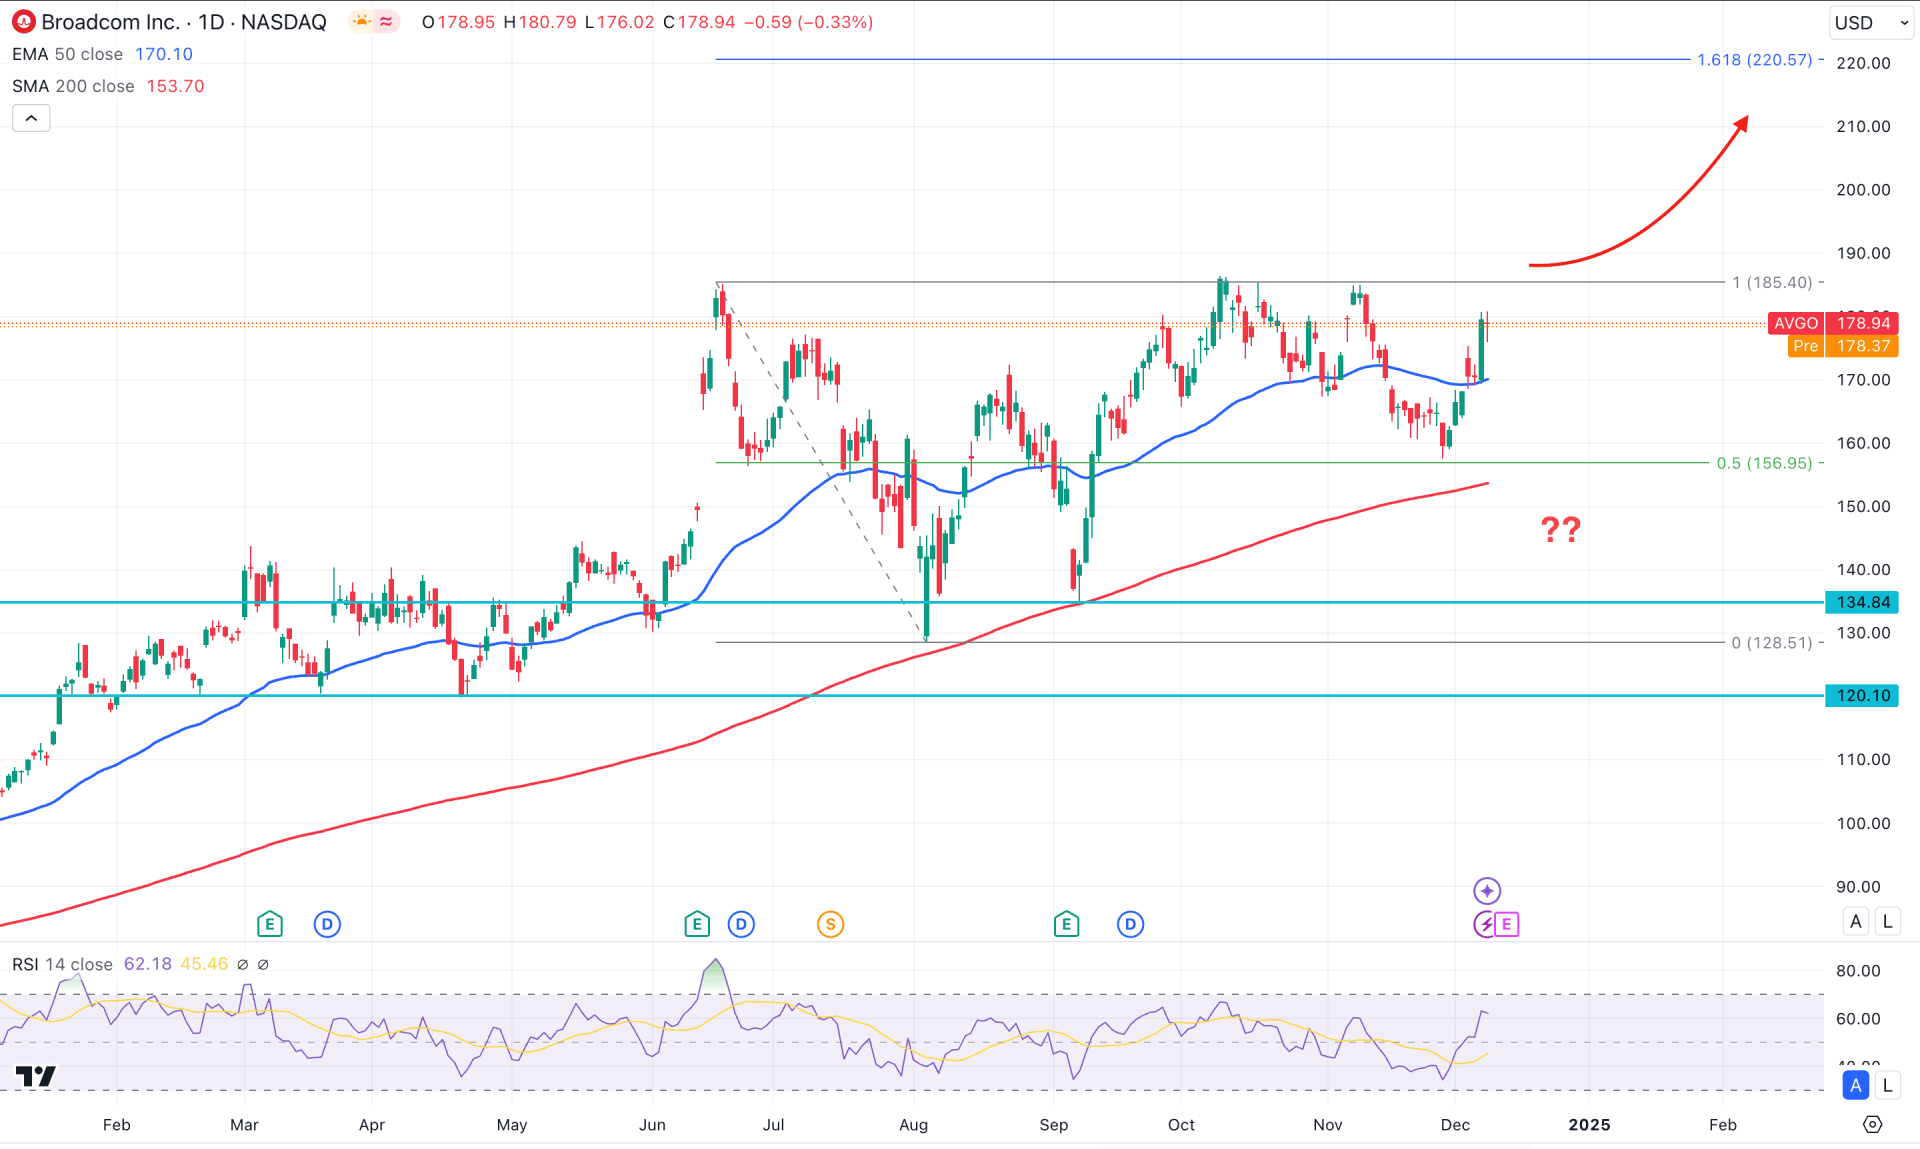
In the daily chart of AVGO, the ongoing bullish momentum is solid despite the minor selling pressure after the 1/10 stock split. As the near-term dynamic level hovers below the most recent daily candle, we may expect an upward continuation soon.
In the higher timeframe, excessive volatility has been seen since August 2024, which might require a skeptical investor's approach. After two consecutive bearish months, the current price is hovering higher, from where a valid monthly candle above the November 2024 high could resume the long-term bullish trend. As of now, the weekly price remains bullish as the latest candle remains above the multi-week high.
Looking at the main price chart, a considerable downside correction is visible as the recent price reached a bottom below the 50-day Exponential Moving Average. However, the crucial 200-day SMA is still protected as the price rebounded higher without violating it. Considering the bullish rebound from the 50-day EMA line, we may consider it as a Golden Cross continuation signal, aiming for a new all-time high.
In the secondary window, the Relative Strength Index rebounded from the oversold 30.00 level and has yet to reach the overbought 70.00 line. This is a sign that a bottom has formed in the main price chart, and sufficient upward continuation is pending.
Based on the daily market outlook of AVGO, the recent bullish V-shape recovery could form a proper validation after having a daily candle above the 185.40 resistance level. In that case, the upward pressure might extend at the 220.57 Fibonacci Extension level.
On the bearish side, a failure to hold the price above the 50-day EMA could be an alarming sign to bulls, which might extend the downside pressure at the 200-day SMA area.

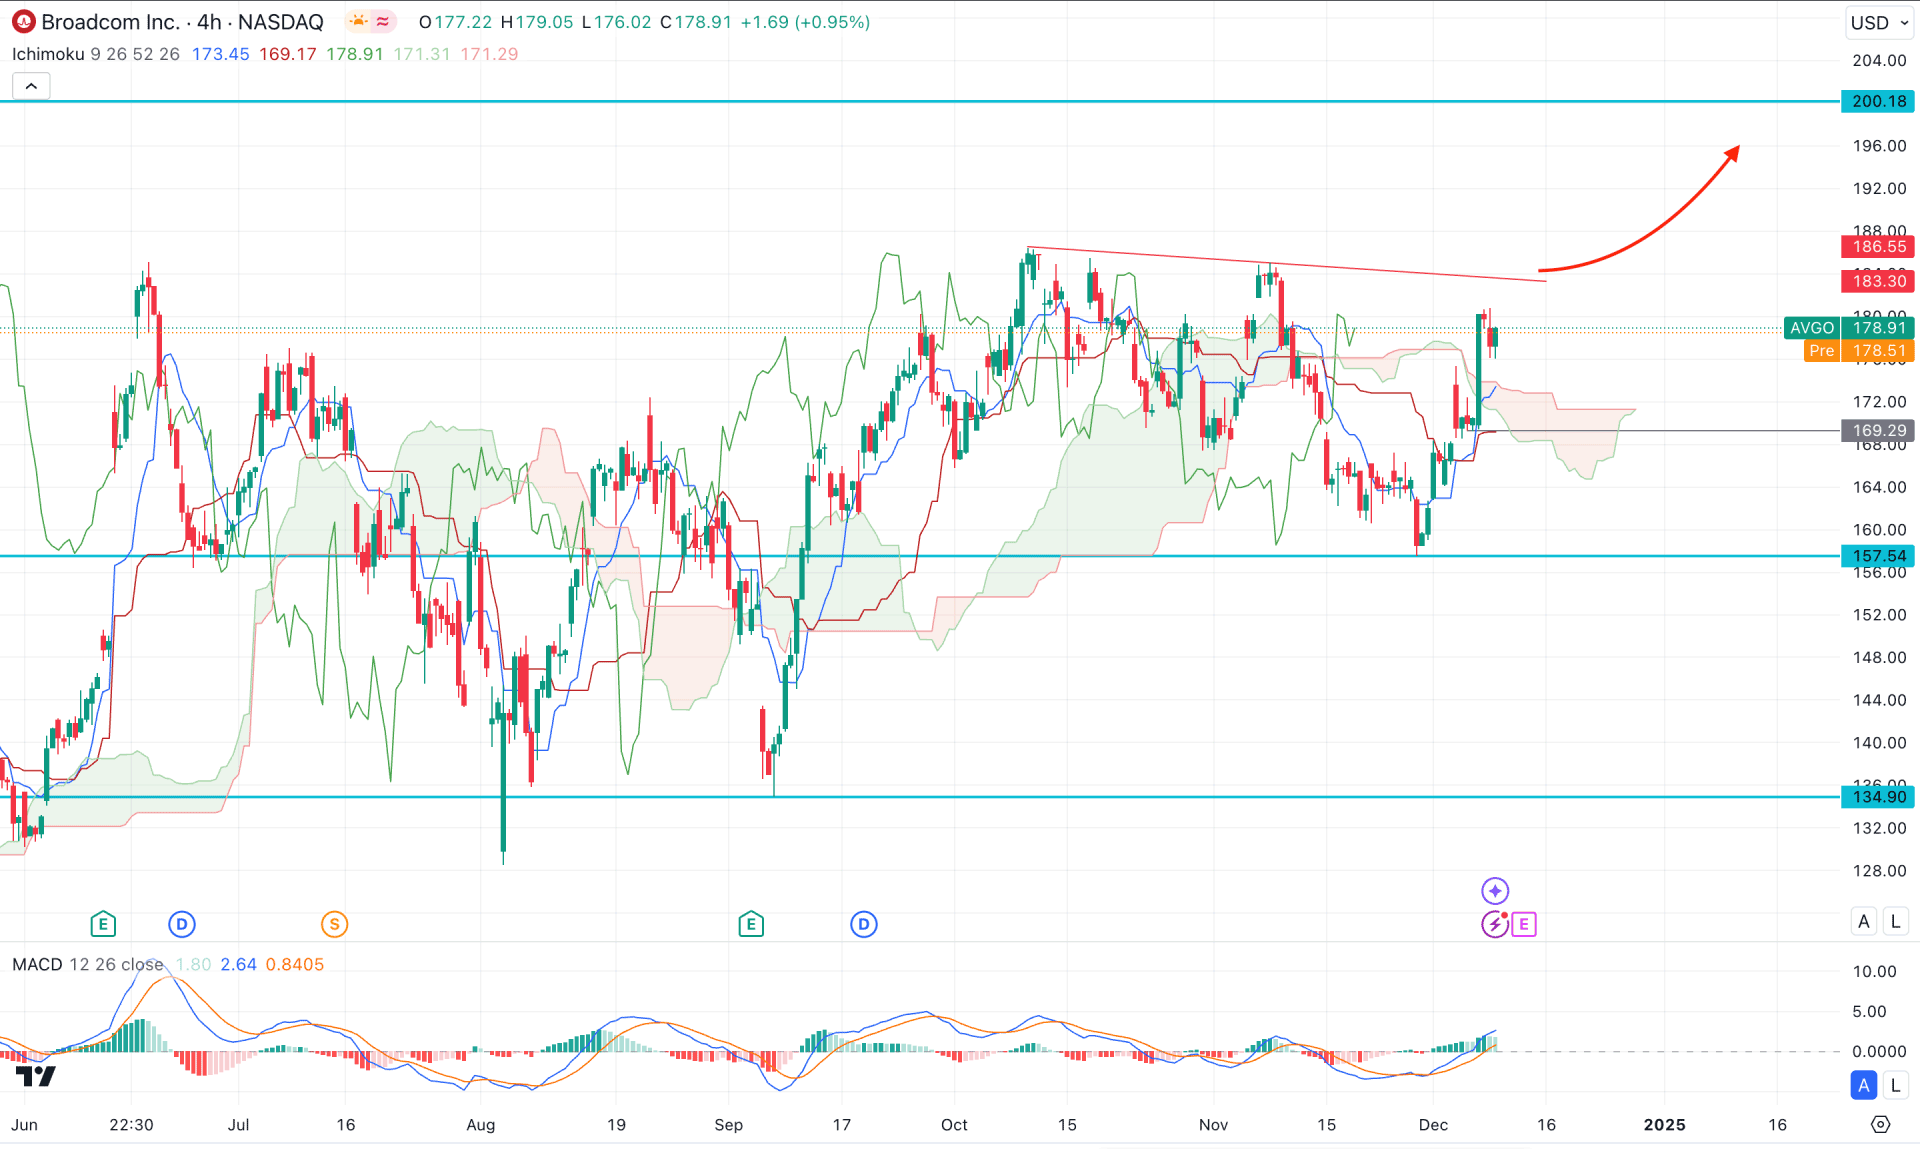
In the H4 timeframe, the recent price showed volatility in the dynamic Ichimoku Cloud zone, where the most recent price is hovering above the cloud zone. The Senkou Span A flipped the position and reached the Senkou Span B level, which signals a primary bullish signal.
In the indicator window, the MACD Histogram is hovering above the neutral line with no sign of a top formation. Also, the Signal line showed a bullish recovery with a bullish crossover from the bottom.
Based on this outlook, investors might expect a bullish trend after a valid breakout. As the current price hovers above the Ichimoku Cloud zone, a bullish trend line breakout with an H4 close could validate the bullish trend toward the 200.00 psychological line.
On the bearish side, a deeper correction is possible towards the 169.29 support level, but a bearish H4 close below the cloud low could eliminate the possibility of bullishness.

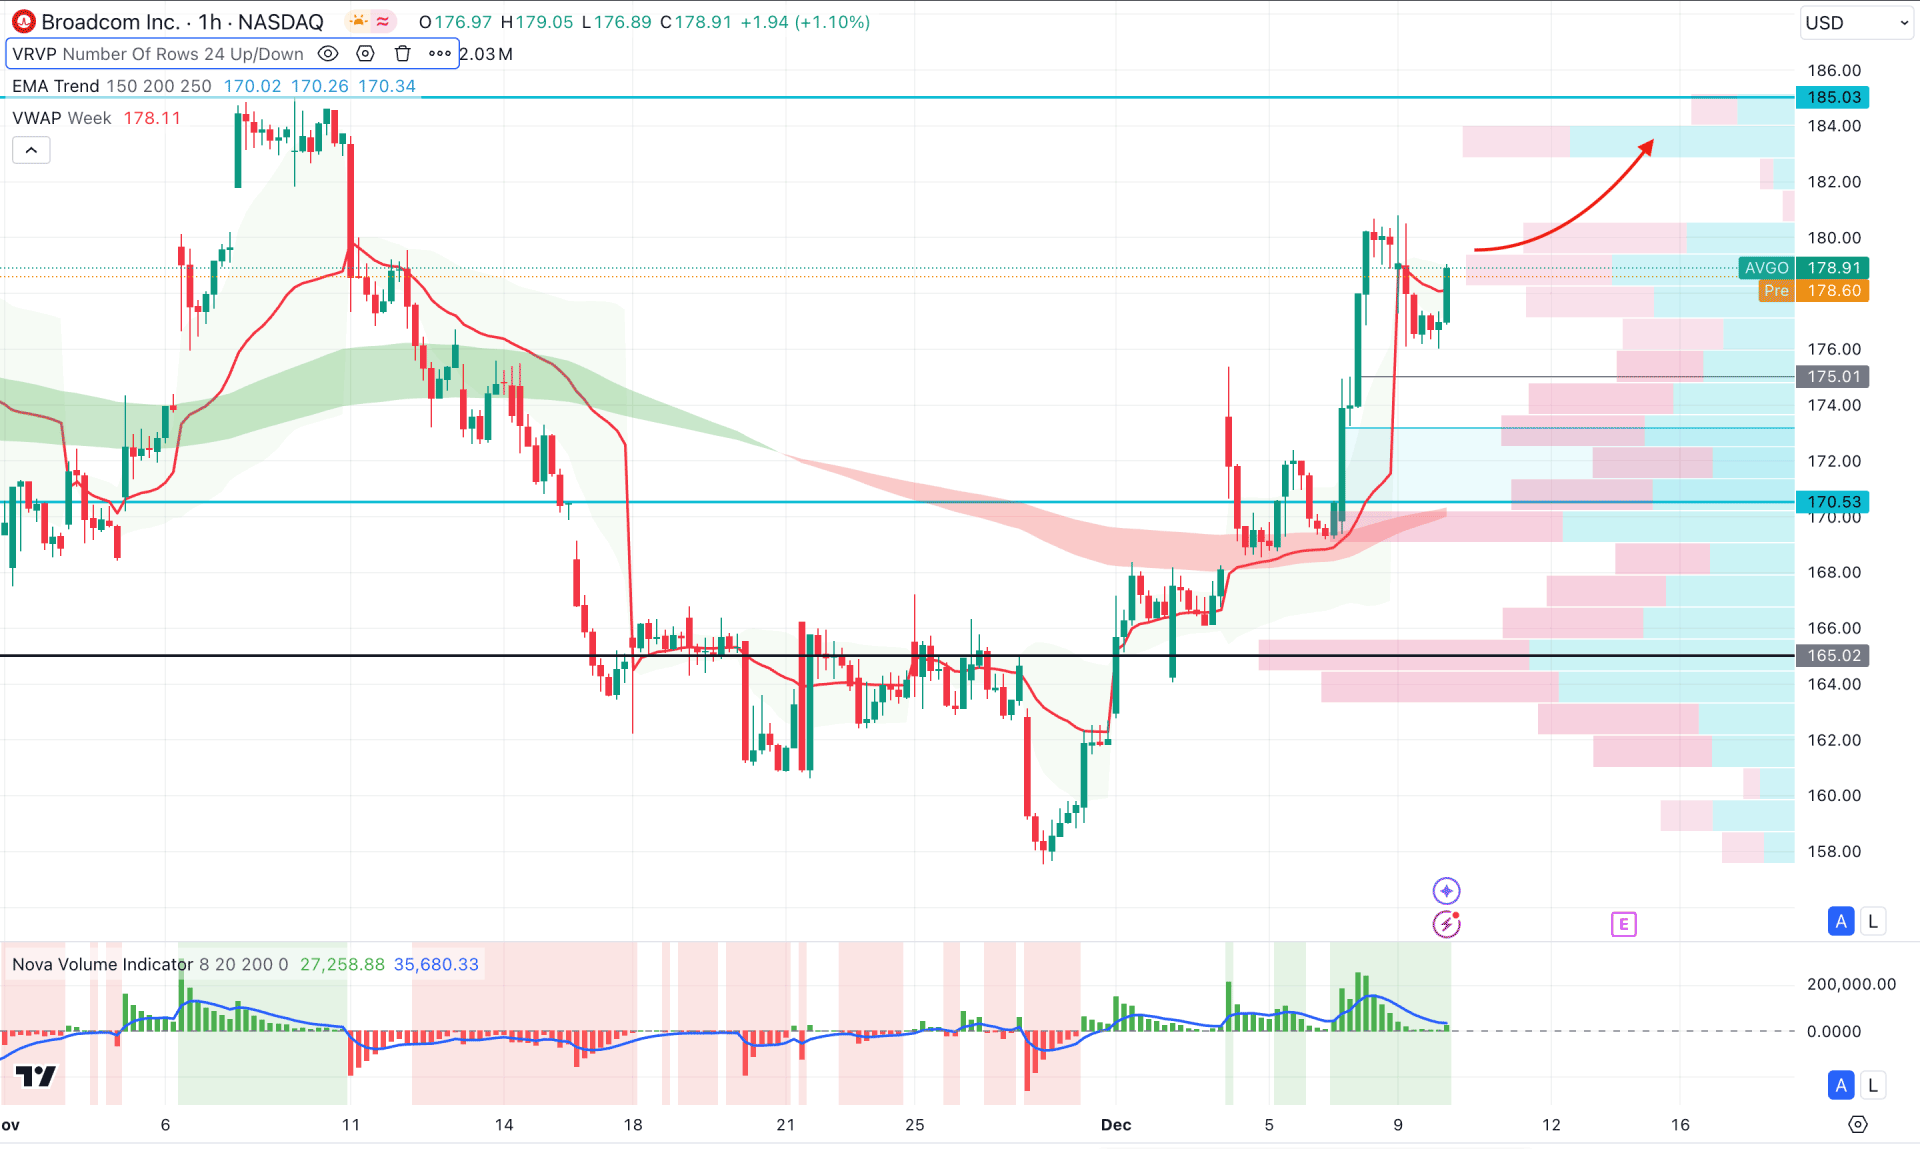
In the hourly time frame, the recent price showed a decent bullish recovery, above the Visible range high volume line. Moreover, the Moving Average Wave consists of 150 to 250 MA below the current price, working as an immediate support.
However, the Volume Histogram reached the neutral area, signaling a weaker buy-side volume generation.
In that case, investors should closely monitor how the price trades above the 175.01 support line as a break below this line could find support from the 1170.53 inefficiency level.
On the bullish side, an immediate bullish rebound from the weekly VWAP is possible, where the main aim is to test the 185.05 resistance level.
Based on the current market outlook, AVGO is more likely to extend the buying pressure and probably make a new all-time high soon. However, investors should monitor how the price trades in the intraday chart as a valid bullish rebound from the near-term support area is needed before opening a long position.