Published: October 8th, 2024
For the past seven months, the price of Binance Coin (BNB) has been unable to overcome crucial price levels, which has maintained the altcoin quiet. The resistance currently stands between $575 and $619, and although BNB has recently displayed positive signals, it is still unclear if the coin will be able to overcome this barrier.
The BNB Open Interest (OI) has decreased by over $100 million in the last few days, suggesting that traders are winding down their positions. However, the financing rate is still favorable, indicating that short sellers may be retreating.
With fewer short-selling opportunities, there would be less pressure on the cost to decline, which could be favorable for BNB. Less shorts might provide BNB with the momentum it needs to break through the obstacle.
Although the decline in OI initially appears to be a negative indicator, the rising funding rate indicates that the market is optimistic. If traders keep pulling out of their short-selling positions, BNB can eventually overcome the $575 resistance mark and continue rising.
Let's see the future price of this coin from the BNB/USDT technical analysis:

The most recent price trades sideways in the daily chart of BNB/USDT, while the broader market momentum is bullish. Considering the fundamental support, the primary aim for this pair would be to look for a long trade but a valid confirmation is needed from the near-term price action.
In the higher timeframe, the monthly candle shows extreme volatility as the last 6 months candle failed to provide a valid swing. However, the current price is hovering below the August 2024 high, which came after grabbing the buy-side liquidity in September. Also the recent weekly price shows a bearish rejection from the 600.00 psychological line, which might work as a bearish continuation as a range extension.
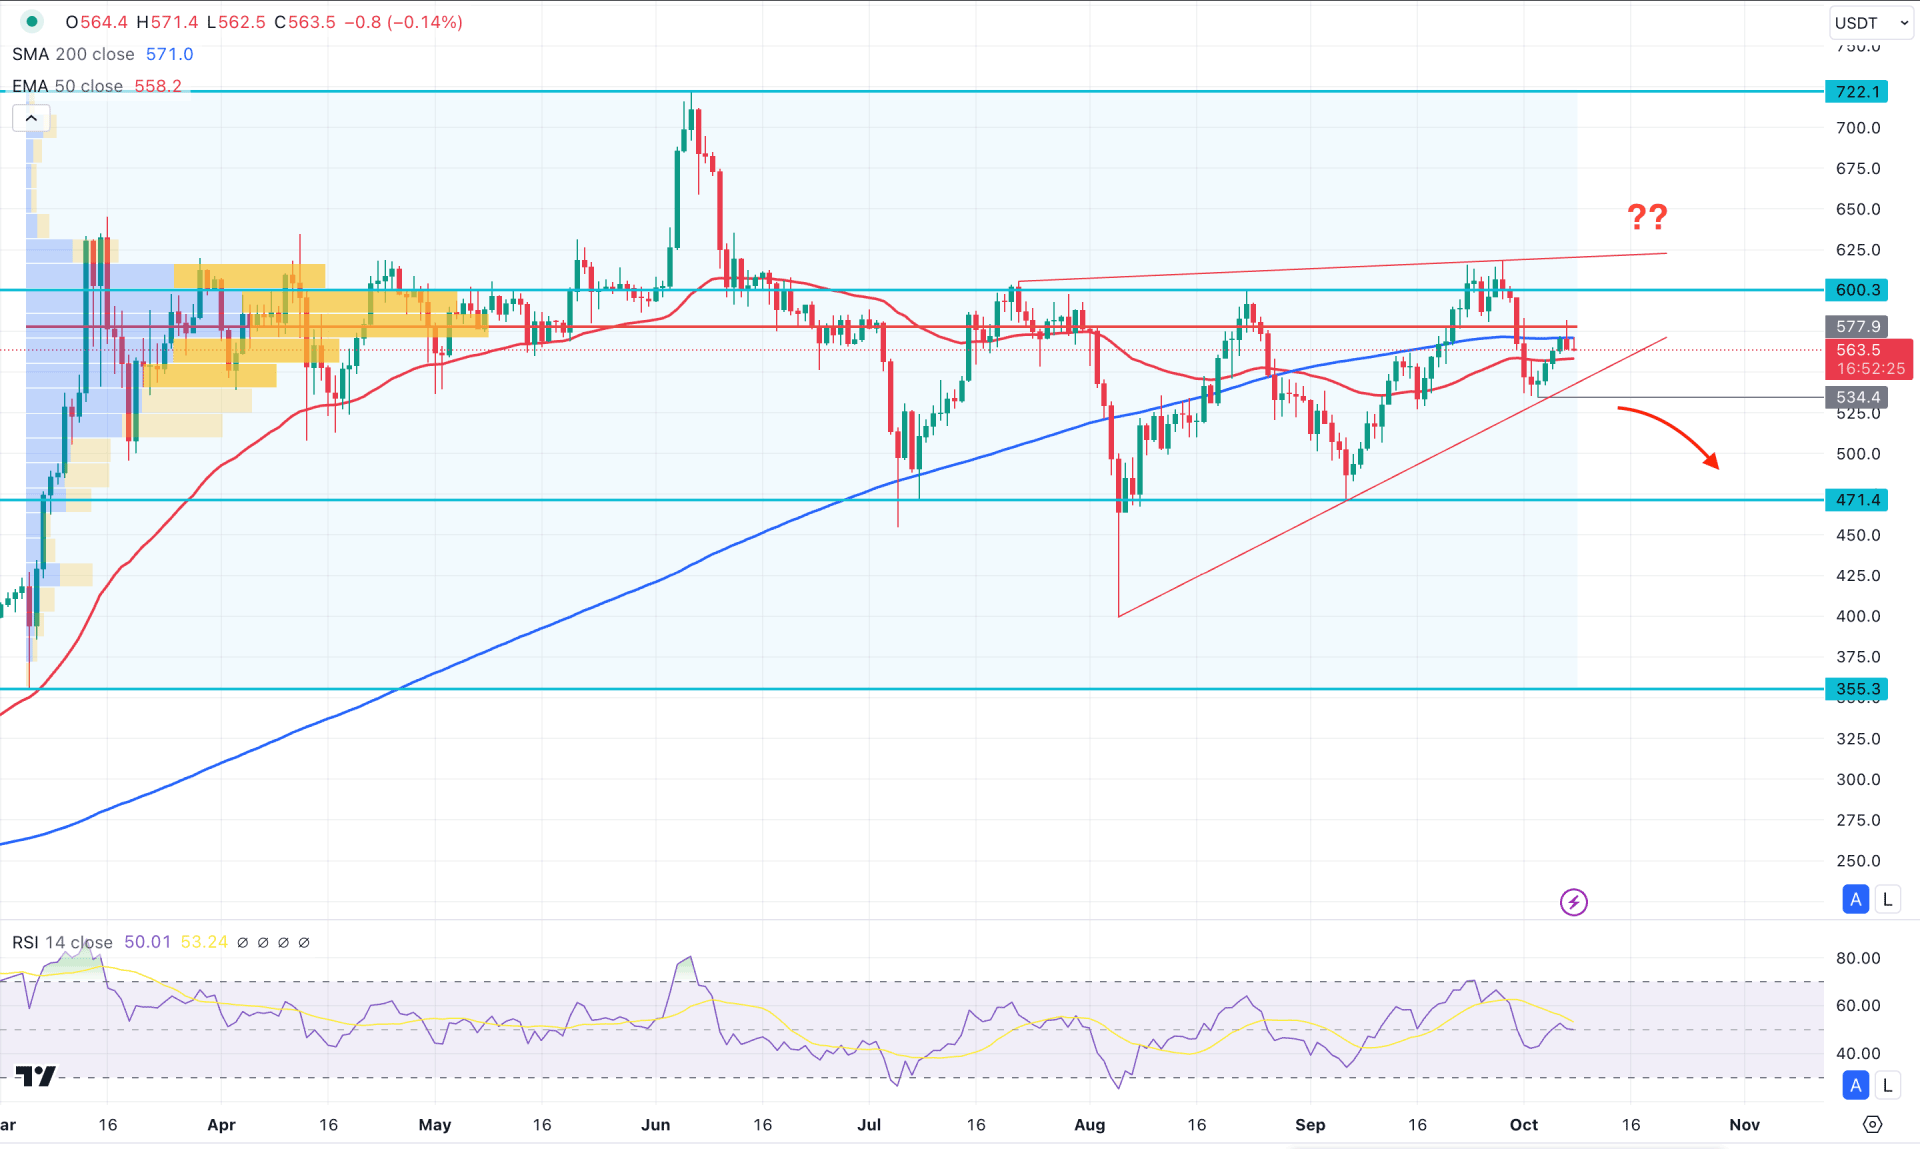
Coming to the volume structure- the daily chart from Binance shows an active selling pressure as the most active level since March 2024 is above the current price. In that case, any bullish reversal might be a long opportunity once this high volume level is violated.
In the daily chart, the 200-day Simple Moving Average is above the current price, while the 50-day Exponential Moving Average is below it. As the current price hovers within these lines, we may expect a clear trend after a valid breakout.
In the secondary indicator window, the Relative Strength Index (RSI) shows a downside pressure as the current line moves below the neutral 50.00 line.
Based on the daily market outlook of BNB/USDT, the ongoing selling pressure from the 200-day SMA needs a valid break below the Rising Wedge support. In that case, a daily candle below the 534.40 level could lower the price towards the 471.40 support level. However, a bearish liquidity sweep from the 534.40 to 500.00 area is possible, as a valid reversal can resume the existing trend.
On the other hand, an immediate bullish reversal with a daily close above the 577.90 high could continue, taking the price higher at the 722.10 resistance level.

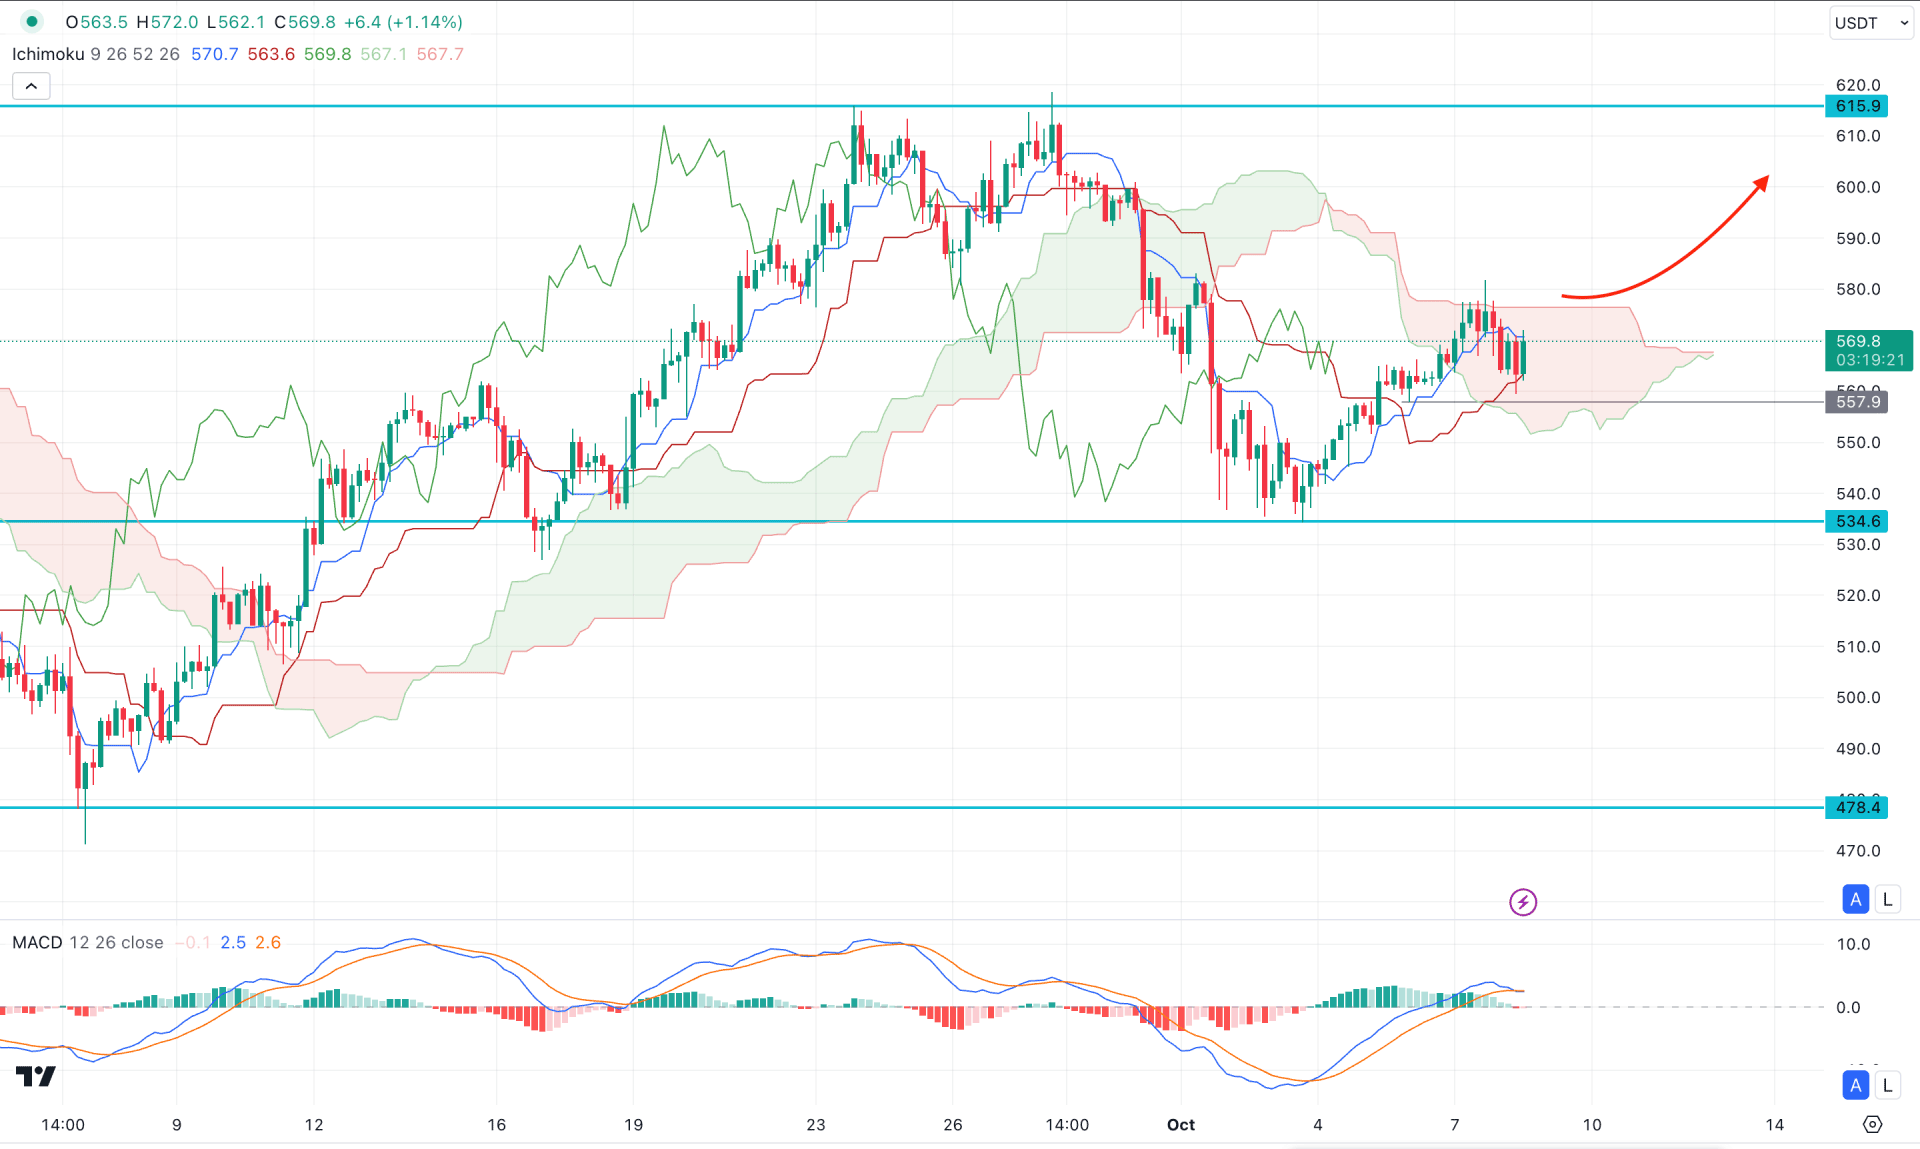
In the H4 timeframe, the corrective momentum is visible as the recent price hovers within the Ichimoku Cloud zone. As the recent price aimed higher from the 534.60 support level, investors might face a bullish continuation from the current area.
In the future cloud, the Senkou Span A aimed higher and reached the Senkou Span B level. In that case, a valid flip could provide a secondary signal of the trend reversal toward the buyers’ side.
In the indicator window, a sideways momentum is visible as the current signal line is flat above the neutral point.
Based on the H4 outlook, a bullish continuation with an H4 candle above the cloud high could provide a high probability of a long opportunity, towards the 615.90 resistance level.
On the other hand, a deeper discount is possible from the 550.00 to 543.00 area but a bearish pressure below the 530.00 level might open the room for reaching the 500.00 area.

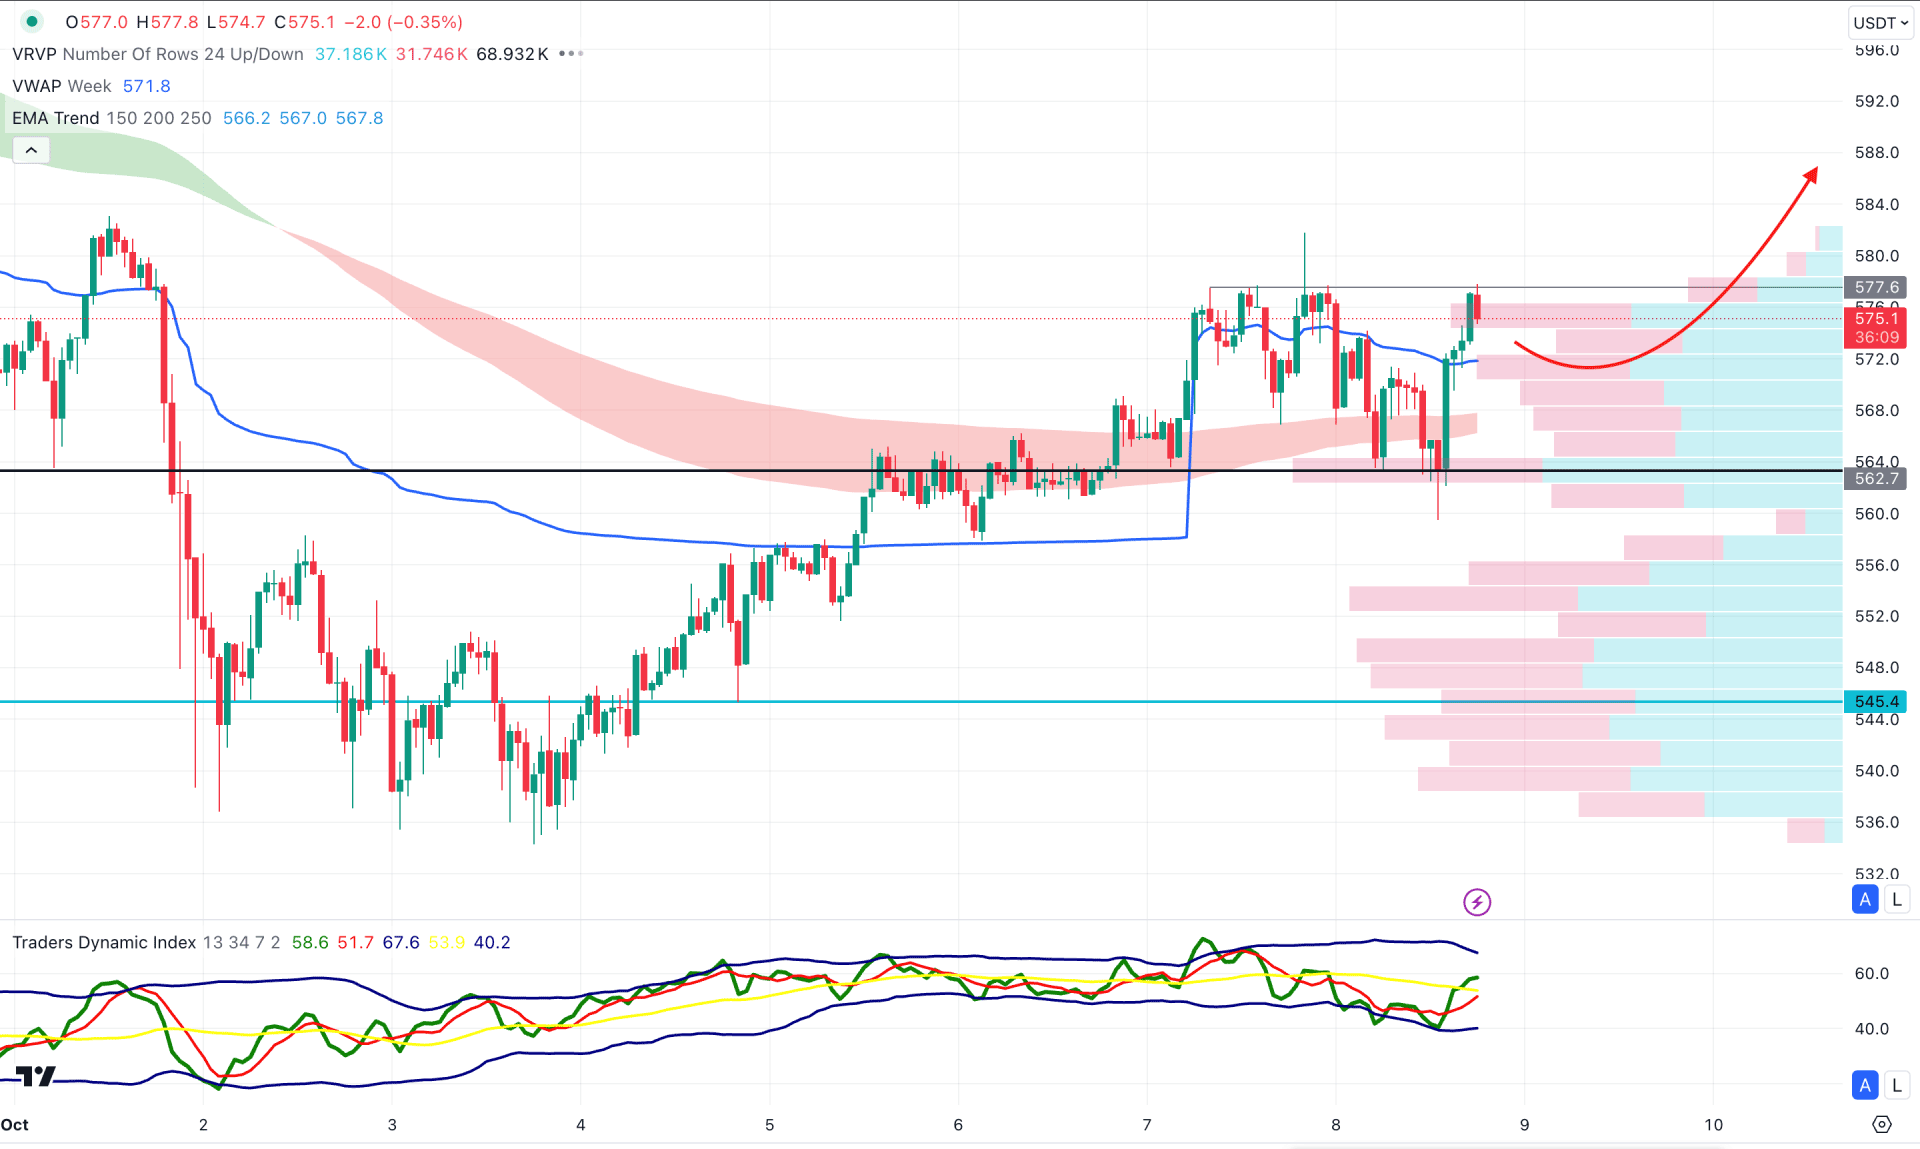
In the intraday BNB/USDT chart, ongoing buying pressure is visible as the current price hovers above the visible range of the high-volume line. Moreover, the MA wave supports the buying pressure by remaining below the current price.
Based on this outlook, a bullish rebound is possible as long as the high volume support is protected. Any bullish reversal from the 570.00 to 562.00 zone could open a long opportunity, aiming for the 600.00 level.
However, breaking below the 562.00 level with a bearish daily close could open a short opportunity, towards the 500.00 psychological area.
Based on the current multi-timeframe analysis, the ongoing buying pressure could resume once the sufficient downside correction is over. As the current price hovers within a rising wedge pattern, investors should closely monitor how the price trades at the wedge support to aim for the future price.