Published: December 3rd, 2024
BEAMX is trading 175% higher from the monthly bottom, which signals potential growth from the larger accumulation. Moreover, the 70.73% wale holding of this token signals potential volume, which supports the ongoing bulls.
The Merit Circle DAO powers the Beam gaming network and its native cryptocurrency asset, the $BEAM token. In the ecosystem known as Beam, developers, and players collaborate to influence the direction of the gaming sector. One of its main parts is the Beam SDK, a versatile software advancement kit that gives game developers various options for structuring and powering their in-game blockchain components.
$BEAM is necessary to communicate with Beam. The Beam network uses this native cryptocurrency asset to fund transactions. This enables a smooth, engaging gaming experience by encompassing transferring assets and every connection with smart contract agreements on the Beam network.
In addition to serving as the gas token that powers the Beam system, $BEAM is the central component of the Merit Circle DAO's governance. This decentralized autonomous organization (DAO) was launched early in 2021 with the goal of transforming the gaming sector. Owners of the $BEAM token can participate in this DAO's governance.
Let's see the further aspect of this coin from the BEAMX/USDT technical analysis:

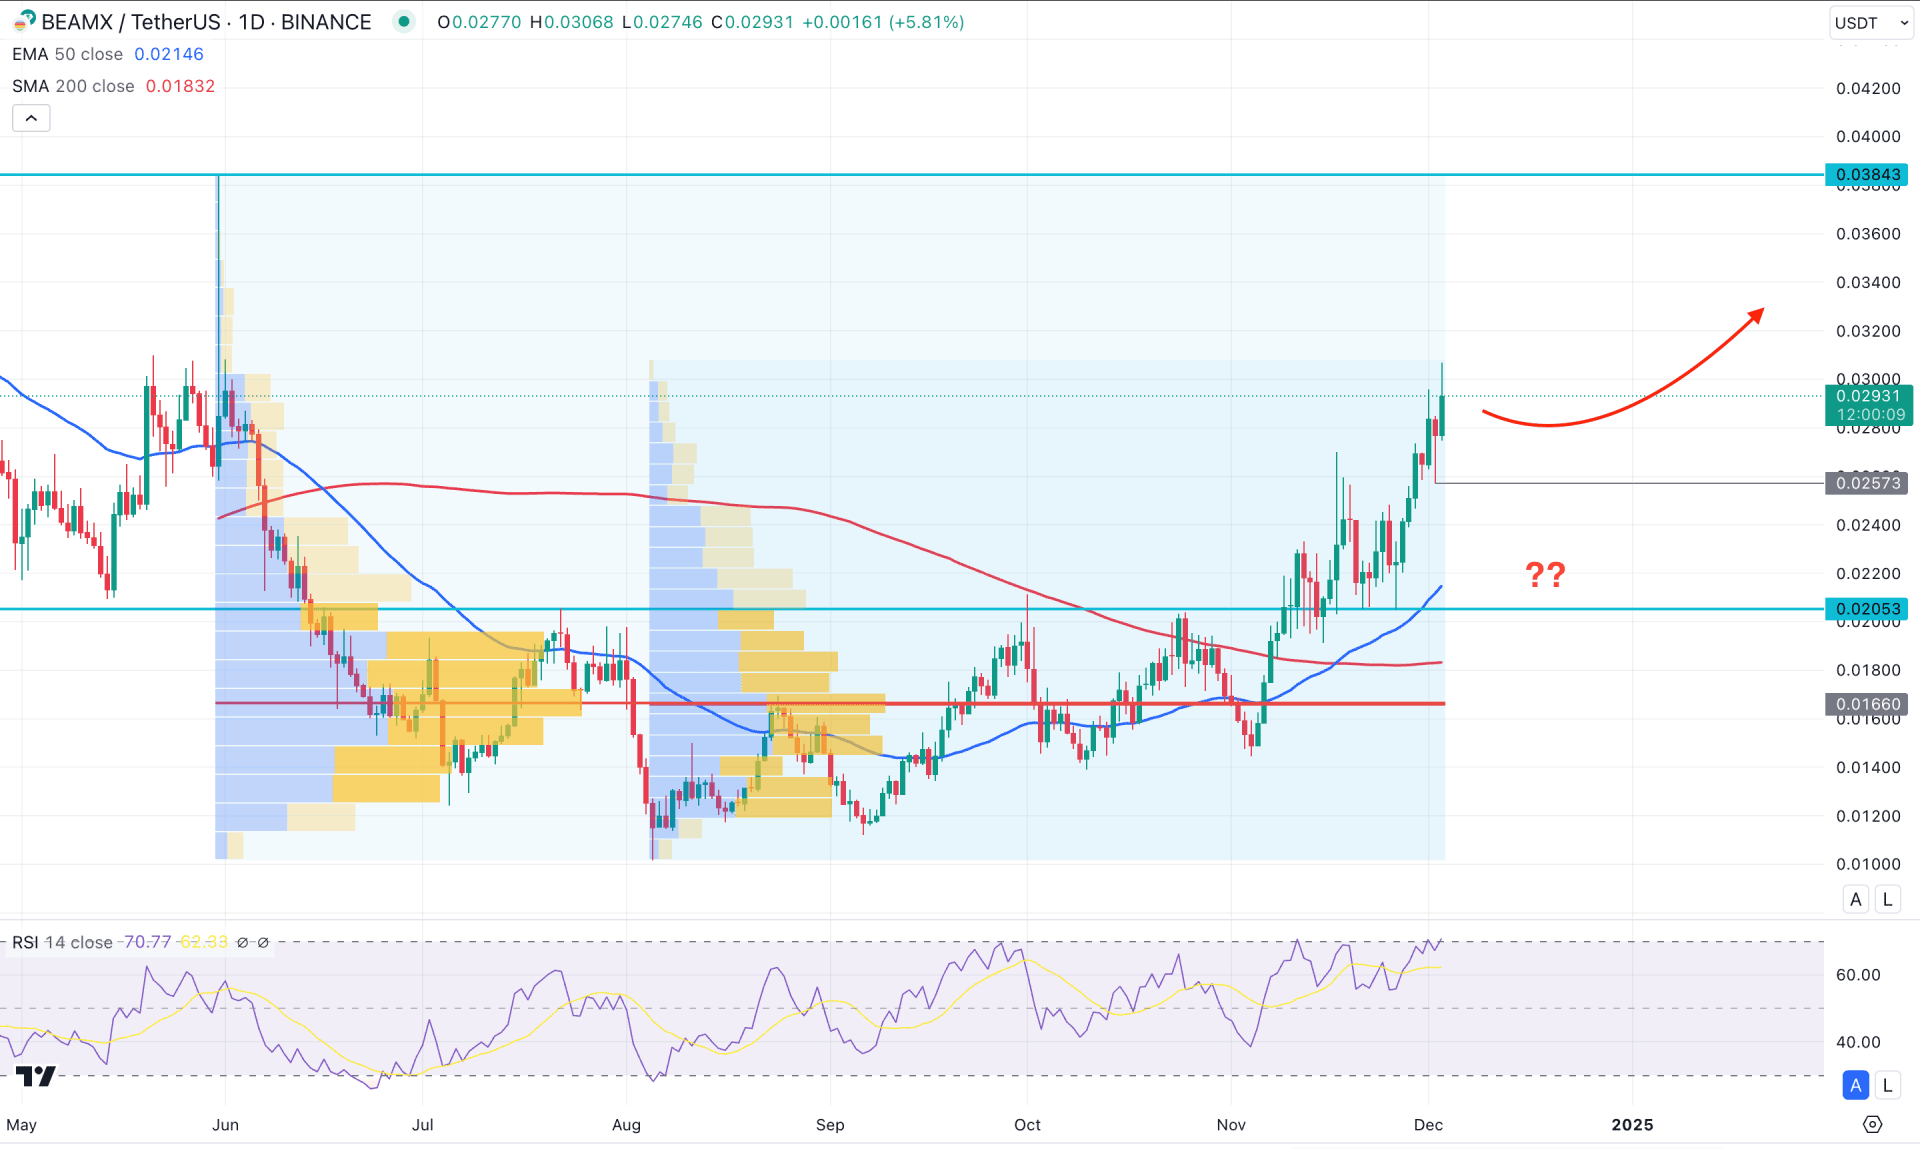
In the daily chart of BEAMX/USDT, the ongoing market momentum is bullish, where a valid U-shape recovery supports the current buying pressure. Primarily, as long as the near-term support levels are protected, the price is more likely to extend as a continuation of the current trend.
In the broader context, an ongoing bullish momentum is visible in the monthly time frame, where the current price hovers above the crucial range. As November came with a bullish monthly close after four corrective month's, investors should monitor how the price trades above this zone. Any sign of holding the momentum above the November high could be a potential long-term opportunity.
In the volume structure, the highest activity levels since June 2024 and August 2024 are at the same price, signaling a larger buyer accumulation at the bottom.
Looking at the main price chart, the 200-day SMA and 50-day EMA are below the current price, signaling an ongoing bullish trend. Moreover, a bullish crossover is visible in dynamic lines, suggesting a Golden Cross continuation opportunity.
Based on the daily outlook of BEAMX/USDT, the current top of the existing range is at the 0.0384 level, which is the upper limit for a long opportunity. In this case, sufficient bullish pressure after testing the 50-day EMA could be a long opportunity.
In the bearish case, the overbought RSI signals a potential intraday top formation from where a minor selling pressure could come.
A break below the 0.0257 support level could trigger the short-term selling opportunity, aiming for the 50 day EMA line. However, an extended selling pressure below the 0.0200 level could initiate a major market shift towards the 0.0140 level.

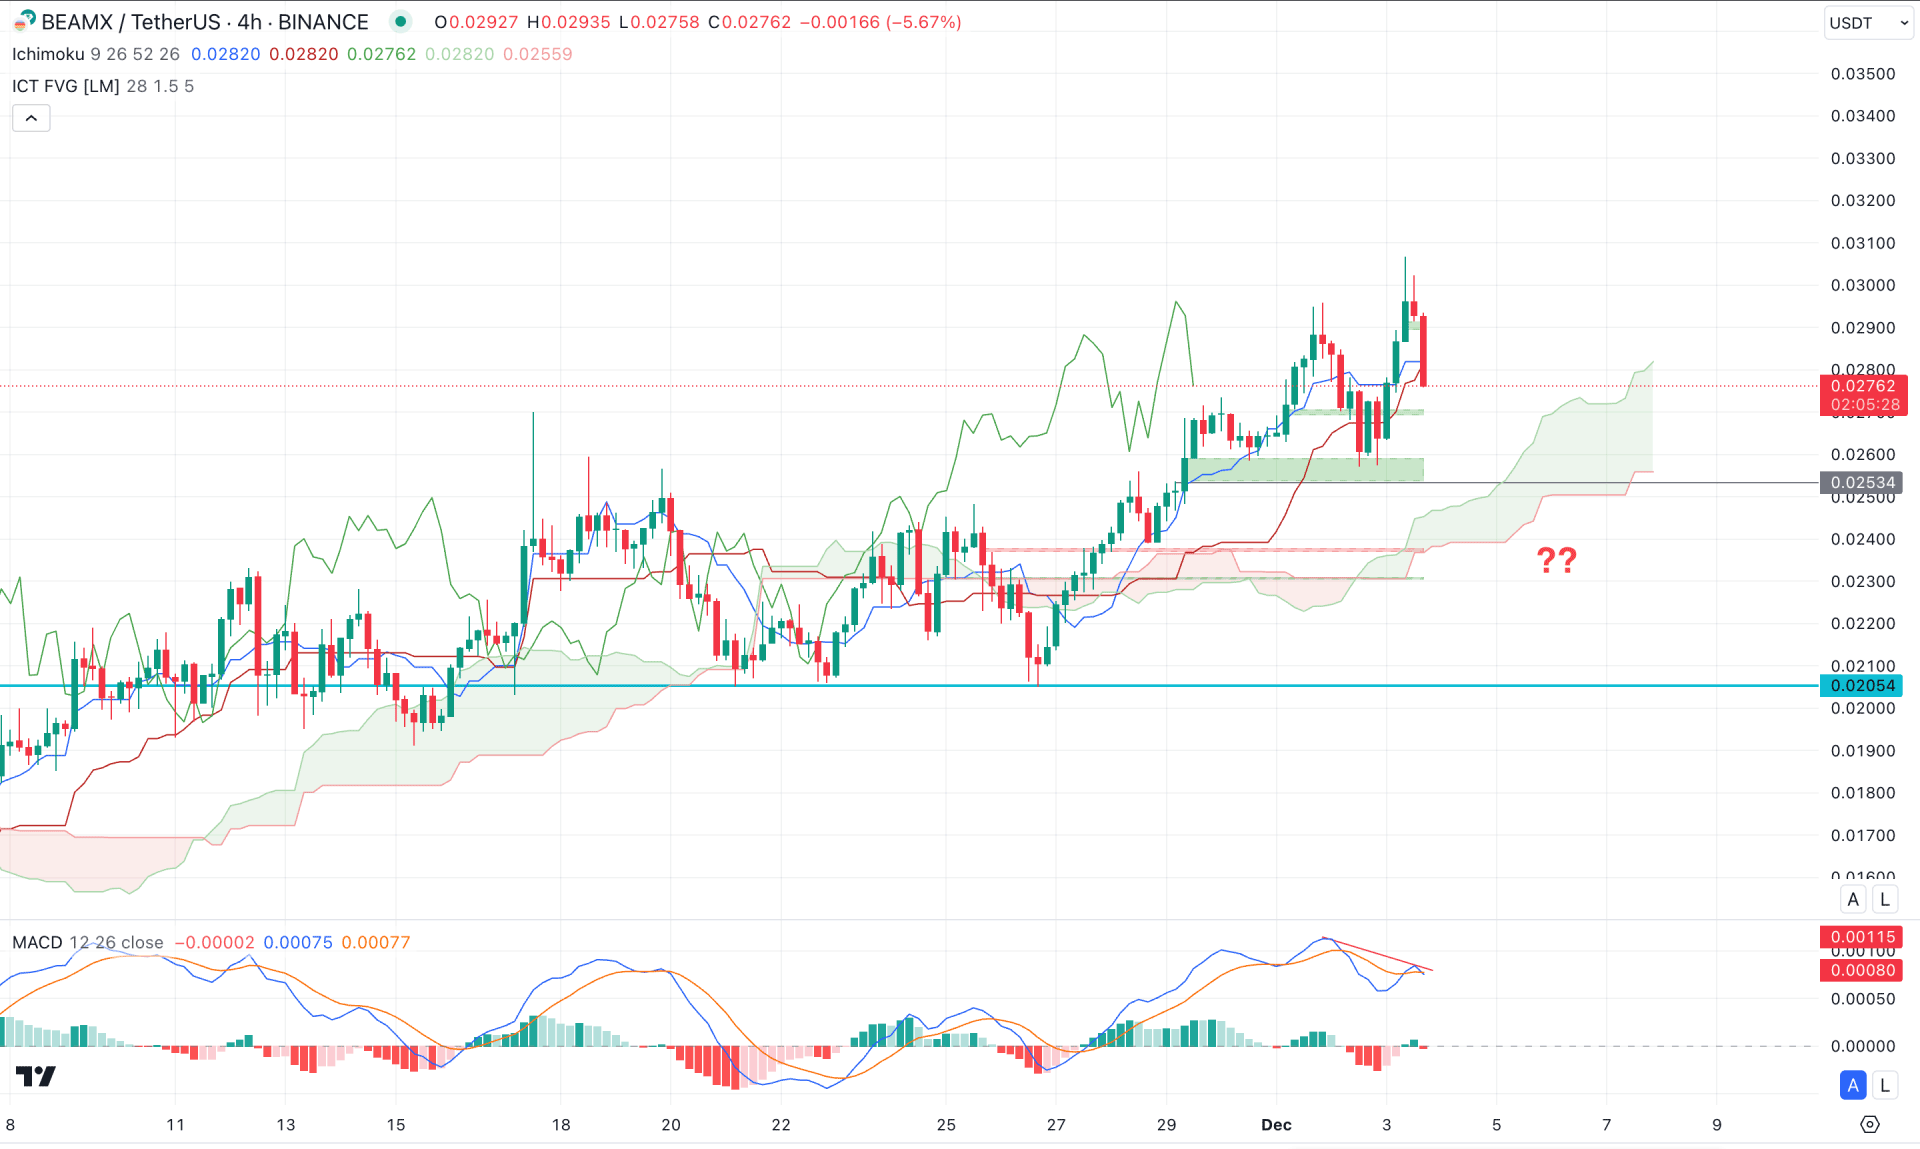
In the H4 timeframe, the ongoing buying pressure on the BEAMX price is questionable. Although the price is pushing higher above the cloud zone, the momentum looks weaker from the divergence formation.
However, the Futures Cloud still has potential for bulls as both Senkou lines keep moving higher in the forward chart.
The indicator window shows a similar structure, where a potential top is visible from the Signal lines. Following the divergence, the MACD Histogram hovers at the neutral zone, from where a bearish shift in the Histogram could validate the short opportunity.
Based on the H4 structure, the most recent buying pressure has left some price inefficiency below the dynamic Kijun Sen line. However, a deeper discount is possible once the price is aimed below the 0.0253 low with a bearish H4 close.
On the bullish side, an immediate recovery from the 0.0270 to 0.0250 area might trigger the long opportunity, aiming for the 0.0330 area.

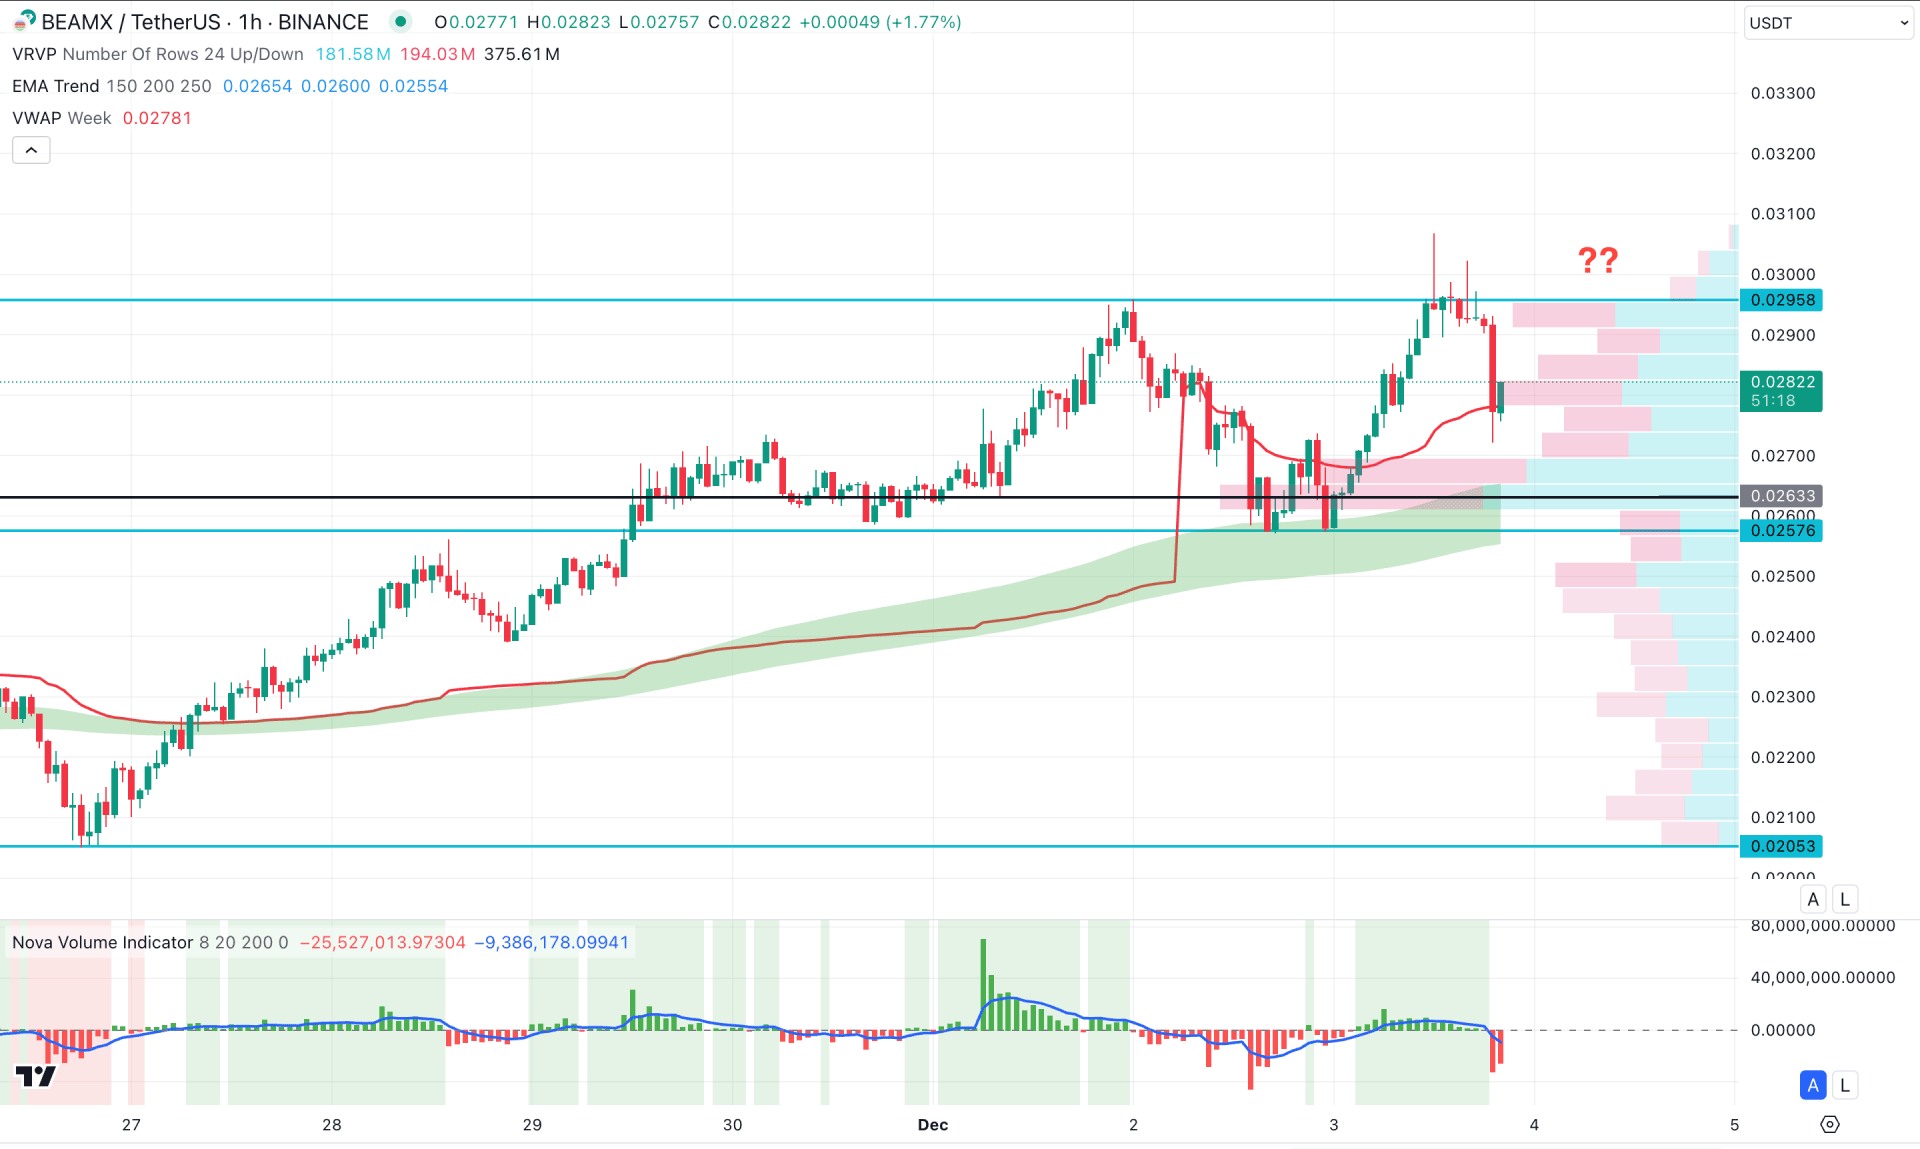
In the hourly time frame, the recent price shows an ongoing buying pressure where the recent bullish break of structure came from a valid double bottom formation.
Moreover, the major market momentum remains bullish as shown by the bullish slope in the Moving Average wave. The most recent price is facing support from the weekly VWAP level and investors should monitor how the price reacts in this zone.
A sell-side volume generation is already visible in the indicator window, where a bearish H1 candle below the MA wave could validate the short opportunity.
On the bearish side, the immediate support level is peasant at the 0.0263 level, where a break below this line could lower the price towards the 0.0240 area.
Following the major market structure, BEAMX has an open space above the latest multi month range. As the price is already facing a buying pressure with a solid bottom formation, investors might expect a continuation opportunity from the intraday dip.