Published: December 12th, 2024
The Australian dollar (AUD) has been losing ground against the US dollar (USD) throughout the week. However, following the publication of domestic combined labor market data, the AUD continues to strengthen a bit in the intraday chart.
In November, 14,535,500 people were employed, up 35,600 from the seasonally average employment change. This was higher than both the anticipated number of 25,000 and the previously reported reading of 12,100. Meanwhile, the unemployment rate dropped below market projections of 4.2% to 3.9%, the lowest level since March.
The US dollar (USD) was generally stronger after the publication of the United States inflation data on Wednesday, which caused difficulties for the AUDUSD pair. In November, the nation's Consumer Price Index (CPI) increased from 2.6% in October to 2.7% compared to the previous year.
According to the headline CPI, the market consensus was met with a reading of 0.3% MoM. In contrast, the core CPI, which does not include volatile prices for food and energy, increased 3.3% year over year and, as anticipated, by 0.3% month over month in November.
Despite the most recent US inflation report, the Federal Reserve (Fed) is expected to cut rates at the December meeting the following week. The CME FedWatch Tool shows that investors are now offering a nearly 99% possibility of a 25-basis point Fed rate cut on December 18.
Let's see the upcoming price direction of this pair from the AUDUSD technical analysis:

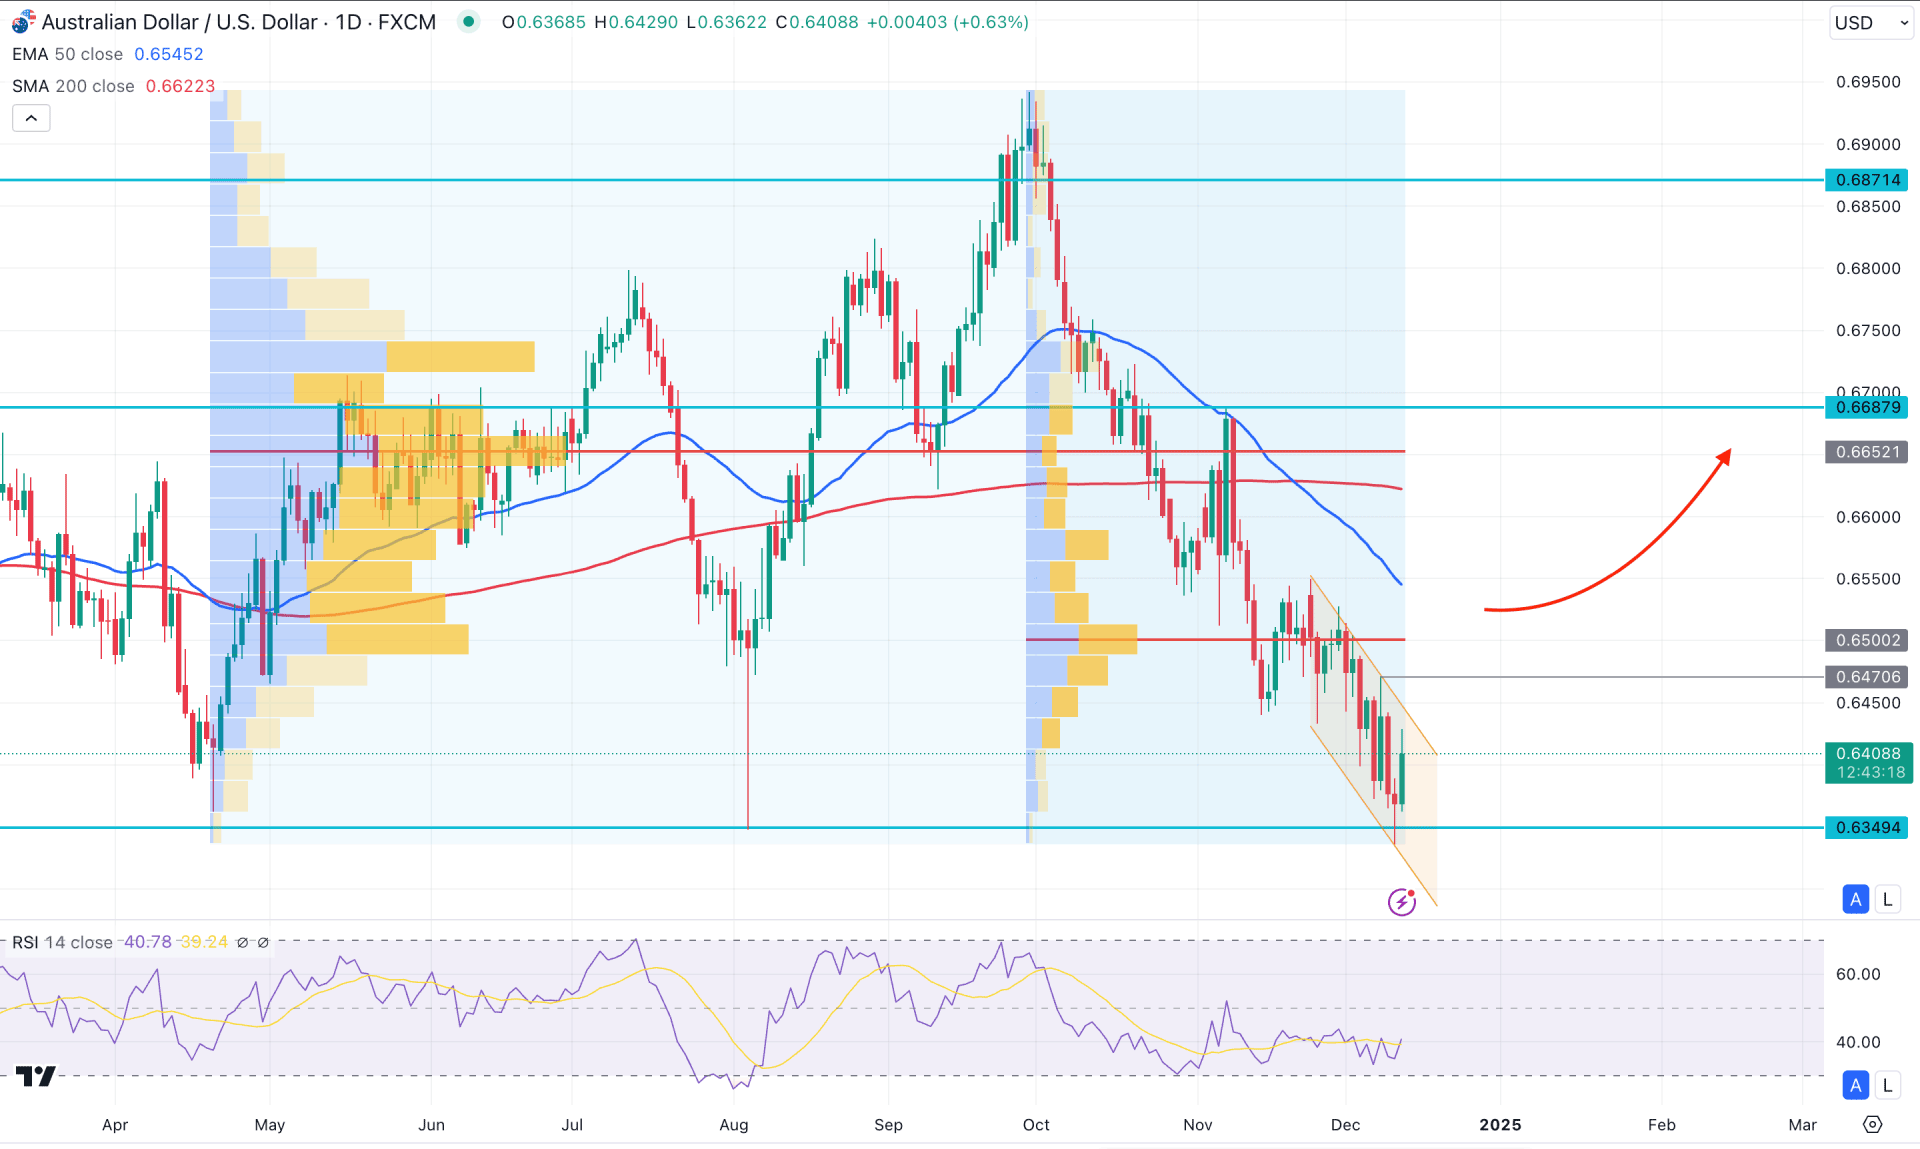
In the daily chart of AUDUSD, the recent price showed an extended selling pressure. Also, the most recent price moved below the crucial August 2024 low and made a new yearly bottom. As the current price is trading at an extremely discounted price, investors might expect an upward continuation with a high probability of a long approach.
In the higher timeframe, the price has been under selling pressure for three consecutive months with no solid bottom formation. Moreover, the latest weekly candle closed below the multi-week low, signaling a downward continuation. In that case, investors should monitor how the price trades at the bottom, as a valid bullish recovery is needed before confirming the trend reversal.
Looking at the volume structure, the most active level since August 2024 is above the current price and working as a resistance level. Another high volume level from the October 2024 peak is also above the current price, working as a confluence selling pressure. Based on the high-volume structure, investors should wait for a valid recovery above the near-term high-volume line before confirming a trend reversal.
In the main price chart, the 50-day EMA crossed below the 200-day SMA, signaling a death cross formation. However, the most recent price extended below the 50-day EMA line, from where a bullish reversal is pending as a mean reversion.
In the indicator window, the Relative Strength Index (RSI) remains below the 50.00 line for more than three months. Moreover, the current RSI level is yet to visit the oversold 30.00 line, signaling a pending bearish continuation.
Based on the daily outlook of AUDUSD, the extended selling pressure with the yearly low price could attract bulls into the market. In that case, a bullish daily close above the 0.6470 level could offer an early bullish opportunity. Moreover, overcoming the 0.6500 level with a consolidation could signal a conservative long approach, targeting the 0.7000 psychological level.
On the bearish side, the ongoing descending channel is present, where any selling signal from the resistance area could create a new swing low.

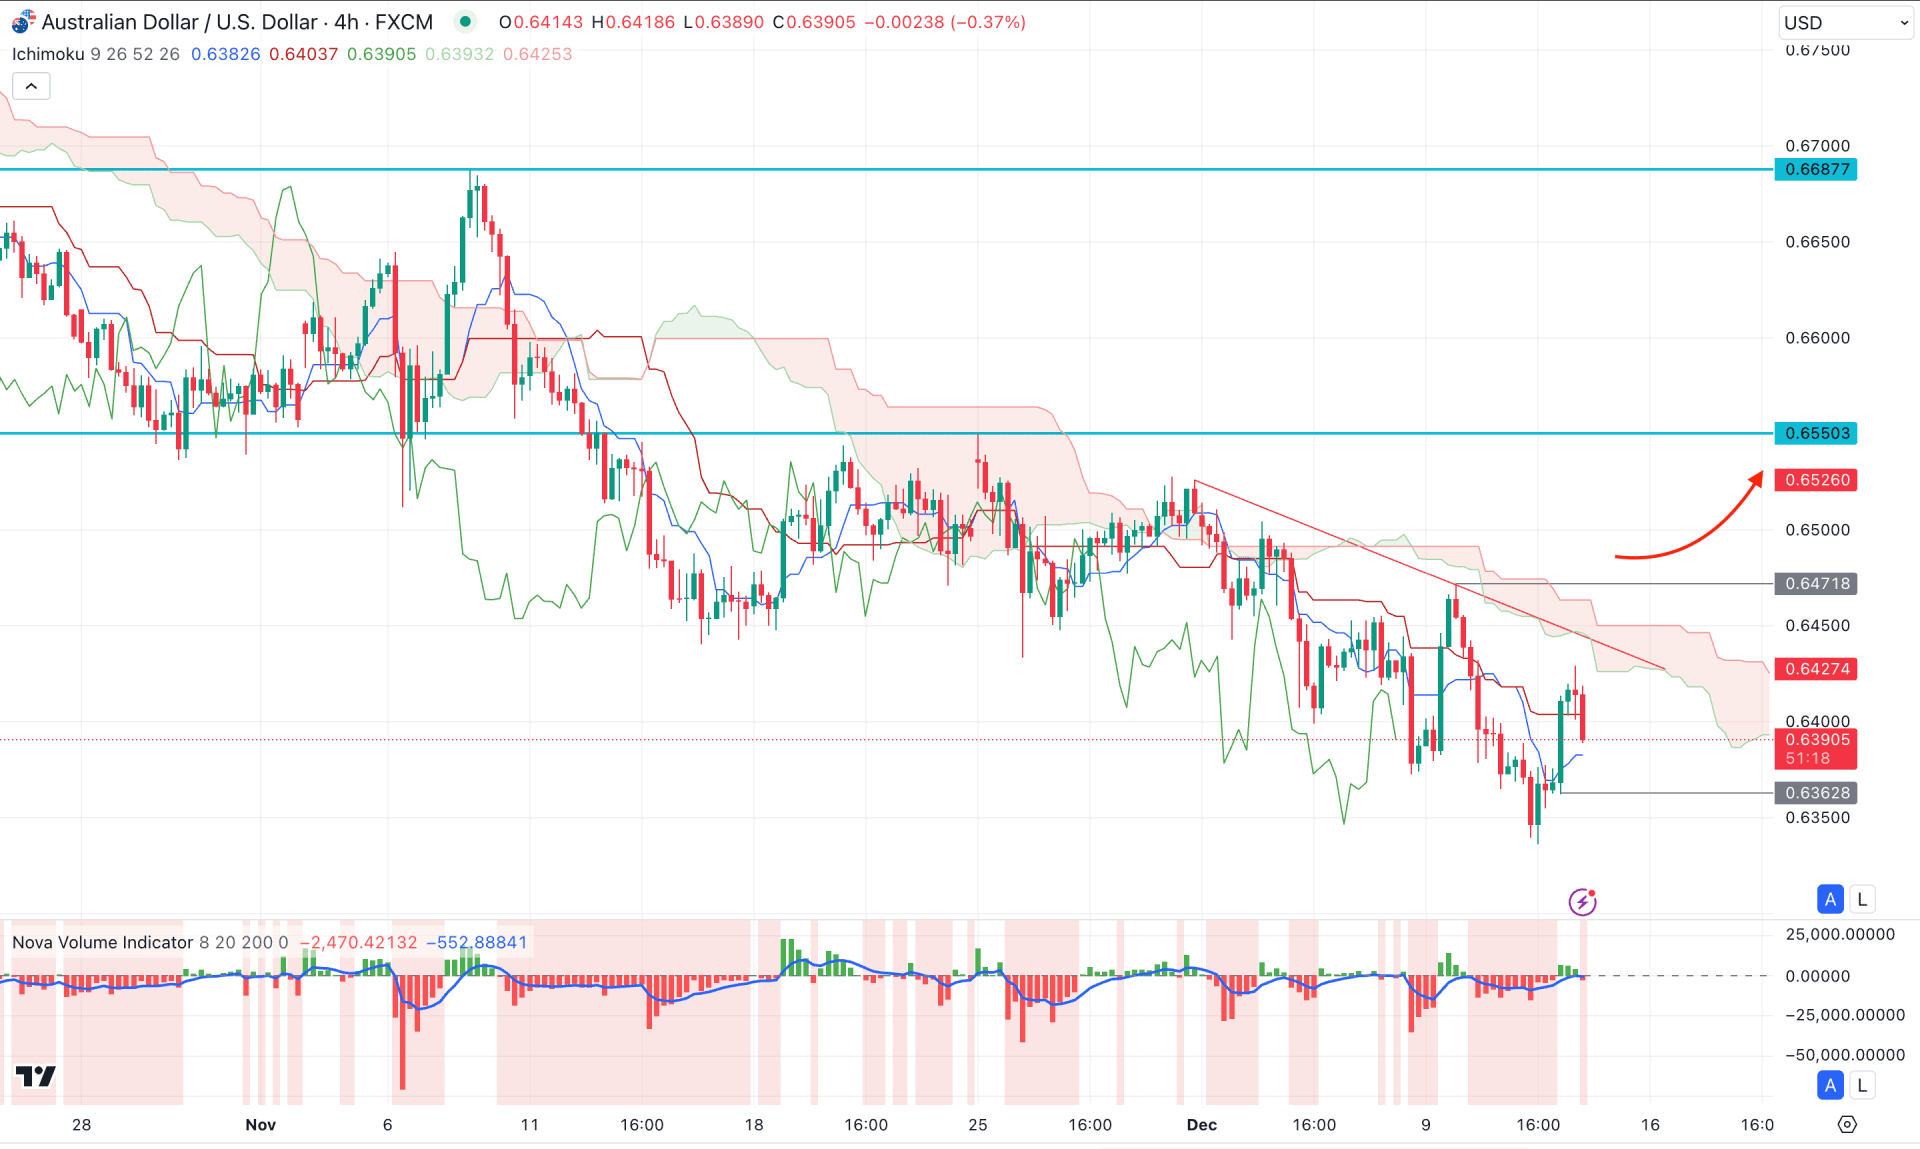
In the H4 timeframe, the AUDUSD price is trading under bearish pressure, with corrective downside momentum visible below the cloud area. However, the Futures Cloud became flat as both Senkou Lines moved parallel after the latest bearish swing.
In the indicator window, the volume Histogram flipped the position from positive to negative, signalling a sell-side volume generation.
Based on the H4 structure, a potential bullish opportunity could come after overcoming the trendline resistance level. In that case, a bullish H4 close above the 0.6417 level could signal a conservative long approach towards the 0.6687 area.
On the other hand, a failure to breach the Ichimoku Cloud zone with an immediate bearish H4 candle below the Kijun Sen line might resume the existing bearish trend towards the 0.6300 area.

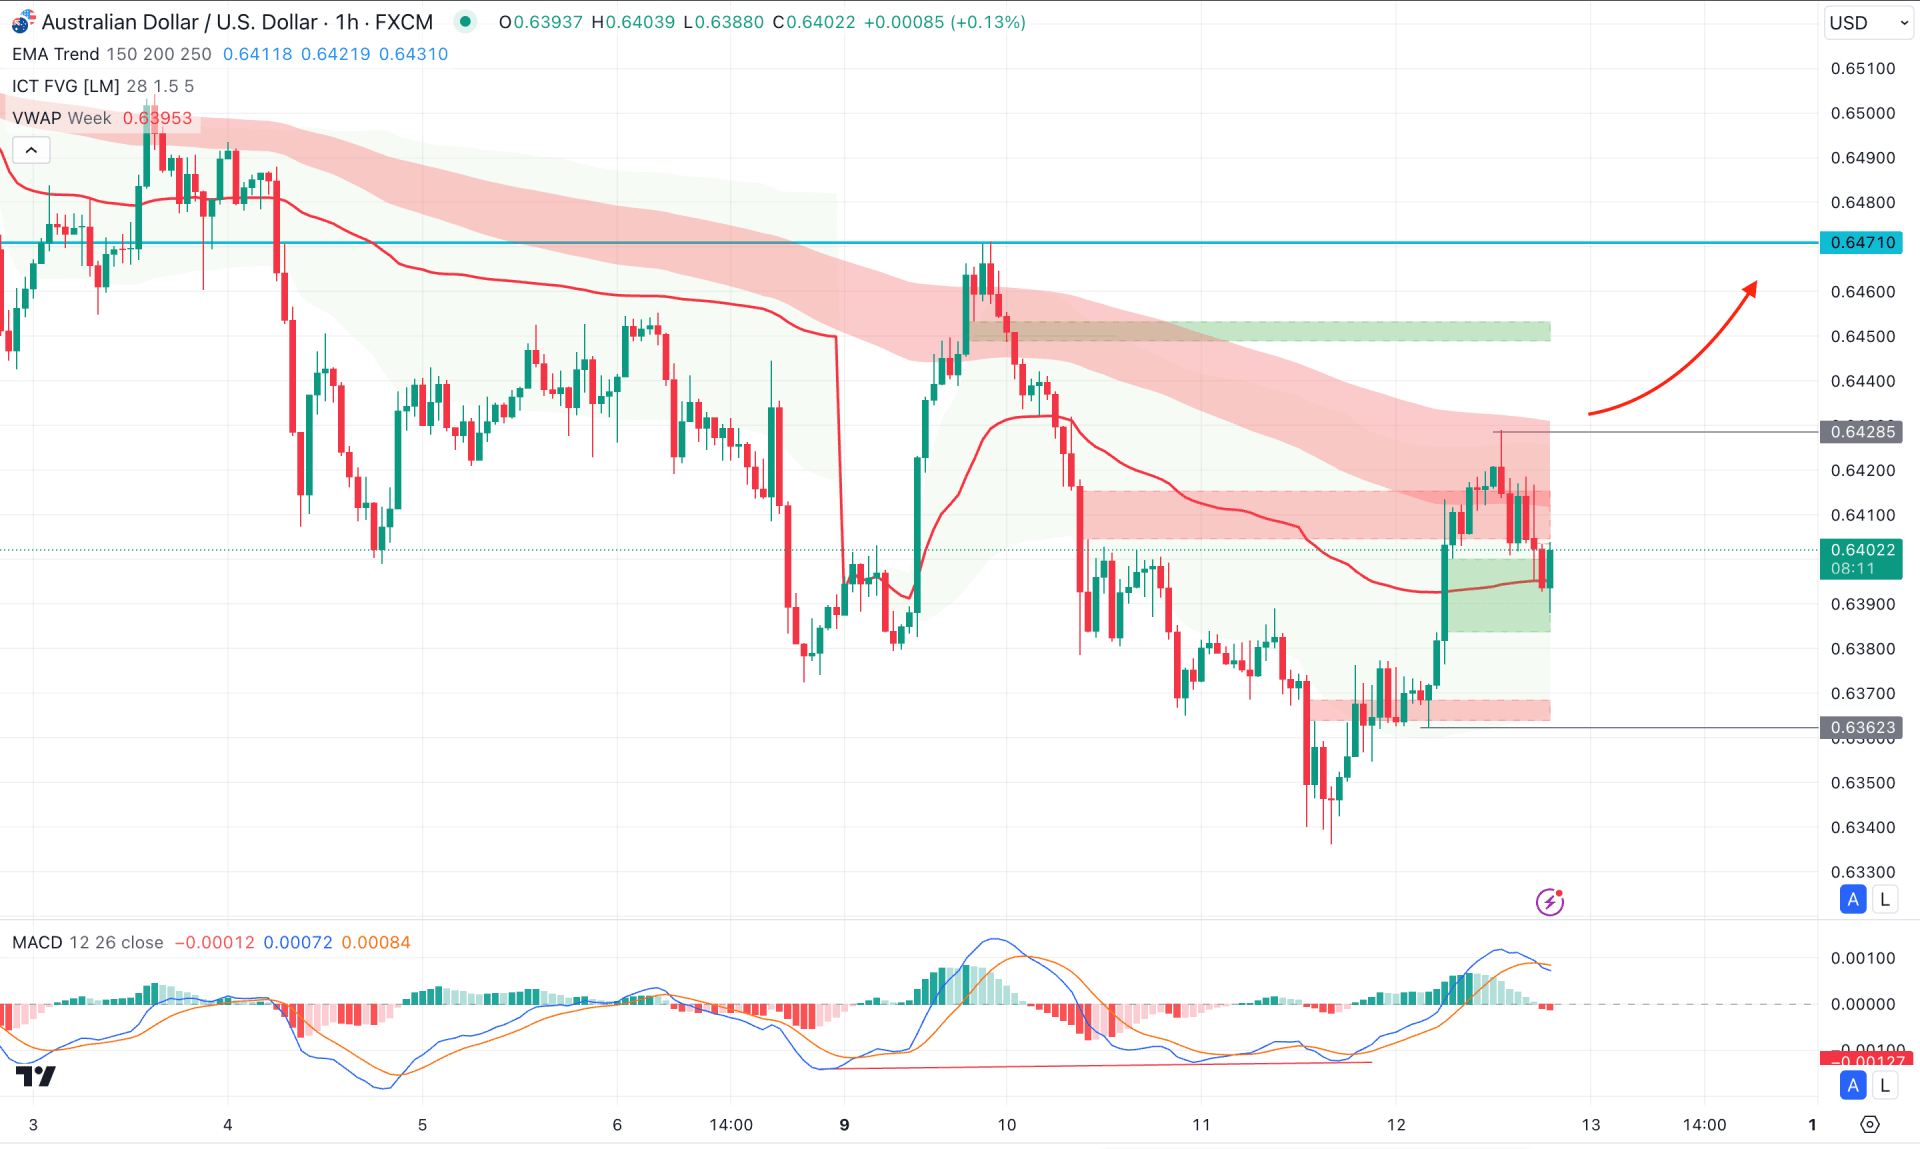
In the hourly timeframe, a strong bullish reversal is visible, where the current price is facing a resistance from the EMA cloud area. However, an immediate bearish rebound has come taking the price at the weekly VWAP line.
In the indicator window, the MACD Histogram formed a bearish crossover at the overbought area, while the current Histogram is bearish.
Based on this structure, any immediate downside pressure with an hourly close below the VWAP line could offer an immediate short opportunity, aiming for the 0.6350 level.
On the other hand, 0.6428 is the immediate resistance to focus on, as an immediate bullish break above this line could validate the H4 bottom.
Although AUDUSD is trading at a discounted price, there is no bottom visible to consider a trend change. In that case, investors should closely monitor how the price performs in the intraday chart as one more downside push is pending from the existing selling pressure.