
Published: January 23rd, 2024
Amgen (AMGN), the largest biotechnology drug manufacturer in the world has faced a strong upward pressure of 9.01% in the previous month, outpacing the Medical sector's gain of 3.16% and the S&P 500's increase of 0.94%.
Amgen's forthcoming earnings report is slated for release on February 6, 2024. The current forecast $4.70 EPS represents a 14.91 percent increase compared to the corresponding quarter of the prior year. Present consensus estimates anticipate $8.14 billion in revenue, which signifies an annual growth rate of 18.99%.
Amgen is presently valued at a Forward P/E ratio of 15.35, which indicates a possible undervaluation in comparison to the Forward P/E average of 22.48 for the industry.
Furthermore, Amgen's PEG ratio, which incorporates the anticipated earnings growth rate is currently 2.72, while the Medical-Biomedical and Genetics sector exhibited an average PEG ratio of 1.76.
Should you buy AMGN now? Let’s see the complete outlook from the Amgen Stock (AMGN) technical analysis:
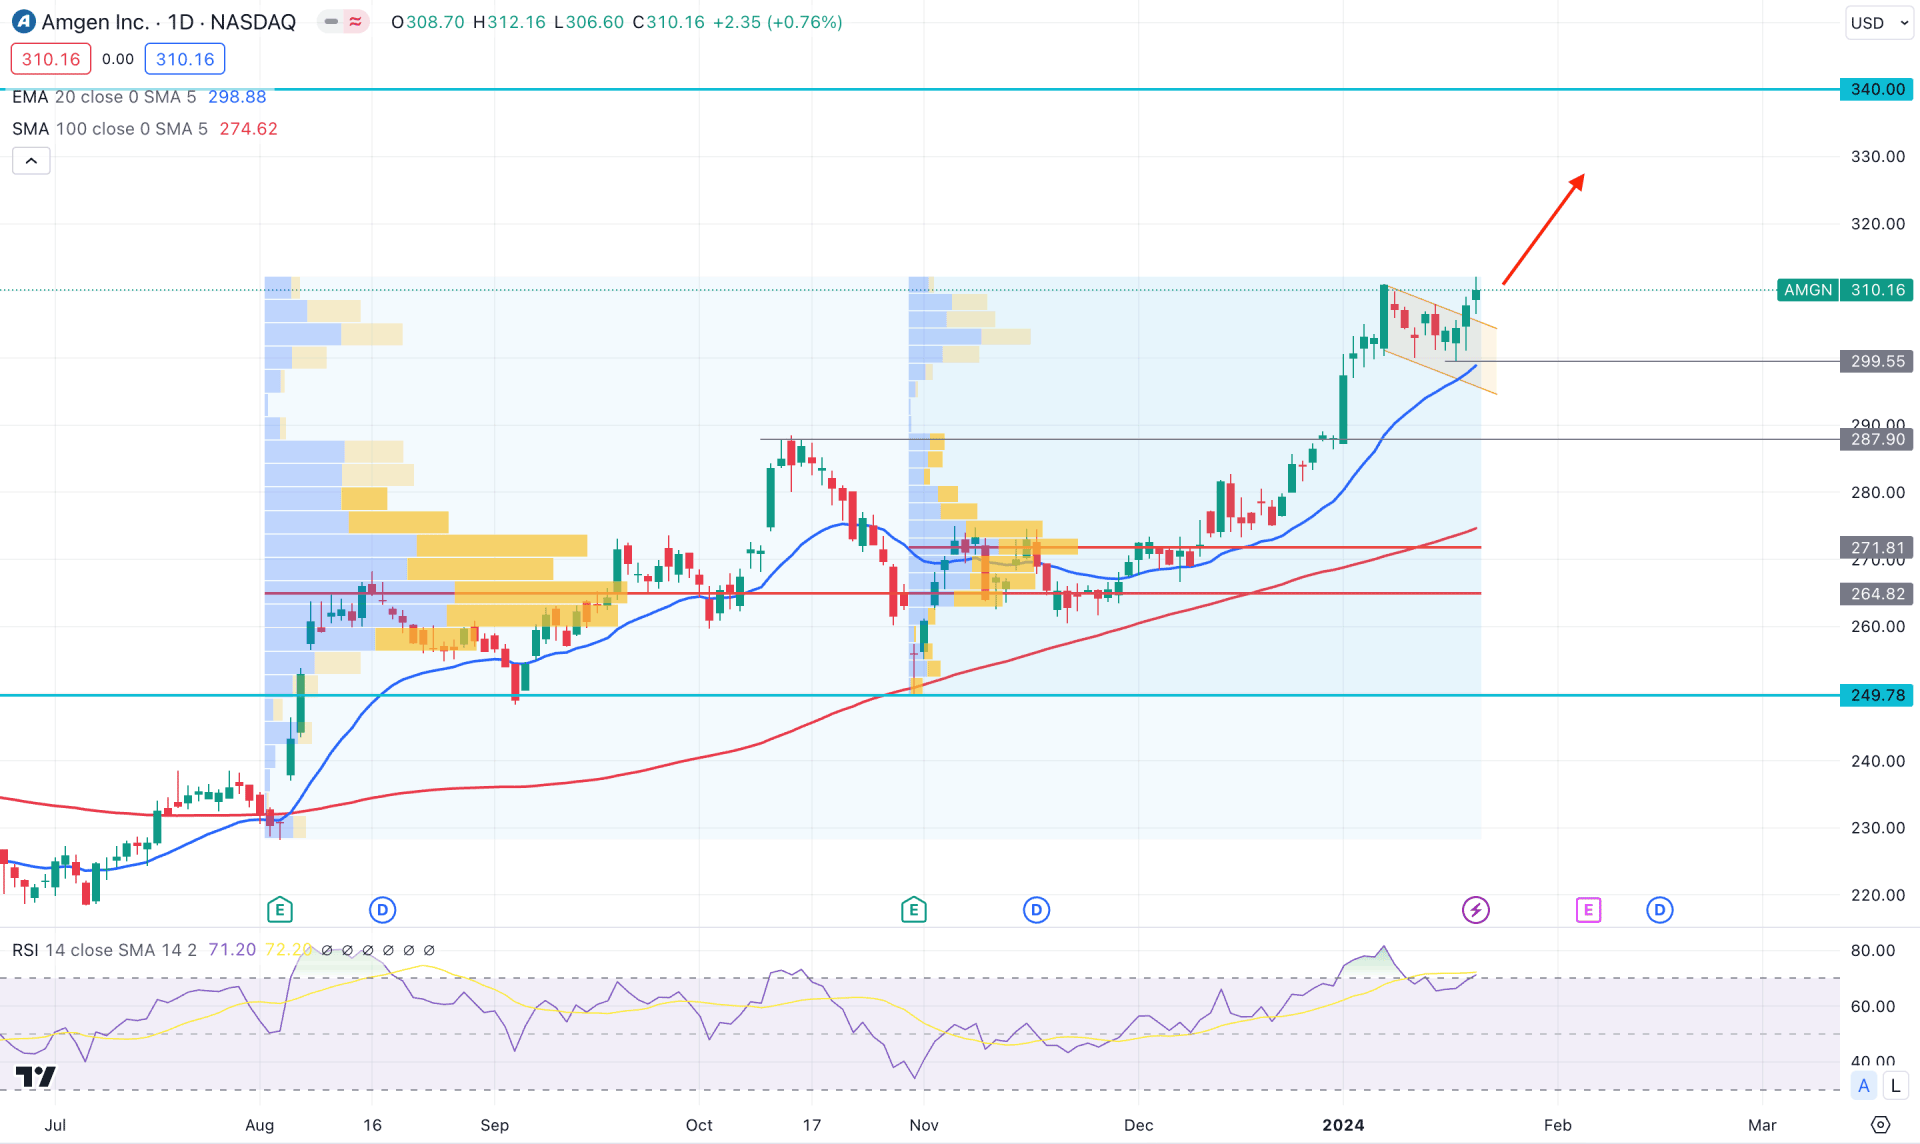
In the daily chart of Amgen Stock (AMGN), the ongoing bullish momentum is valid as it is supported by all moving averages. In that case, the primary aim for this stock is to look for long trades only from a suitable zone.
In the higher timeframe, the current price is at an all-time high level with consecutive three bullish monthly candle formations. However, the recent candle becomes weather in the weekly timeframe, suggesting a possible profit taking.
In the volume structure, a confluence bullish factor is visible as the high volume levels from August 2023 and November 2023 are closer together. As both lines are below the current price, we may expect the buying pressure to extend in the coming weeks.
Coming to the daily timeframe- the ongoing buying pressure is still intact as the latest price formed a descending channel breakout at the all-time high area. Moreover, the 20-day EMA and 100-day SMA are below the current price with a bullish slope.
In the secondary window, the Relative Strength Index (RSI) failed to break below the 68.00 level and rebounded above the 70.00 line.
Based on the current market outlook of AMGN, the price is trading with a bullish continuation, where sufficient profit-taking is pending. Following the recent bullish continuation, a daily close above the 314.00 level could increase the price towards the 340.00 psychological number.
However, a strong bearish exhaustion could change the market trend at any time but a minor downside correction towards the 287.00 to 271.00 area could provide another long opportunity.
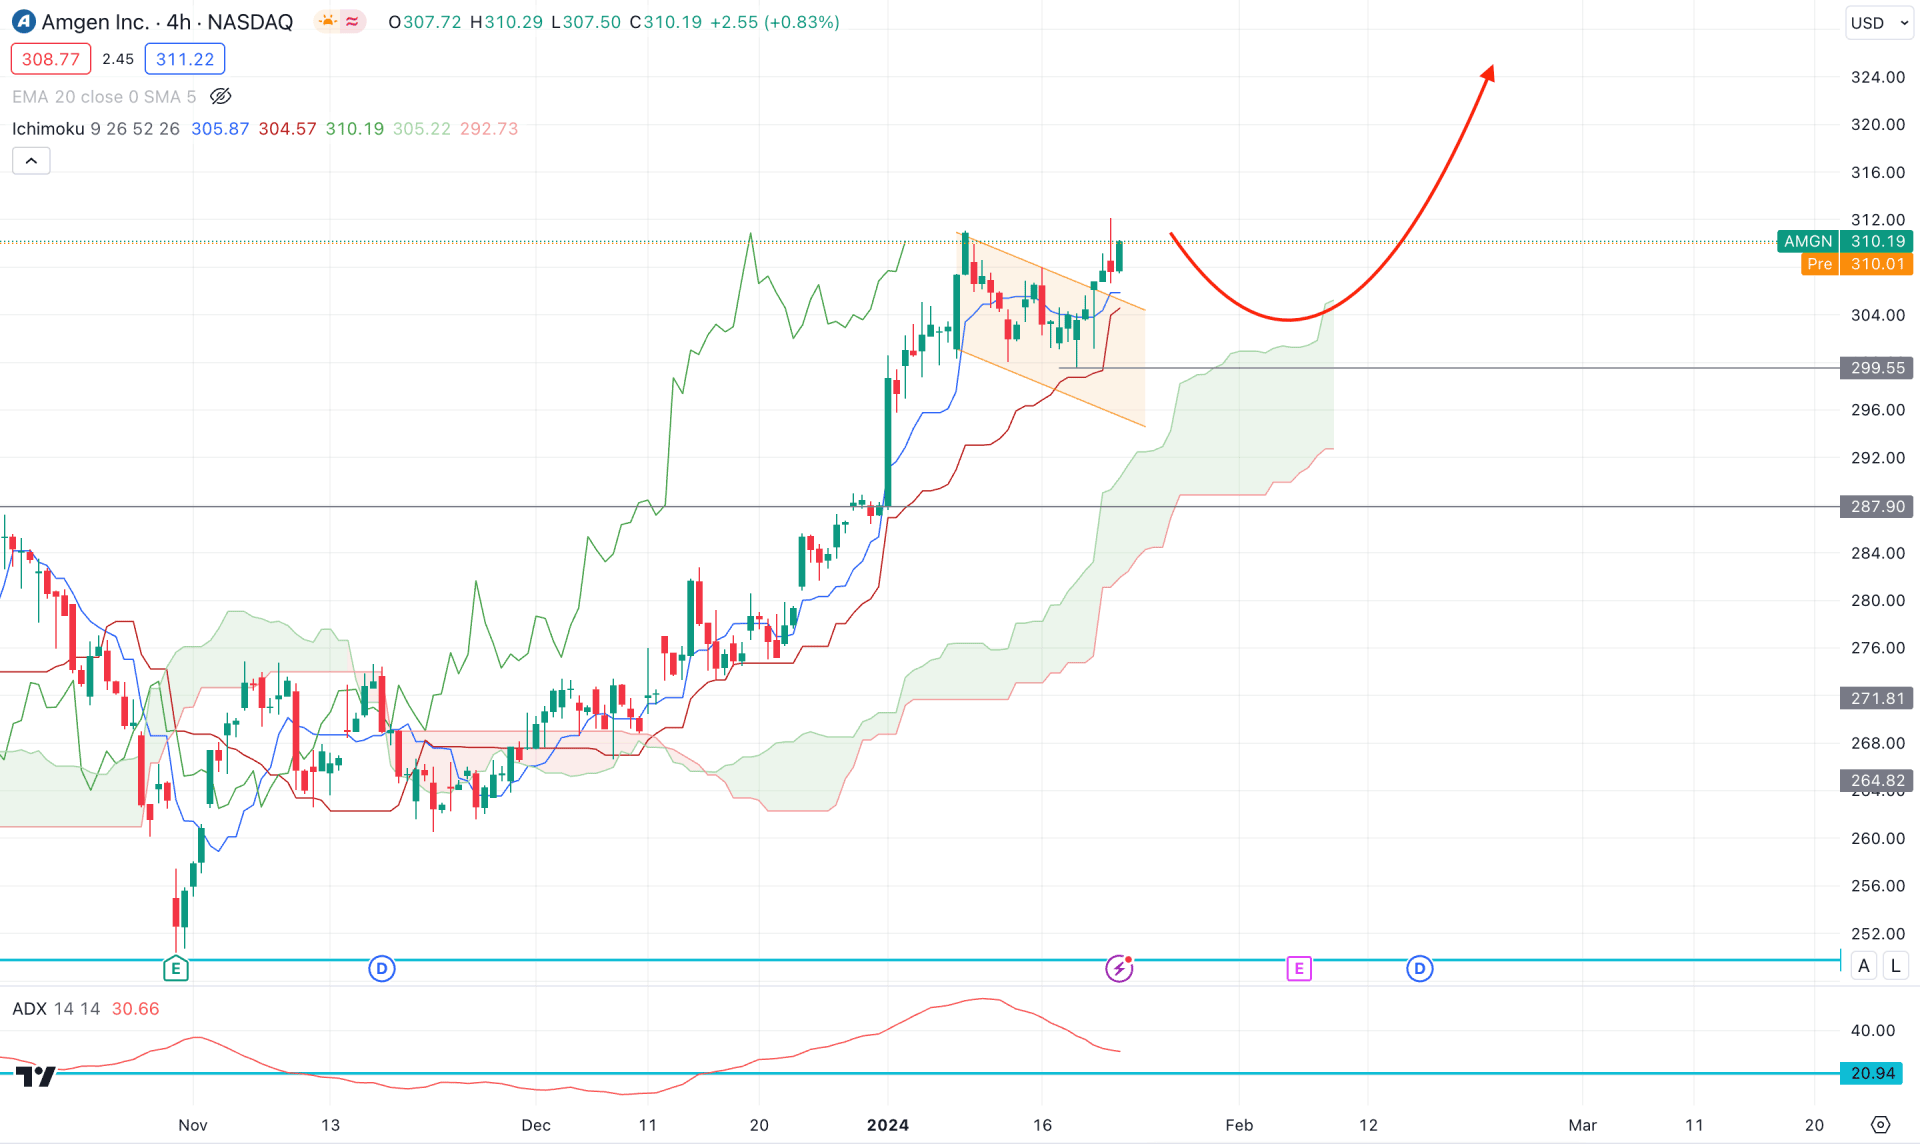
In the H4 chart, the ongoing buying pressure is valid as the recent Ichimoku Kumo Cloud suggests an upward signal. The price remains above the cloud support for a considerable time while the Senkou Span A and B show upward tractions. Based on this outlook, a bullish continuation is possible as long as the price trades above the Senkou Span B level.
In the indicator window, corrective market pressure is visible as the recent ADX level formed a downside pressure after forming a top. However, the current reading is still above the 20.00 line, which indicates that an impulsive trend is still possible.
Based on the Ichimoku cloud analysis, ongoing buying pressure could take the price above the 330.00 level in the coming days. However, a downside correction is possible, where another bullish signal might come from the 300.00 to 287.00 zone.
On the bearish side, a break below the 287.00 level could be an alarming sign to bulls, which could lower the price towards the 270.00 level.
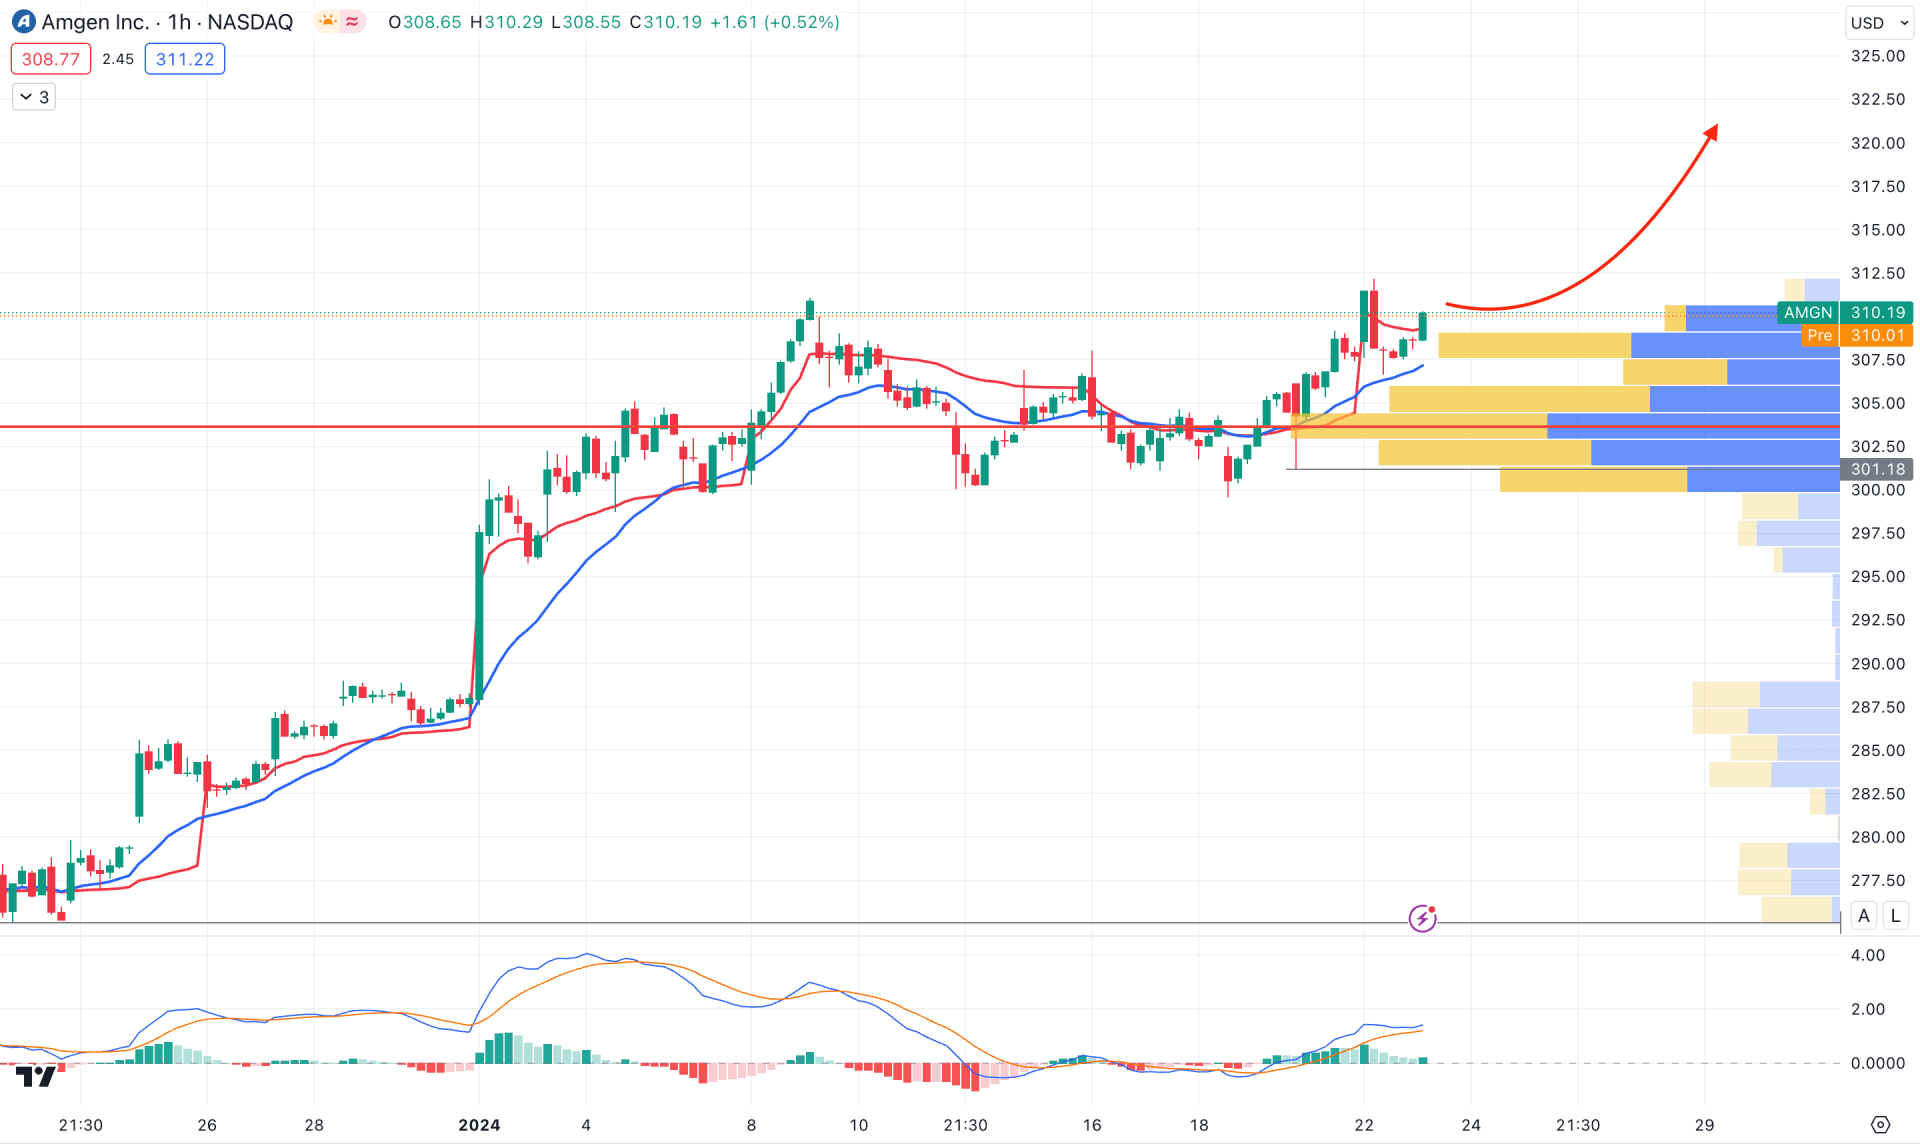
In the hourly AMGN chart, the dynamic 20 EMA is the immediate support from where bulls try to make another high. Moreover, the upward pressure is supported by the visible range high volume level, which is an immediate support.
In the MACD Indicator, the Histogram rebounded above the neutral zone, keeping the signal line at the bullish area.
Based on the current outlook, a simple trend following structure is visible, where the main aim is to test the 330.00 level. However, an early signal of a deeper correction might come after taking the price below the 300.00 psychological level, which could lower the price towards the 276.00 low.
Based on the current multi-timeframe analysis, Amgen Stock (AMGN) has a higher possibility of continuing upward as there is no significant barrier above the current price. However, investors should closely monitor how the price reacts at the all-time high level as a strong bearish exhaustion could eliminate the bullish structure at any time.


