
Published: July 16th, 2024
Recently, American Express (AXP) has disclosed its full-year earnings per share (EPS) projection, which could exceed analyst projections by a margin of 12.65 to 13.15. Moreover, the company anticipates a revenue increase of 9% to 11% in 2024, also exceeding analysts forecast
In its history, American Express's earnings per share (EPS) have increased 9.4% annually over the past five years, while its share price has risen by 13% annually. It is an indication that market participants hold the company in higher regard, which is logical given its growth history.
In the latest quarter, Amex reported an EPS of 2.62, up from the 2.07 reported in the previous year. Moreover, the revenue increased by 11% to 15.8 billion but was below the forecasted 16 billion.
Over the past year, American Express shareholders have experienced a total return of 39%, which includes dividends. This exceeds the annualized return of 15% over the past five years, indicating that the company has performed better recently.
Let's see the further aspects of this stock from the AXP technical analysis:
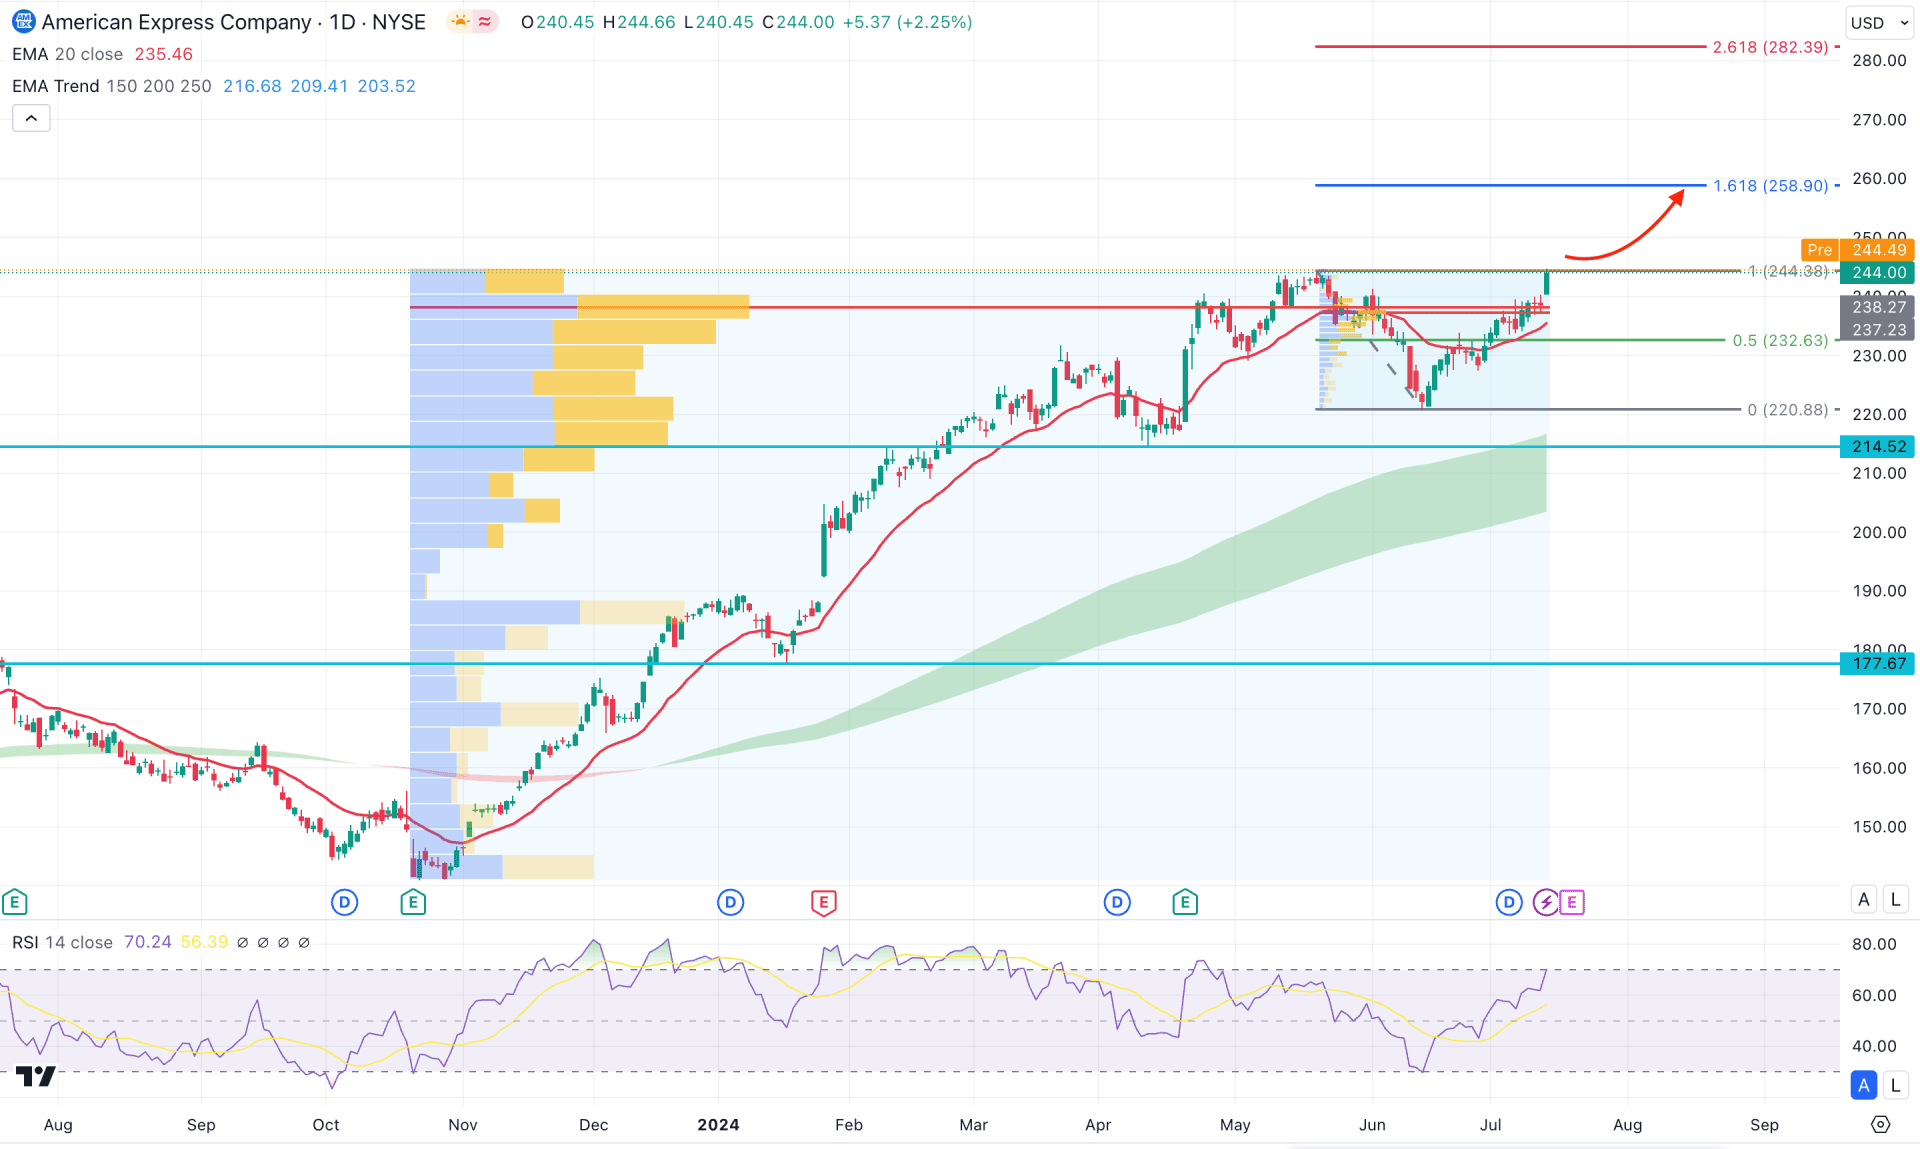
In the daily chart of AXP, an impulsive bullish trend is seen, from which a trend continuation strategy could offer a highly probable trading opportunity.
In the broader market structure, a bullish inside bar was closed in June, suggesting a minor selling pressure in the market. Moreover, the ongoing buying pressure is visible as the upward continuation is running in July 2024. A clearer picture is visible in the weekly price, where a bullish V-shape recovery is likely to happen. As the current price trades at the crucial weekly resistance of 244.38, investors should monitor how the price reacts at this level. Any bullish surge with a daily candle above this line could validate the long-term bullish opportunity for the coming days.
The volume structure suggests a similar structure, where the current high volume level since October 2023 is at the 238.28 level. Another high volume level since May 2024 is at 237.23 level, while both lines are closer below the current price. Therefore, as long as the current price hovers below the current price, we may expect a bullish continuation to happen in the coming days.
The bullish continuation is also indicated by the dynamic level, where the current MA wave consists of 150 to 250 MA is below the current price. Moreover, the dynamic 20 day Exponential Moving Average is closer to the current price, with an upward slope at the high volume line.
The secondary indicator window shows a strong bullish reversal, where the current level hovers at the 70.00 level after forming a bottom.
Based on the daily market outlook of American Express Stock (AXP), investors might expect the buying pressure to extend. A valid bullish daily candle above the 250.00 level could reach the 258.90 level, which is 161.8% Fibonacci Extension level from the existing swing.
On the bearish side, a failure to extend the buying pressure above the 250.00 level could be a challenging factor for bulls. In that case, bearish exhaustion from this zone with a daily close below the 232.63 level could lower the price towards the 214.52 level. Below this level, the next support level is 177.67 level, which could be the extended level of the bearish pressure.
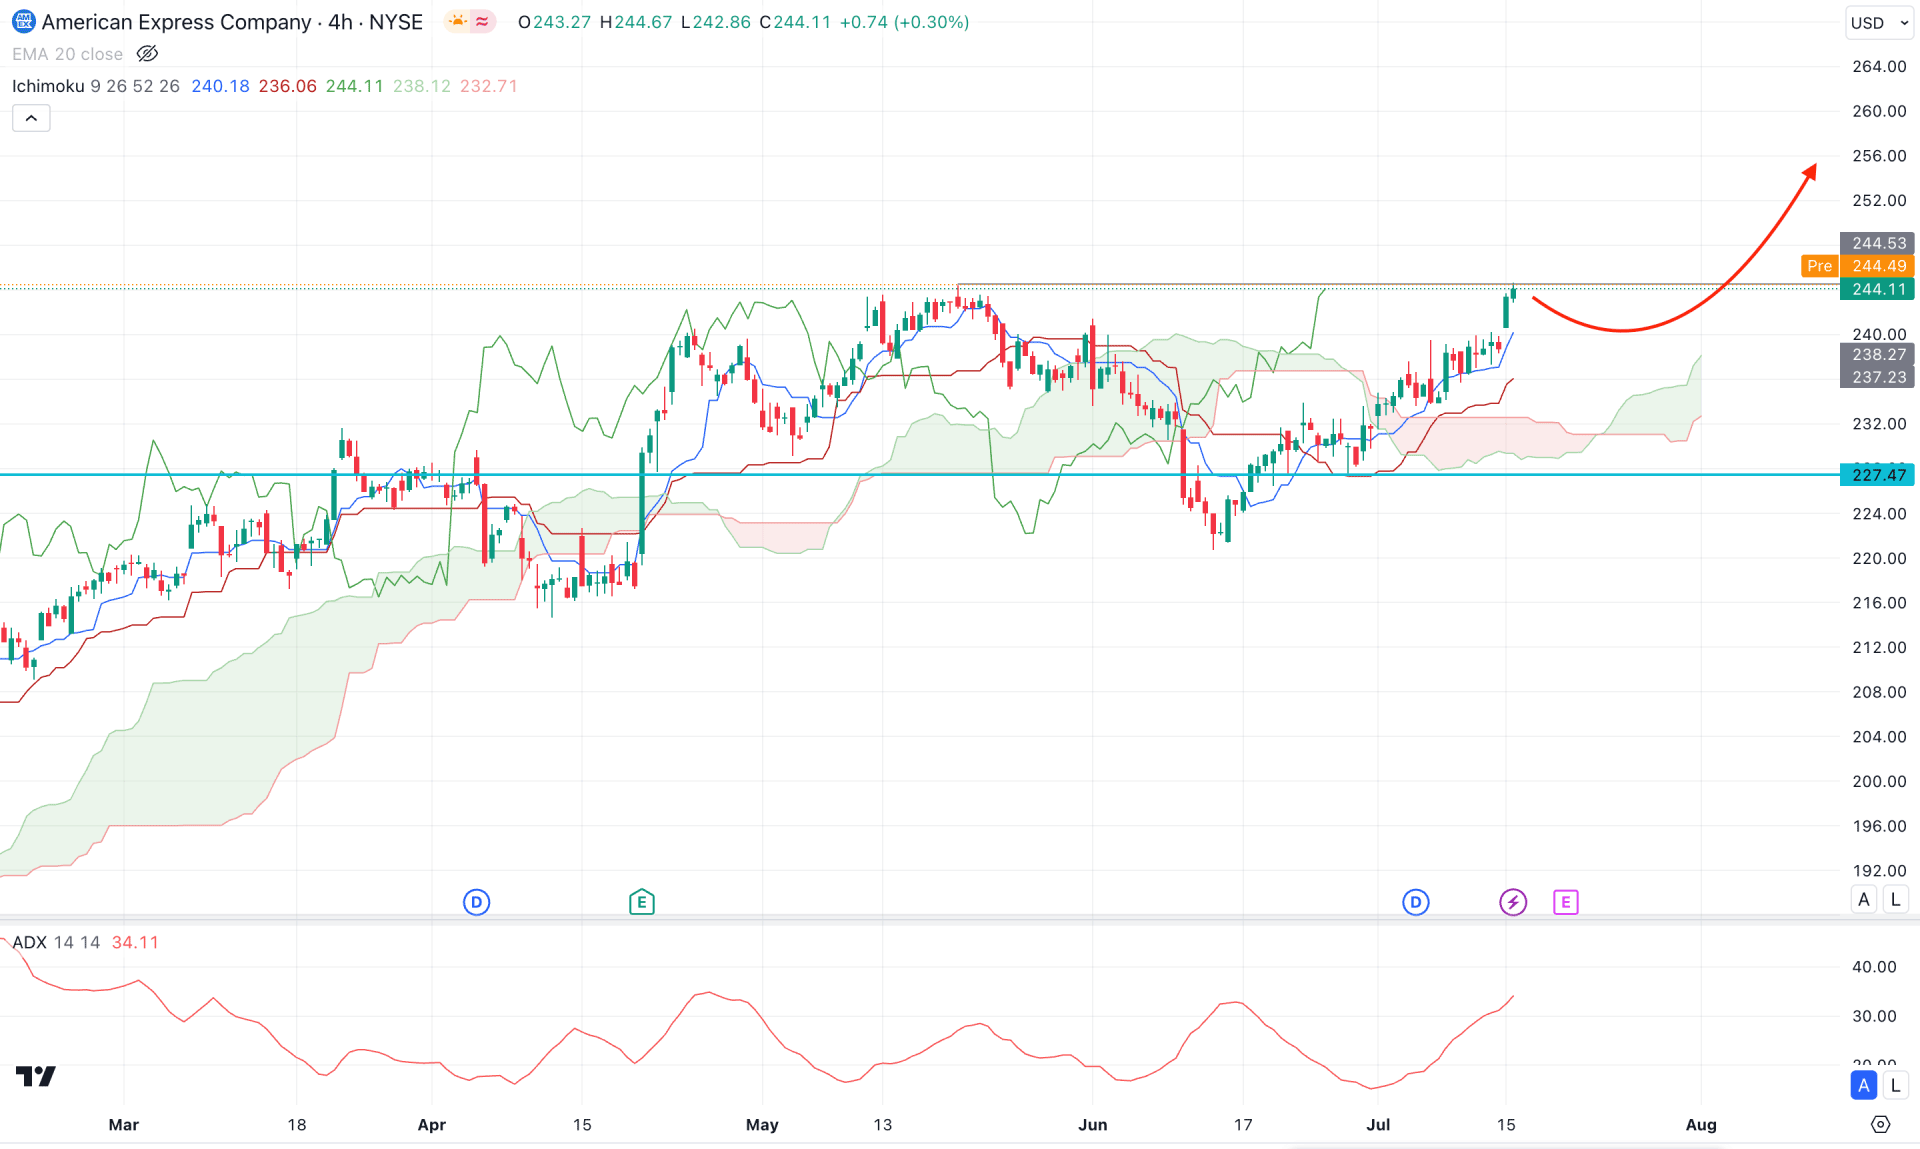
In the lower timeframe, AXP shows a similar outlook to the daily chart, where the current price hovers above the dynamic Ichimoku Cloud zone. In the future cloud, both lines are aimed higher, which could work as an additional sign of possible buying pressure.
In the indicator window, the current Average Directional Index (ADX) is at its highest level in one year, suggesting an ongoing stable trend.
Based on the H4 structure of AXP, investors might expect a downside correction as the recent price is facing resistance from the 244.53 level. The primary trading idea is to find a bullish reversal candlestick from the dynamic Kijun Sen level, aiming for the 260.00 level as a target point.
On the other hand, an immediate selling pressure with a counter-impulsive momentum could be a potential bearish opportunity. In that case, a daily close below the 227.47 level could lower the price towards the 200.00 area.
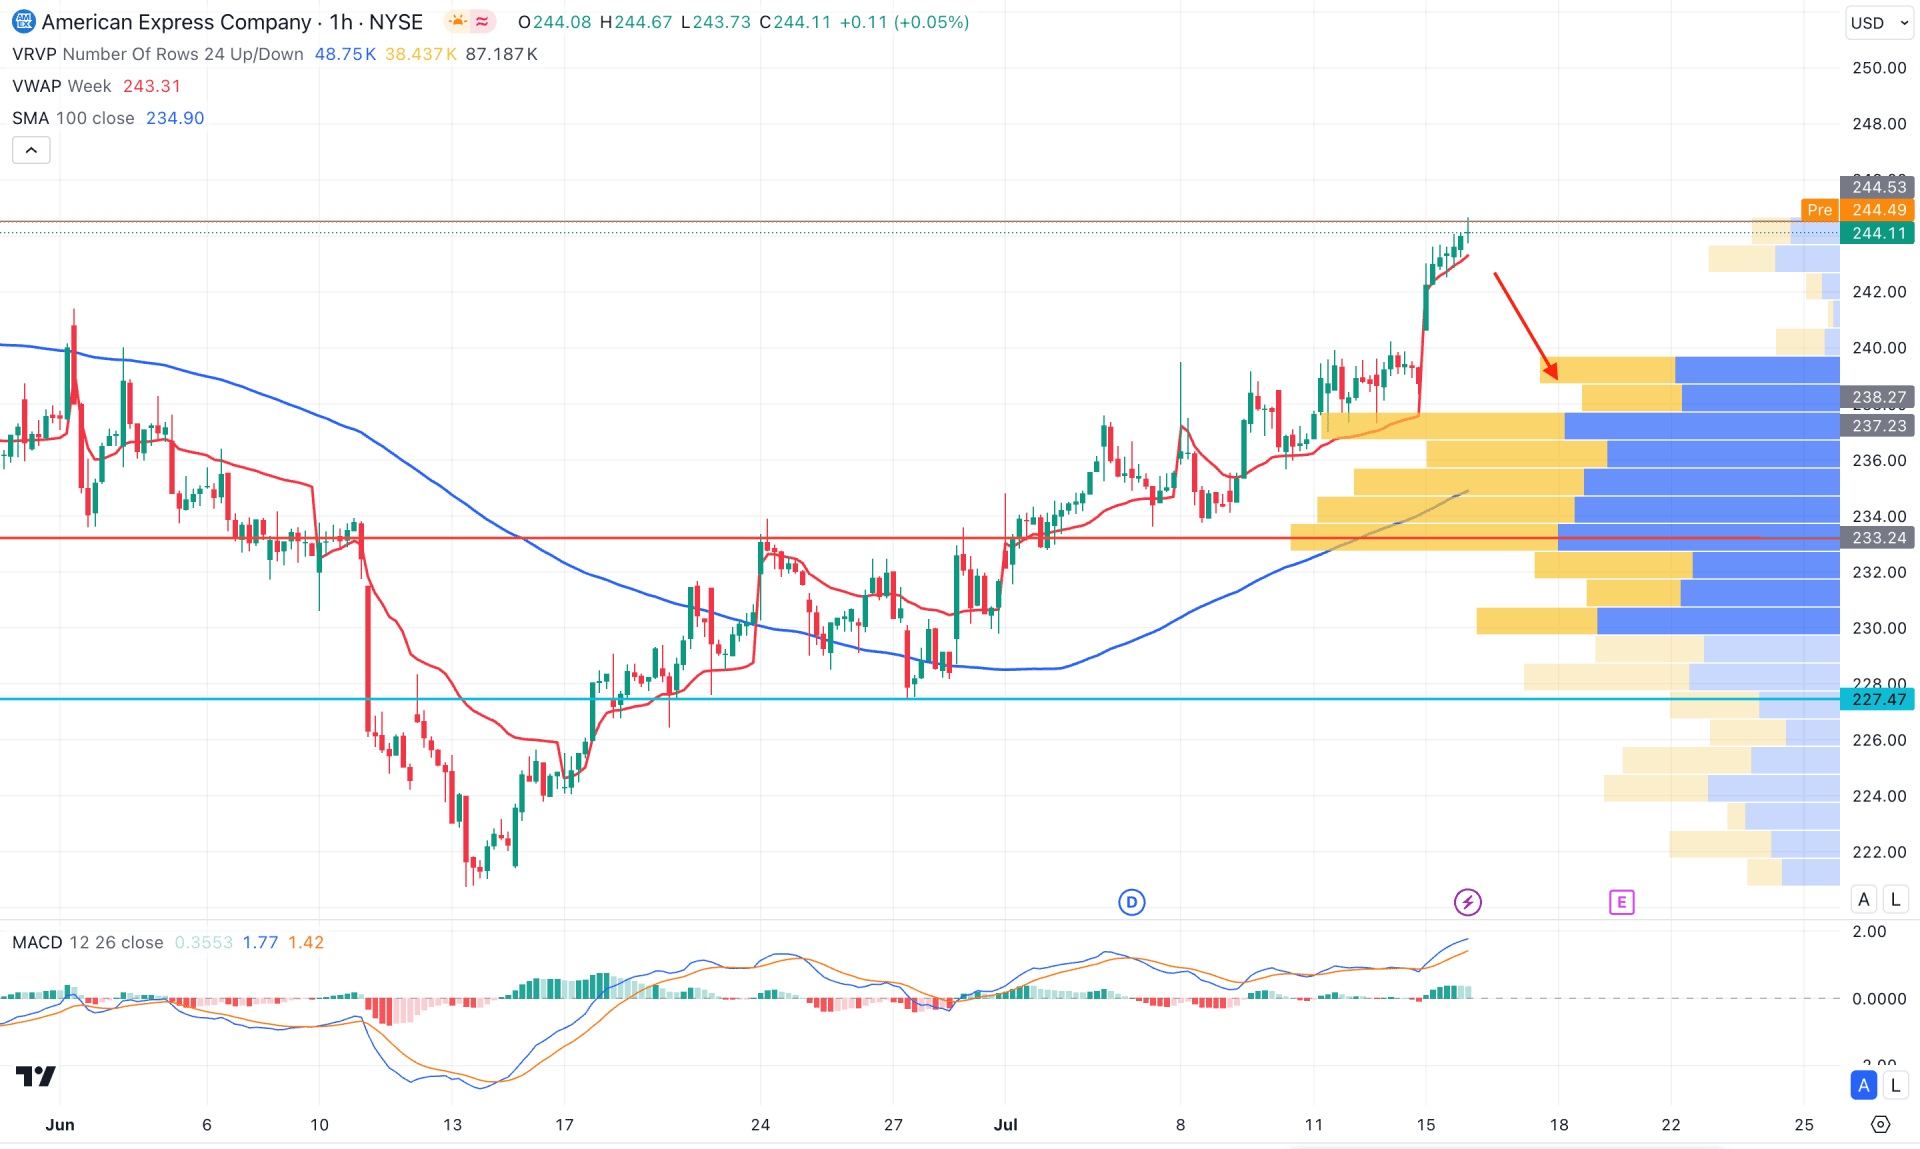
In the hourly time frame for AXP, the current price is overextended from the dynamic 100 Simple Moving Average. Moreover, the visible range high volume line is at the 233.27 level\, which is 4.41% below the current price. As major hourly support lines are below the current price, we may expect a bearish correction to happen before offering a bullish continuation signal.
In the secondary window, the MACD Histogram maintained the buying pressure as it remained above the neutral line for a month. Moreover, the MACD signal line maintained the upward pressure above the neutral line, which could work as a confluence bullish factor.
Based on this outlook, a considerable downside correction is pending, where the main aim would be to test the 100 SMA line. However, a bullish reversal from the dynamic VWAP level with an hourly close above the 245.00 level could extend the upward pressure above the 260.00 area.
Based on the current market structure, AXP is more likely to move beyond the current all-time high level. Moreover, any upbeat earnings result could boost the buying pressure as an additional long signal. Investors should closely monitor how the price trades in the intraday chart, from where the buying pressure might resume after having a downward correction.


