Published: December 17th, 2024
Accenture Plc (ACN) is expected to release its first-quarter fiscal year 2025 results before the market opens on December 19.
The track record of ACN's earnings surprises is impressive. In the last four quarters, its earnings exceeded the average consensus estimate of 2.2%.
The top line's consensus estimate is $17.2 billion, representing a 5.9% increase over the first quarter of fiscal year 2024 results. The increase in revenues throughout the segments helped the top line.
Analysts project that the Managed Services section will generate $8.2 billion in revenue, a 5.6% increase over the reported amount from the previous quarter. Accenture's ability to use its SynOps Platform to automate processes and provide quantifiable efficiencies throughout the fuel advertising business is probably responsible for this segment's growth.
Moreover, the consulting revenues might reach $8.9 billion, representing a 5.8% annual growth rate. The Resources part is expected to generate $2.4 billion in revenue, indicating a 4.8% annual growth rate. The Communications, Technology, and Media segment is anticipated to generate $2.9 billion in revenue, a 7.3% increase over first-quarter monetary 2025 actuals.
Regarding geographic markets, the North American revenue might rise by $8.6 billion from 7.1%. Also, Asia Pacific's revenues might increase to $2.5 from 5.1% billion compared to the actual for the same quarter last year.
Let's see the upcoming price direction of this stock from the ACN technical analysis:

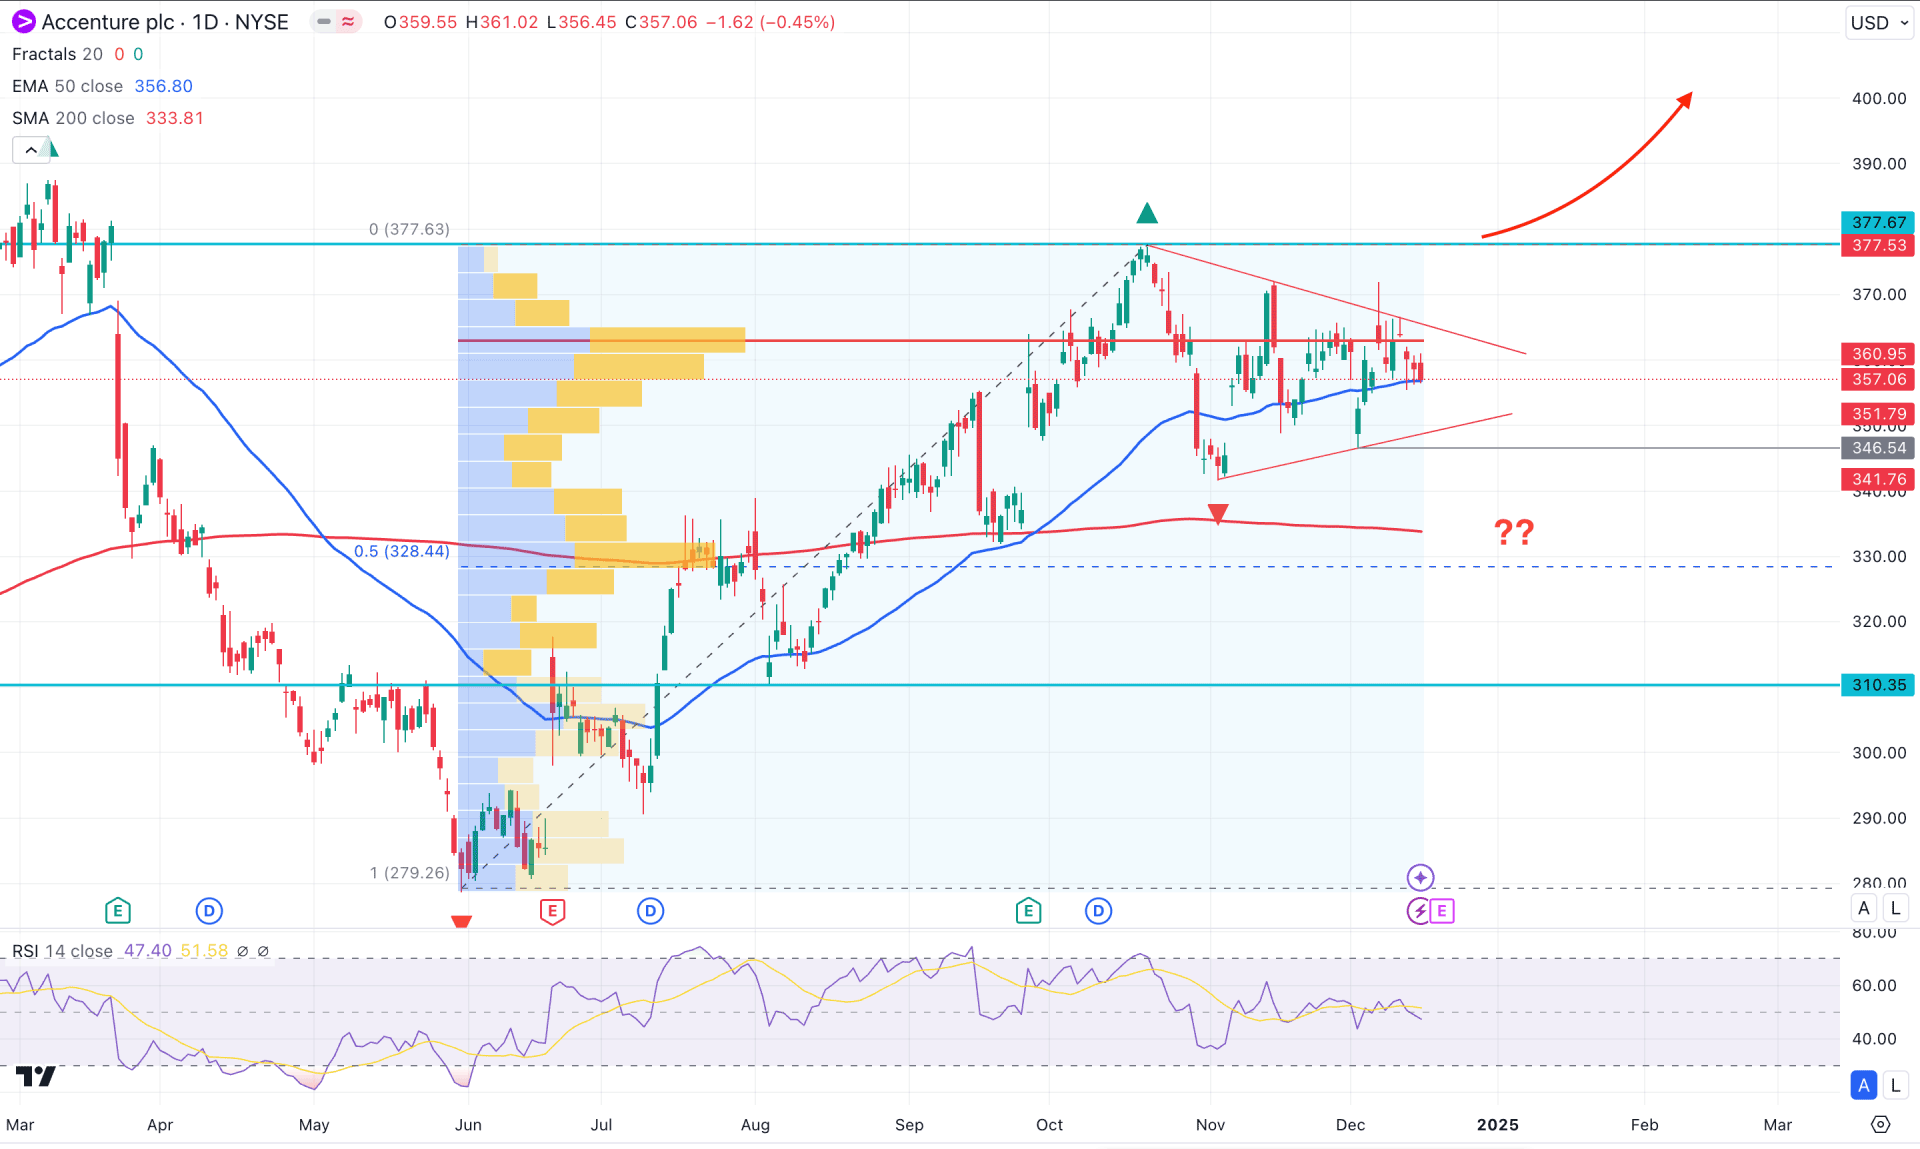
In the daily chart of ACN, the broader market momentum is bullish, as the current price is trading 27% higher from the June 2024 bottom. Investors might consider this a bullish trend, from which any minor downside recovery could open a long opportunity.
Looking at the higher timeframe, the recent monthly time frame signals a corrective momentum, as no significant price fluctuation is seen. Moreover, the March 2024 high is still protected, which signals a barrier to bulls. As long as the crucial monthly high is protected, investors might expect a decent downside correction in the day ahead.
In the current tradable range, the bullish recovery is seen from the 279.26 line, which is the lowest point of the tradable range. On the upside, the price 377.67 is the crucial price from where the latest downside recovery has come. As the current price is trading above the 50% Fibonacci Retracement of this tradable range, we may expect a pending downside correction in the coming days.
In the main price chart, the 200-day Simple Moving Average is still below the current price, and it is working as a major support. The bullish continuation is primarily valid as long as the 200-day SMA is protected. However, the downside recovery is still pending as the price moved below the 50-day EMA line.
Based on the daily market outlook of ACN, investors should closely monitor how the price trades below the 50-day EMA line. Any immediate bullish recovery above this dynamic line might resume the existing market trend, towards the 400.00 psychological line.
On the other hand, the ongoing downside pressure is potent, which might resume the bearish trend towards the 310.35 static support line.

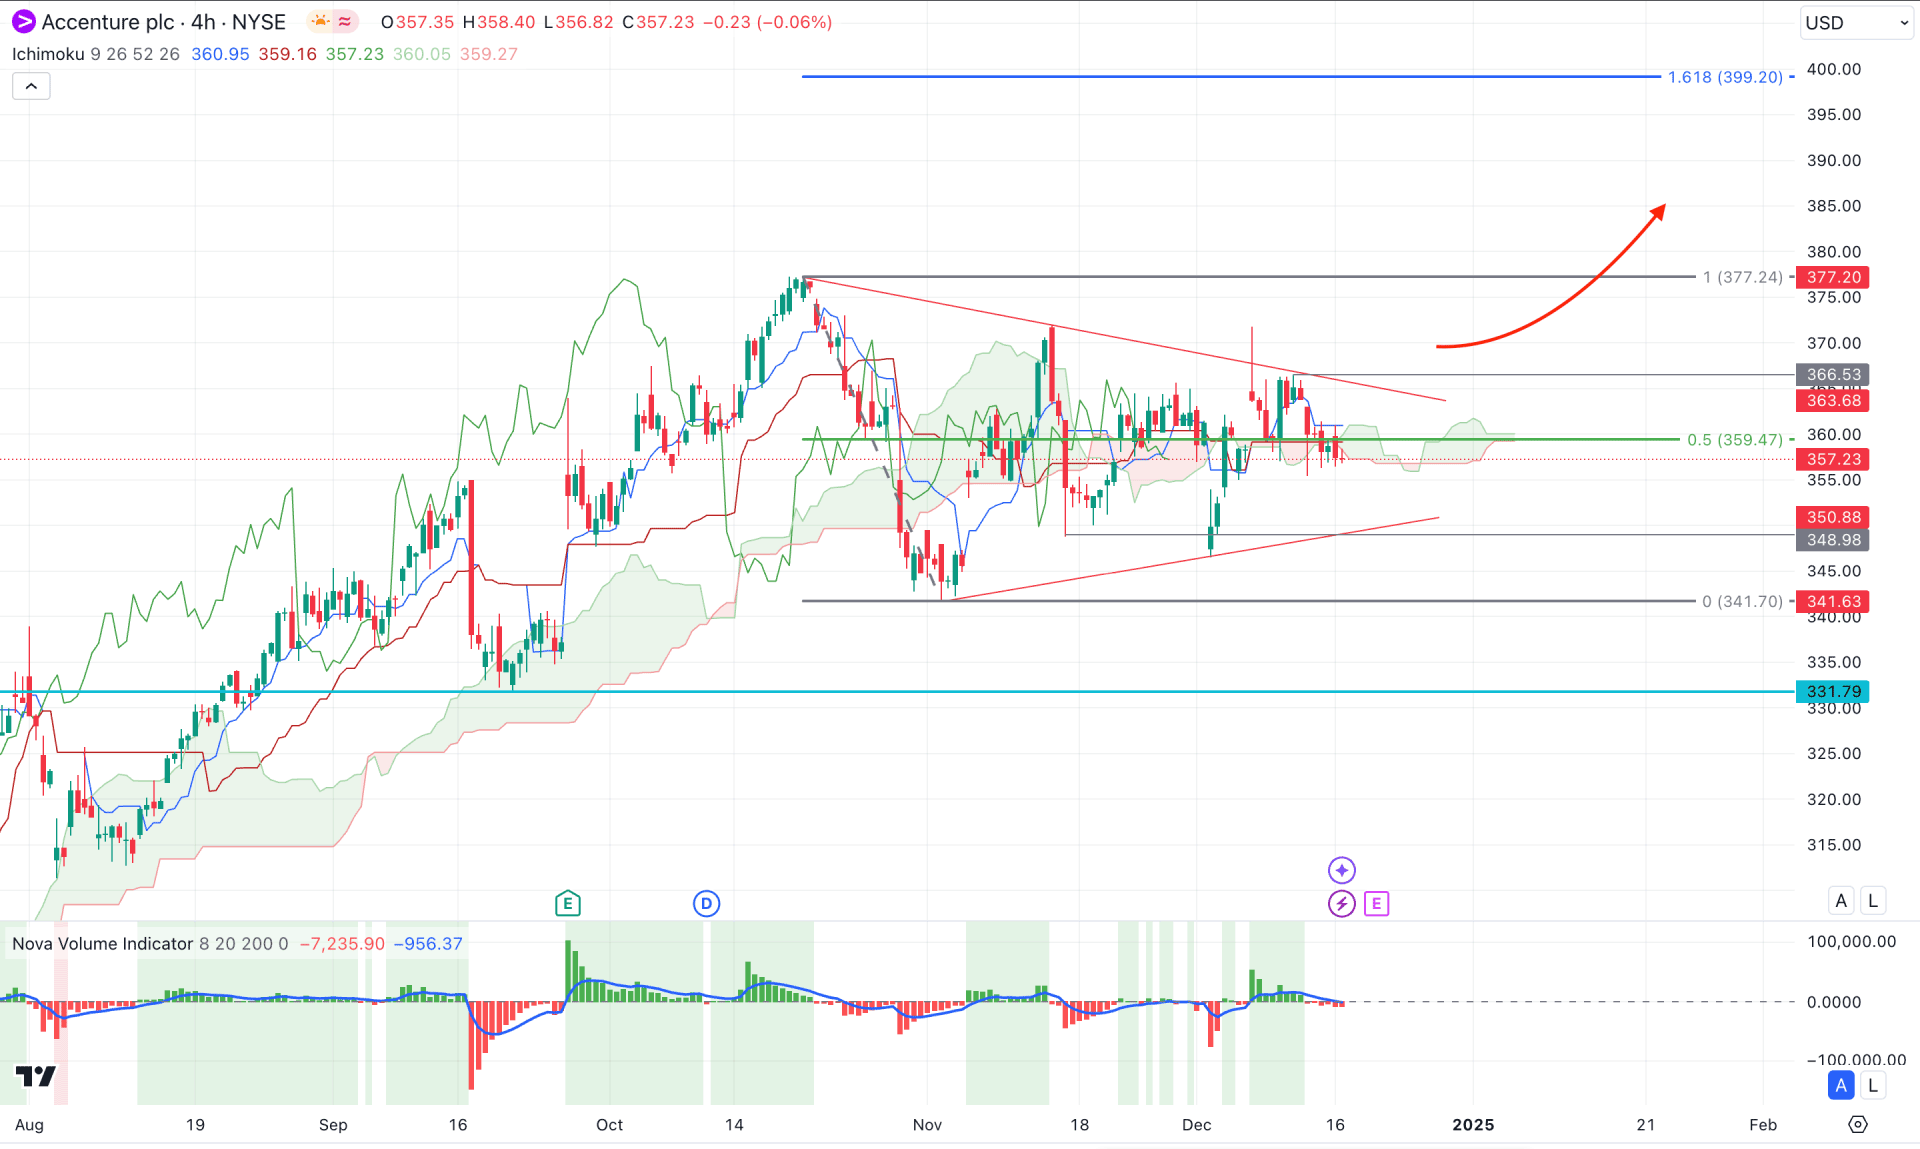
In the daily chart of ACN, the recent price shows a high level of uncertainty as the symmetrical triangle is in play, from where a solid breakout is needed. Primarily, the broader market context is bullish, from which an upward continuation could provide a high probability of a long signal.
The current price is sideways in the Ichimoku Cloud, as no significant high or low is visible in future lines. Also, the Volume Histogram suggests active bearish pressure with lower activity.
Based on the H4 outlook, a selling pressure below the triangle support with an immediate market reversal could signal a sell-side liquidity sweep, creating a high probable long opportunity. In that case, the crucial resistance level is the 377.24 line, which would be the immediate target. Moreover, overcoming this resistance could open the room for reaching the 399.20 level, which is the crucial Fibonacci Extension level.
On the bearish side, a bearish triangle breakout with a consolidation could signal a downside continuation, aiming for the 320.00 psychological line.

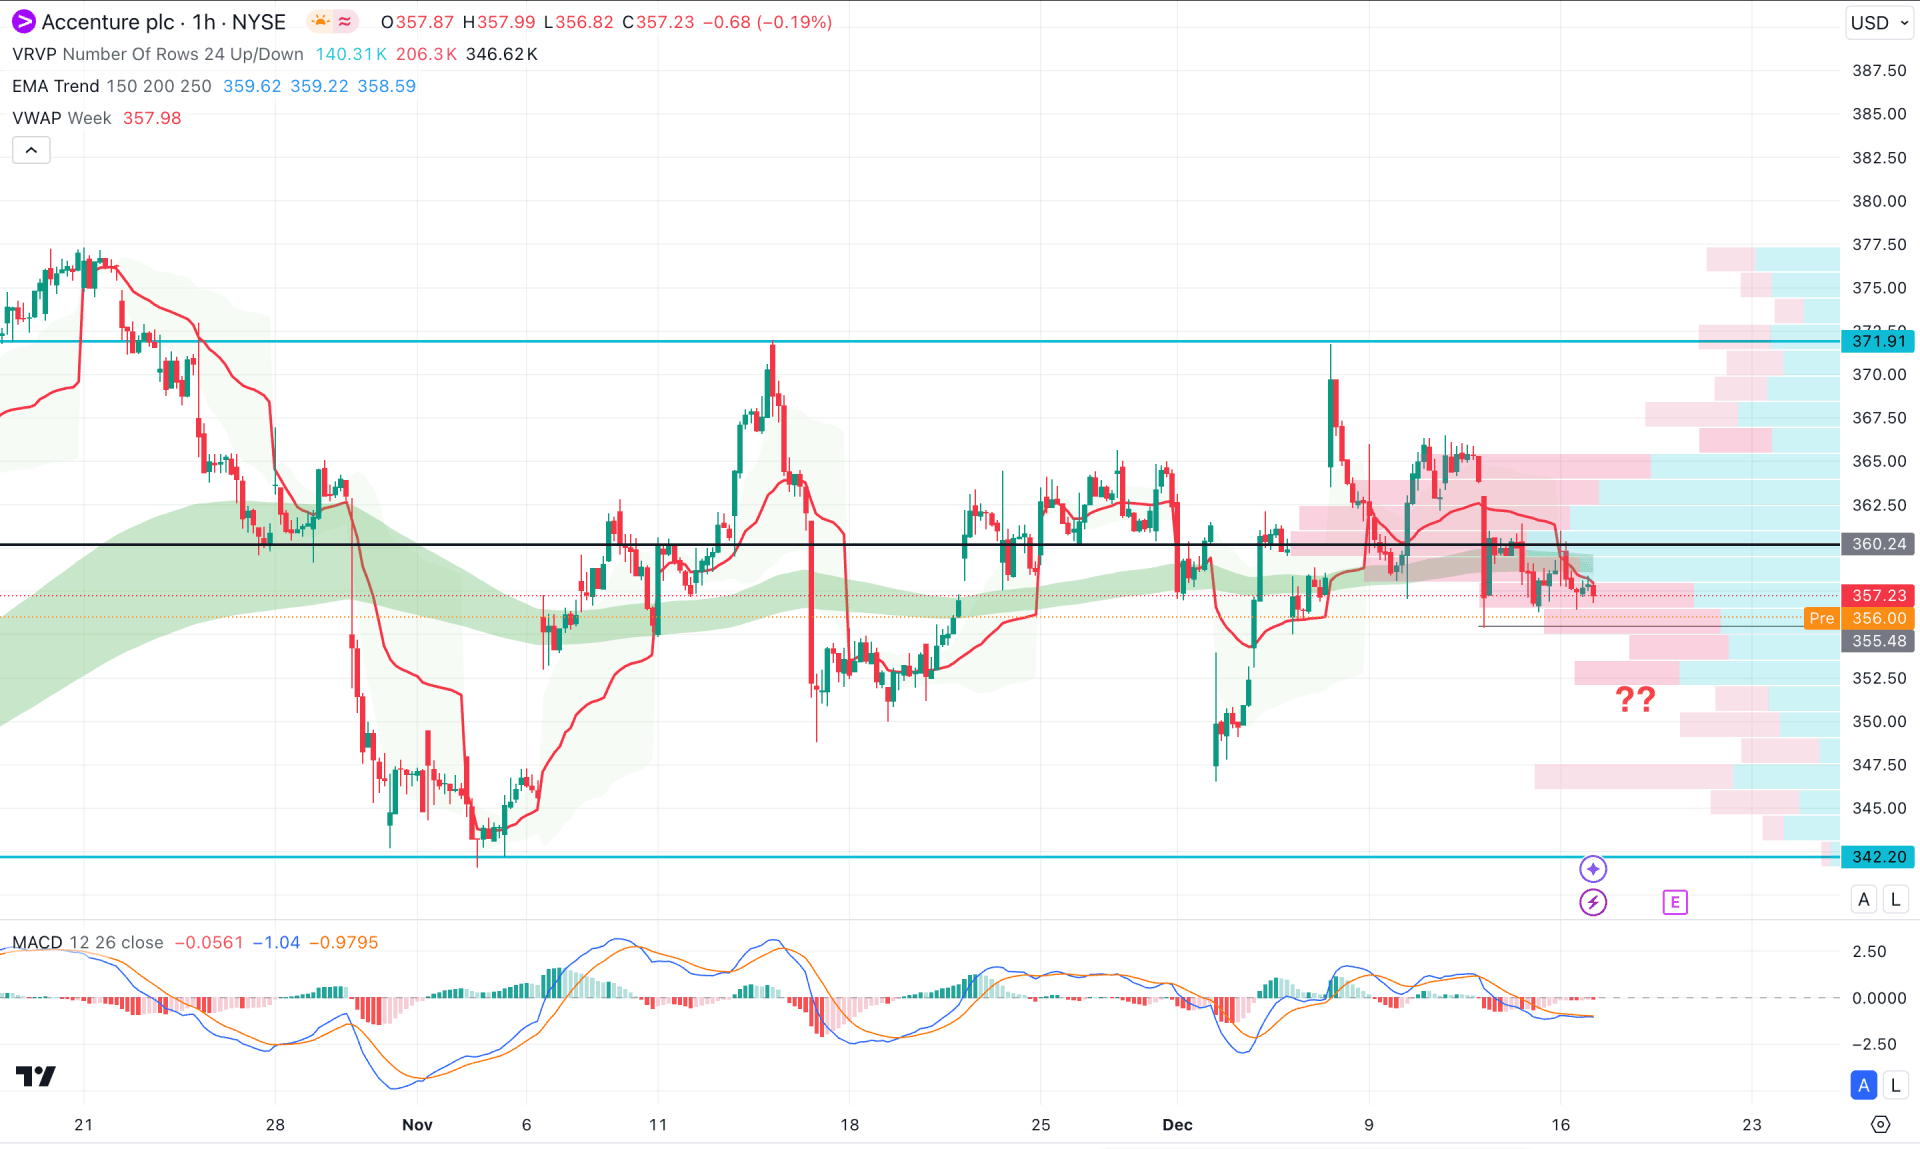
In the hourly chart of ACN, the ongoing market momentum is sideways below the visible range high volume line. Primarily, the downside pressure is valid as long as the high volume line remains above the current price.
A sideways market pressure is also visible in the indicator window, where the current MACD Histogram remains closer to the neutral line.
Based on the hourly ACN structure, the current downside pressure is potent as the dynamic weekly VWAP line supports it. In that case, a downside pressure with a bearish hourly close below the 355.48 level could lower the price toward the 342.20 key support level.
On the other hand, an immediate bullish rebound is possible, where a valid hourly close above the 367.00 high could signal a trend continuation toward the higher timeframe's direction.
Based on the current market outlook, ACN is facing a crucial resistance from the higher timeframe, from where a decent downside recovery is pending. Investors should closely monitor the lower timeframe as any strong bearish rejection from the liquidity zone could validate the long-term bullish signal.