

Published: October 29th, 2026
Currency movements across major pairs are being driven by expectations surrounding this week's monetary policy decisions from the Federal Reserve and the Bank of Japan (BoJ). These expectations are also prompting investors to reposition across non-USD currency pairs, including CADJPY.
Meanwhile, Japan's Finance Minister Katayama has reiterated the government's willingness to step into the foreign exchange market if needed to strengthen the yen. The possibility of intervention adds uncertainty to the outlook and could limit further yen depreciation in the near term.
Investors will also monitor Tokyo's October Consumer Price Index (CPI), scheduled for release on Friday ahead of the BoJ's policy announcement. The Tokyo CPI excluding fresh food is forecast to ease to 2.6% year-on-year (YoY), down from 2.7% in September.
The Japanese Yen (JPY) is trading largely unchanged against the Canadian Dollar during the week. The CADJPY pair remains range-bound as market participants await the Bank of Japan's monetary policy decision due on Friday.
Let's see the future price direction from the CADJPY technical analysis:
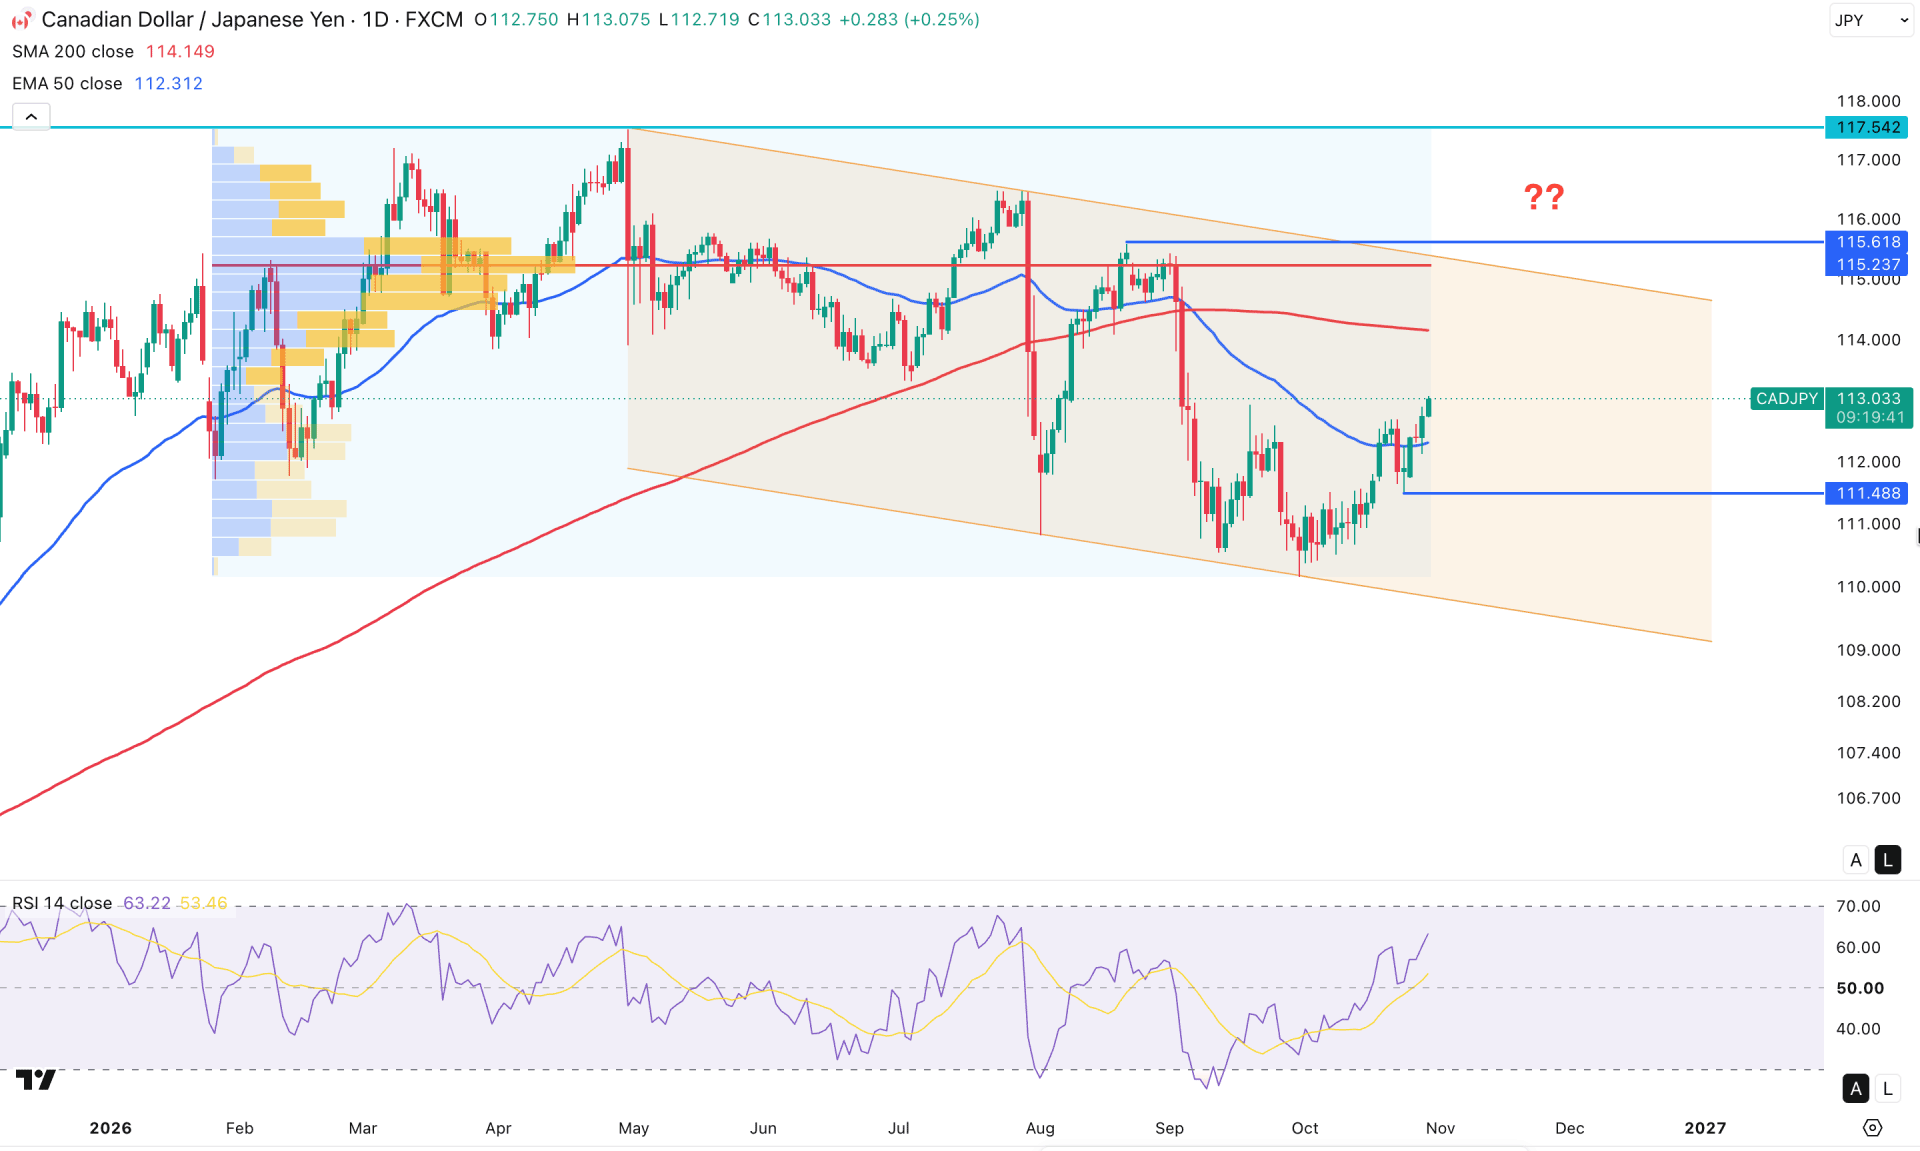
On the CADJPY daily chart, price has been moving sideways after making a yearly high. Price turned bearish after testing the 117.54 swing high, and more confirmation is needed before anticipating the bullish continuation opportunity.
On the higher timeframe, price action is bullish, even though the ongoing monthly candle is bearish with an engulfing pattern. As the monthly low is still protected and working as support, we may consider the buying pressure as well. The weekly timeframe shows a similar structure, with a visible bullish rebound, though it is not significant enough to consider a bullish reversal.
In terms of volume, sellers are dominating the price as the most active level since January 2026 is at the 115.23 level, which is above the current price. Primarily, a consolidation at the high-volume area with a break from the significant swing high is signaling seller activity in the market.
In the main price chart, mixed market sentiment is visible as the 200 SMA is above the current price. The recent bearish rebound has lowered the selling opportunity, as multiple daily candles closed above the 50-day EMA.
In the Relative Strength Index, the current line is above the 50.00 line, signaling buying pressure in the market.
Based on the overall market structure, CADJPY is having minor bullish pressure from the descending channel low. As the price rebounded above the 50-day EMA, the price is likely to aim higher and test the 200 SMA at the 114.12 level. However, before confirming the long-term bullish trend, the price might face some additional resistance above the 200 SMA. As a conservative approach, a bullish break above the 115.23 high-volume line with a bullish daily candle could increase the possibility at any time.
On the other hand, the price is trading sideways, and the 200 SMA is above the current price. In that case, selling pressure below the 50-day EMA, with the recovery of the 111.48 swing low, could increase the opportunity, targeting the 108.00 area.
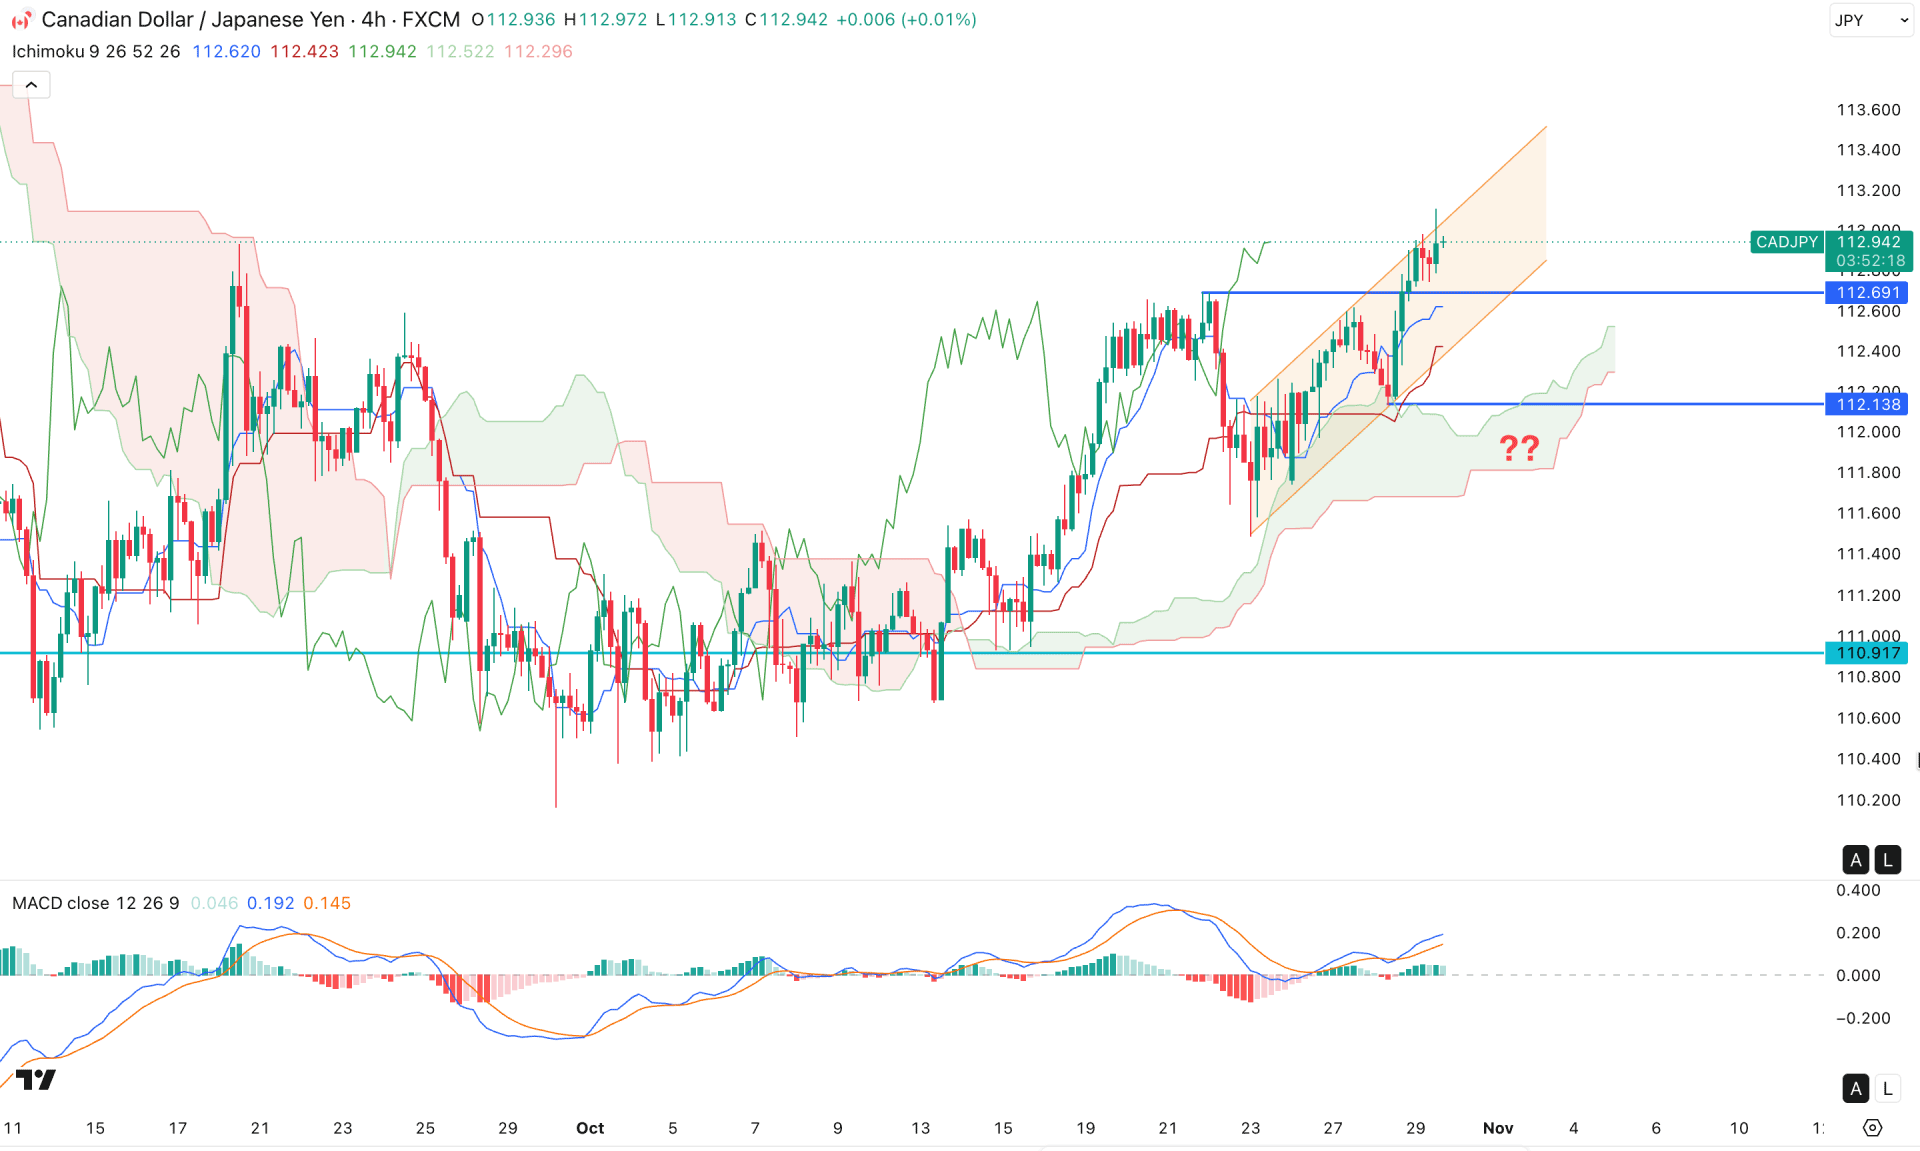
On the four-hour timeframe, CADJPY is trading with bullish continuation momentum, as price has been above the Kumo cloud area for a considerable time. After having a bullish range breakout, the price tested the cloud support multiple times before creating a new swing high above the 112.69 level.
As a result, the future cloud is aiming higher, increasing the bullish possibility with the dynamic support levels below the current price. On the other hand, the MACD histogram is showing different readings. The current Histogram is near the neutral level, even if the signal line is in the bullish zone.
Based on this structure, a minor downside recovery is pending, with the immediate support level to watch at 112.13. As long as the price remains above this line, a bullish rebound is possible. Before opening a short opportunity, a bullish rebound from the dynamic Kijun-sen level could increase the possibility of testing the 114.00 level.
On the other hand, a failure to hold above 112.13 could increase the chance of testing the 110.91 area.
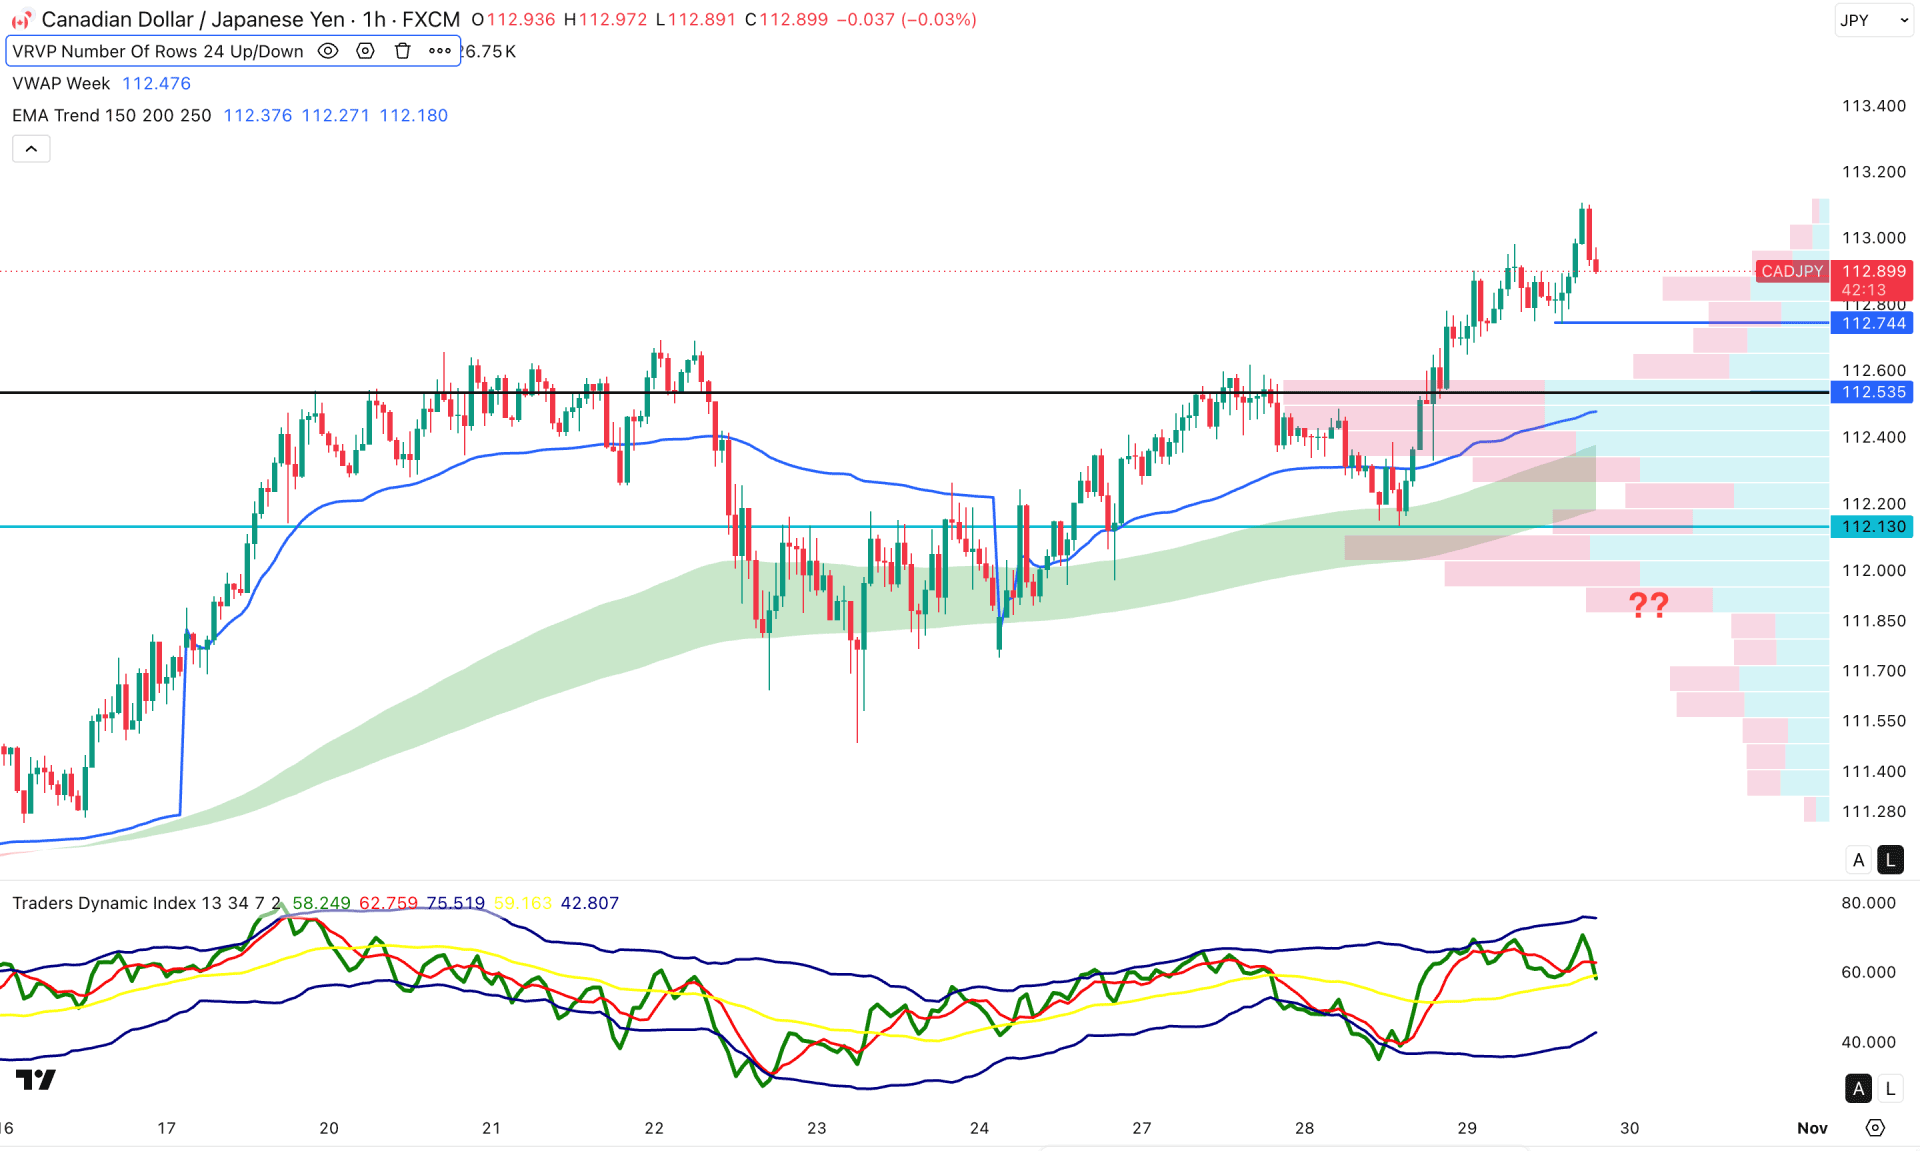
On the hourly timeframe, CADJPY is trading at a high, where corrective momentum is visible. It is a sign of a bullish overextension, from where a decent correction is pending.
On the other hand, the weekly VWAP level is below the current price, which is just at the 112.53 high-volume support area. The EMA wave is also seen below the current price and is working as a major support.
On the other hand, the Traders' Dynamic Index has flipped position, with the current line still above the 50.00 neutral level.
Based on market structure, a drop below 50.00 with downside pressure could open a short opportunity targeting the 112.13 support area.
On the other hand, market momentum remains bullish, with the current price still trading above multiple dynamic support levels. In that case, a rebound from the weekly VWAP line could open a long opportunity as a bullish trend continuation.
Market structure shows CADJPY trading within a major bullish trend, with near-term action sideways at the bottom. This suggests a decent bullish correction opportunity, even if price is trading sideways at the peak. On the other hand, a continuation is possible if the price fails to hold the momentum at the current peak area.


