Published: November 14th, 2024
The stronger CAD against the Japanese yen (JPY) offered a bullish bias, pushing the CADJPY price above the October high. The JPY is still being weakened by the market's increasing belief that the political climate in Japan will make it challenging for the Bank of Japan to tighten its fiscal stance further. Another factor affecting the JPY is worries about how potential US newly elected president Donald Trump's trade policies will affect the Japanese economy.
On the other hand, the Bank of Canada anticipates continuing to lower interest rates more quickly on the Loonie front. According to the summary of their discussions, despite discussing the standard 25 basis point (bps) cut, the policymakers were unanimous in favor of the larger step.
Furthermore, since Canada is a prominent oil exporter, the Loonie is still being weakened by the drop in crude oil prices. The CAD may be supported by the crude oil price recovery, which would boost the buying pressure of this pair.
Let's see the further outlook of this pair from the CADJPY technical analysis:

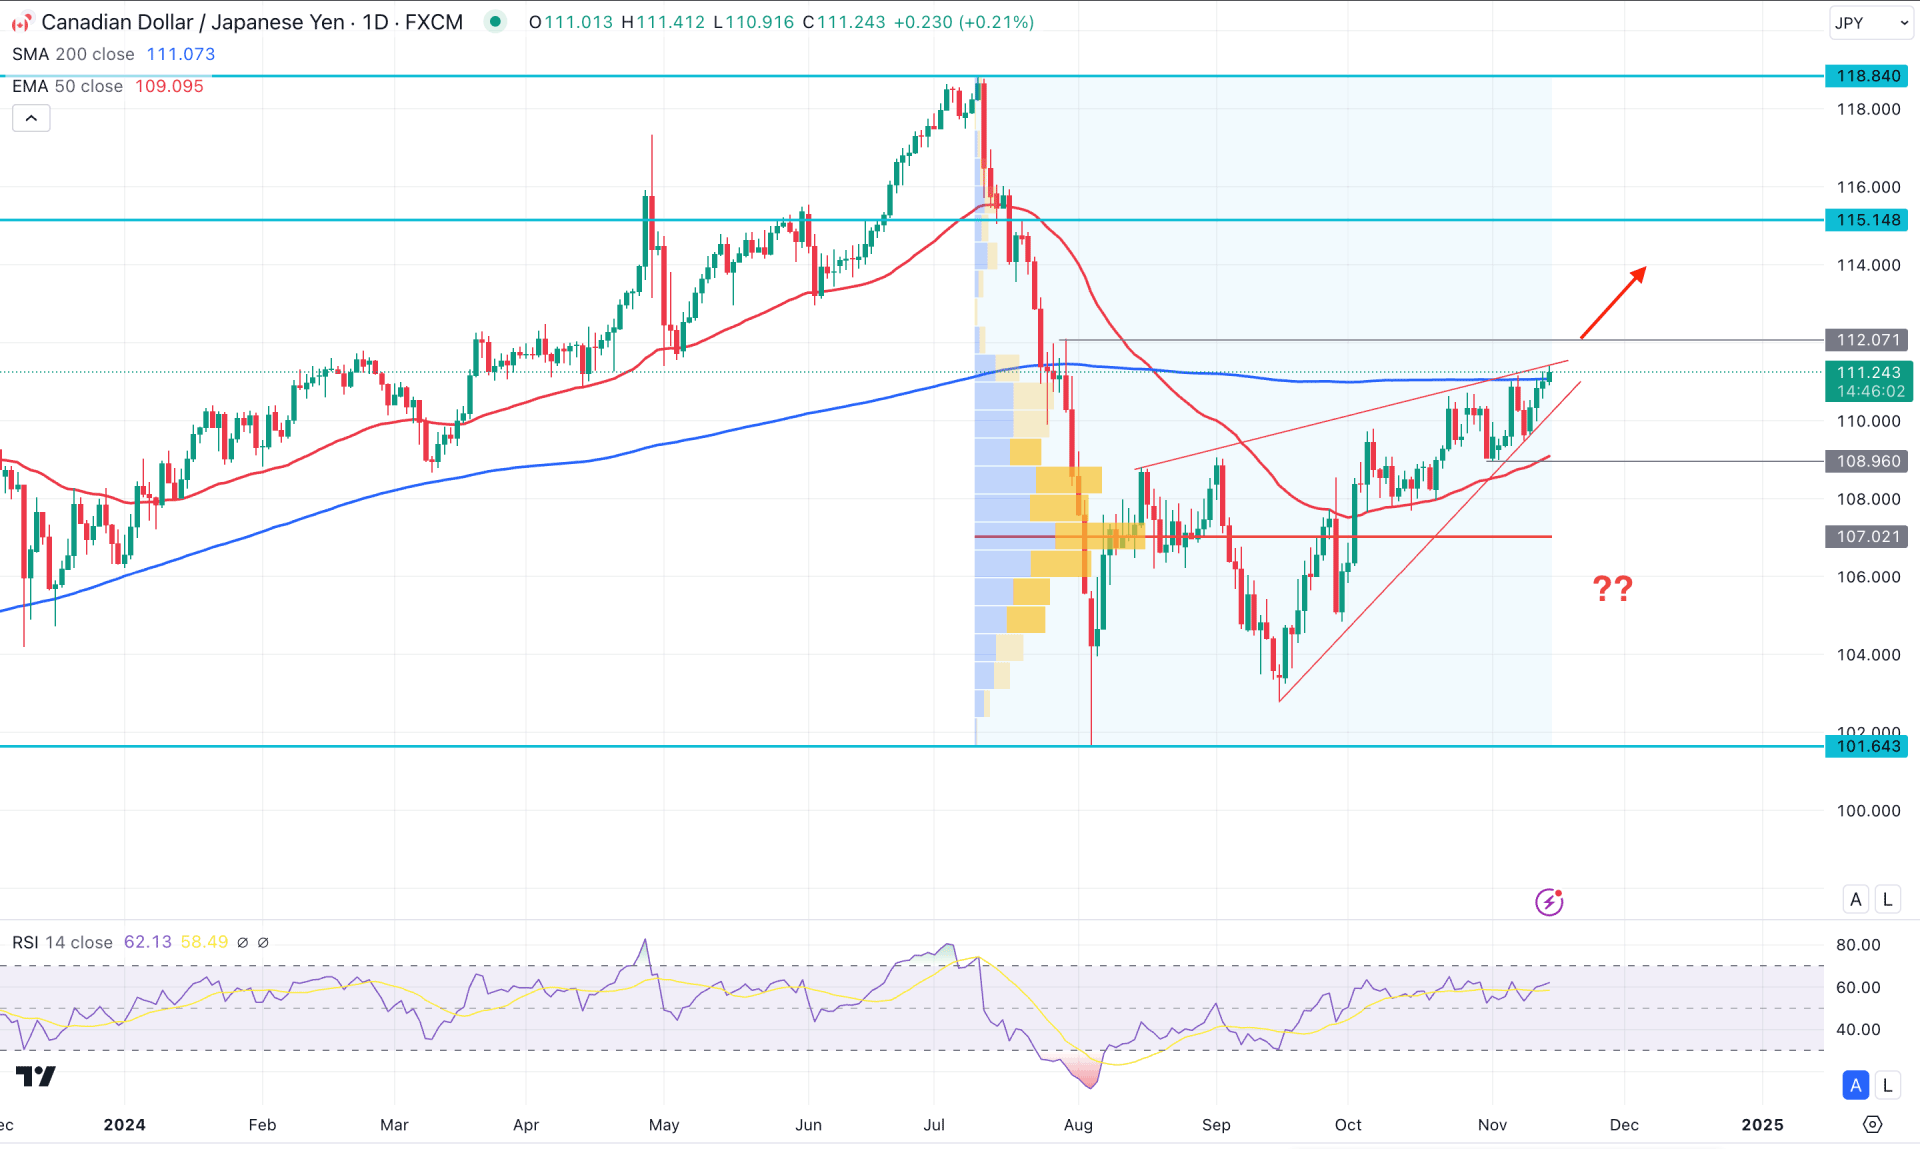
In the daily chart of CADJPY, a prolonged selling pressure has come from the July 2024 peak that has created a massive 14.32% crash in 2 weeks. However, there is a decent recovery from the 101.81 low, with insignificant momentum to signal a trend change. In this context, investors should monitor how the price gets out from the ascending triangle as a valid break with a liquidity grab can offer a trading opportunity.
In the higher timeframe, the ongoing buying pressure is present above the October high, which is followed by a bullish two-bar reversal candlestick. Also, the price moved above the 50% Fibonacci Retracement of the August crash, suggesting a premium zone. Therefore, taking a long trade from a premium zone needs sufficient clues from the price action.
If we combine the current momentum with the volume, we might see a positive outlook for bulls. The most active level since July 2024 is below the current price, working as a major support.
In the main price chart, a bullish daily candle has formed above the 200-day SMA on Wednesday, suggesting an early bullish reversal signal. However, we might need to see how the price holds the buying pressure above this crucial line before finding a conservative long approach.
On the other hand, the 50-day Exponential Moving Average is below the 108.96 static support level with a bullish slope. The 14-day Relative Strength Index (RSI) is still above the 50.00 neutral line, and it may move beyond the 70.00 overbought zone.
Based on the daily market outlook for CADJPY, the price is more likely to move above the 112.70 resistance level and reach the 118.84 to 116.93 imbalance zone. However, the 115.14 level would work as immediate resistance, from which a minor selling pressure could come.
On the bearish side, any immediate selling pressure below the triangle support could lower the price and test the 107.02 high volume line.

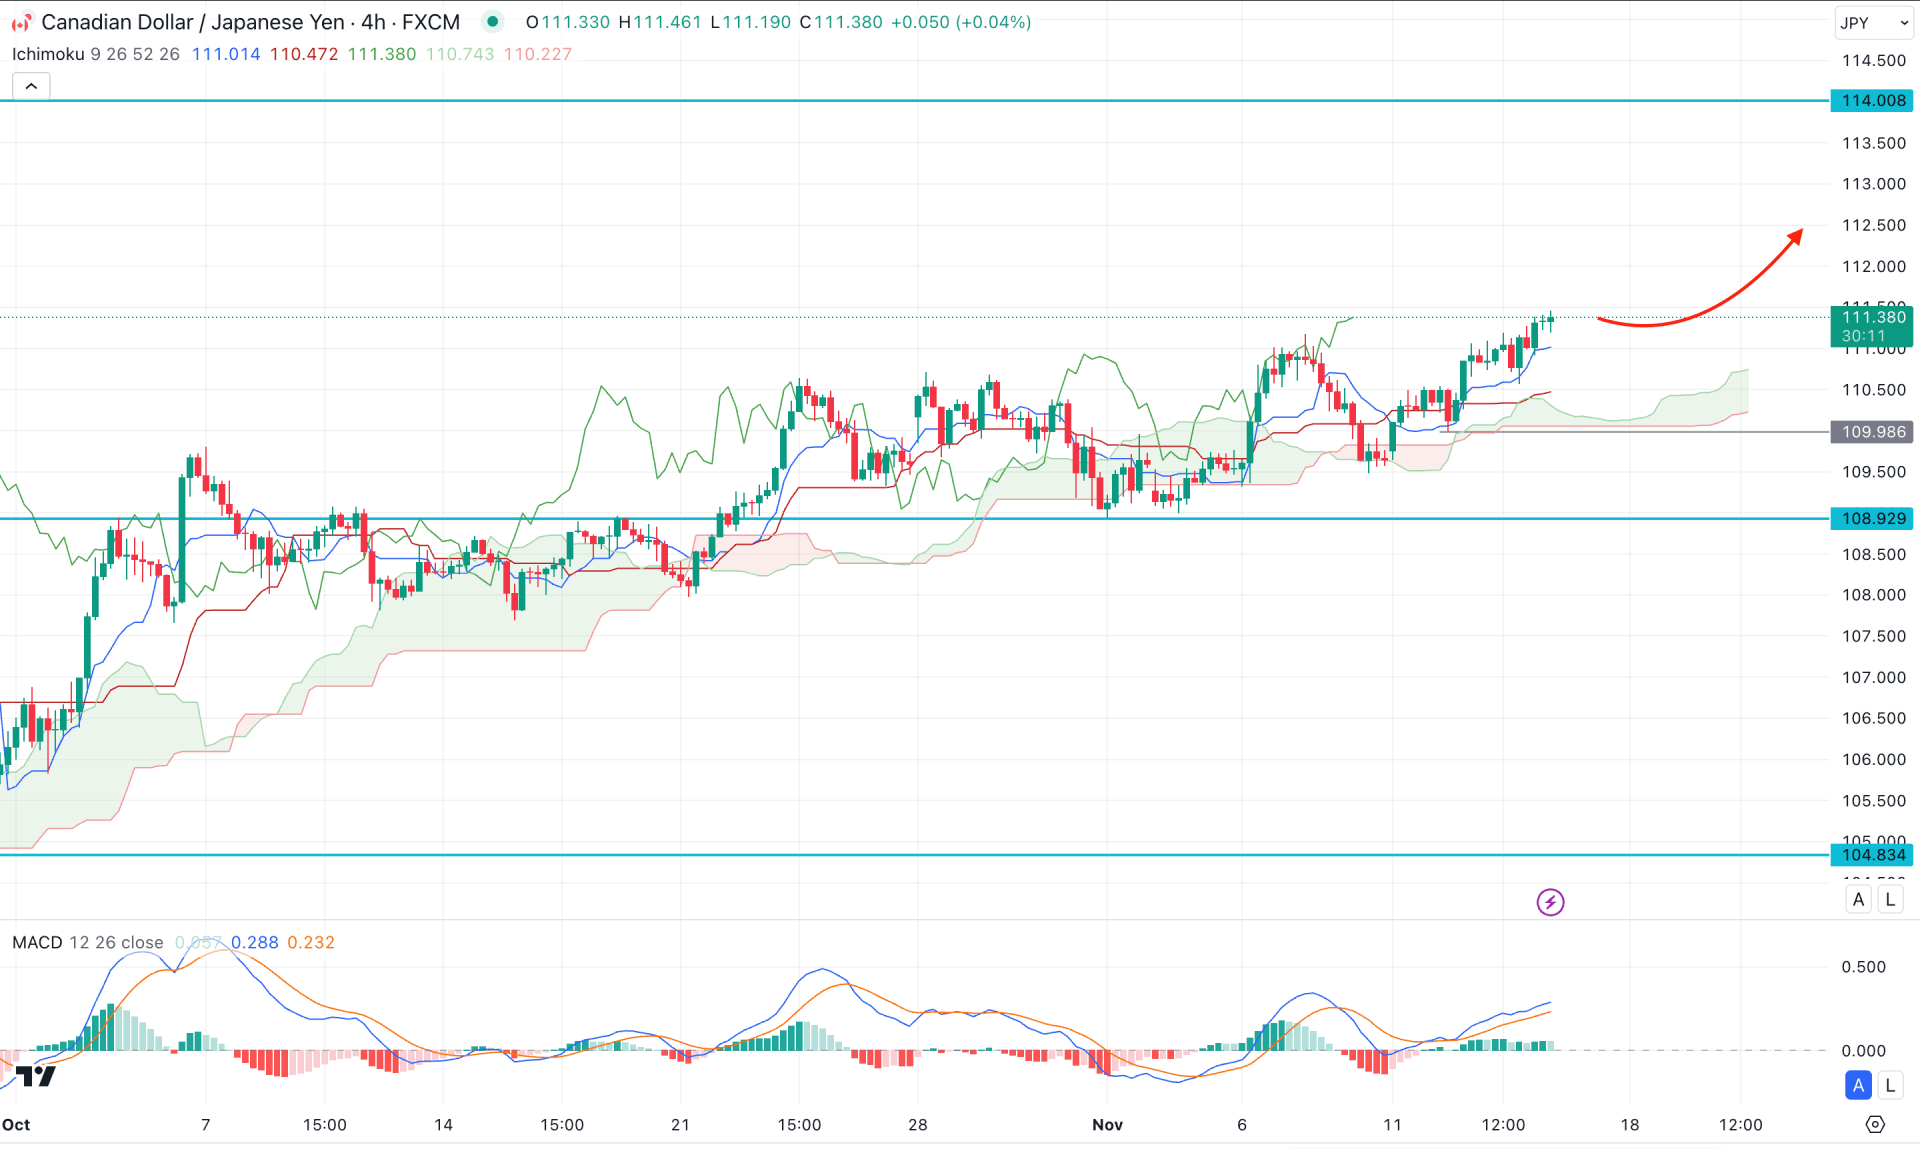
In the H4 timeframe, a bullish pressure is visible, which is within the minor upward recovery in the daily price. Moreover, the future cloud looks potent as the Senkou Span A remains steady above the Senkou Span B.
In the secondary window, the MACD Histogram hovers above the neutral line, while the Signal line is aimed higher with enough space toward the monthly high reading.
Based on this outlook, an immediate bullish continuation is possible, followed by a bullish reversal from the Kijun Sen level. In that case, the buying pressure might extend and find resistance from the 114.00 level.
Alternatively, the price can provide another long opportunity after grabbing a trendline liquidity. Therefore, another long approach from the 110.50 to 109.92 area is possible. However, breaking below the 109.90 level could invalidate the current momentum and lower the price towards the 105.00 area.

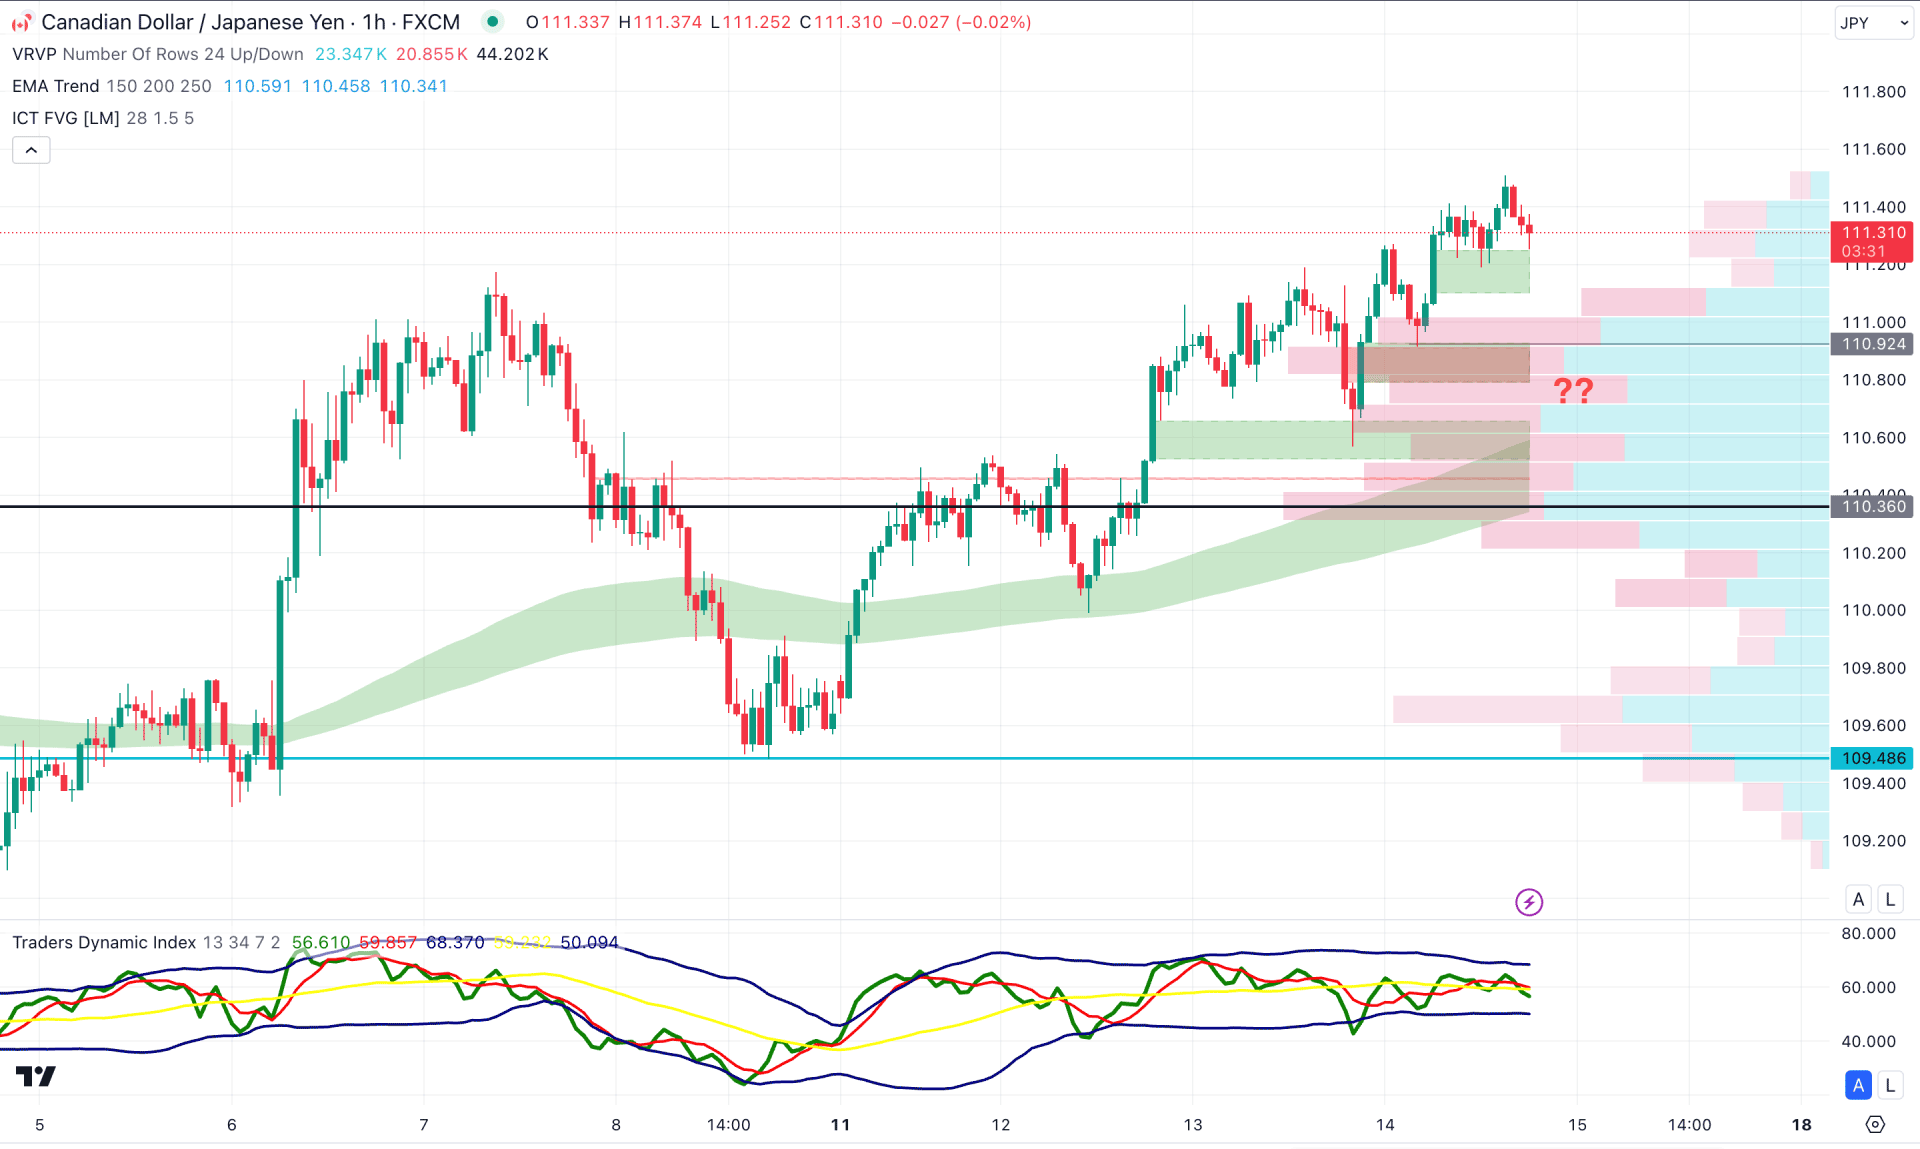
In the hourly time frame, the price is trading above dynamic lines, suggesting a bullish trend. Moreover, the price reached near the 161.8% Fibonacci Extension level from the 7-9 November swing.
However, the most recent price action shows a correction above the 111.14 high, signaling a pending profit-taking. The TDI oscillator tells a different story. The current reading is below the neutral point, with no sign of an overbought condition.
Based on the hourly structure, immediate selling pressure is pending, and the aim is for the high-volume area. However, any rebound from the trendline liquidity could grab enough momentum for the 112.00 psychological line.
Based on the current market structure, CADJPY is more likely to extend the buying pressure from the ascending triangle breakout. However, a downside correction is pending in the lower timeframe. In that case, a sell-side liquidity sweep from the triangle support could create a high probable trading opportunity.