
Published: February 19th, 2026
The CADJPY price has reached a crucial high and is poised to extend its upward pressure. However, further bullish pressure awaits a stable momentum above the near-term rectangle low before facing a fresh bet on fundamental cues.
Crude Oil has gained a bit following a major positive outlook amid renewed Iran-US tensions. It helped the commodity-linked Loonie gain against the basket of currencies, such as JPY.
On the other hand, Japan's weak GDP growth has added to the pressure on Prime Minister Sanae Takachi. The IMF has warned against cutting the consumption tax rate, as this could increase Japan's debt risk.
Let's see the further outlook of this currency pair from the CADJPY technical analysis:
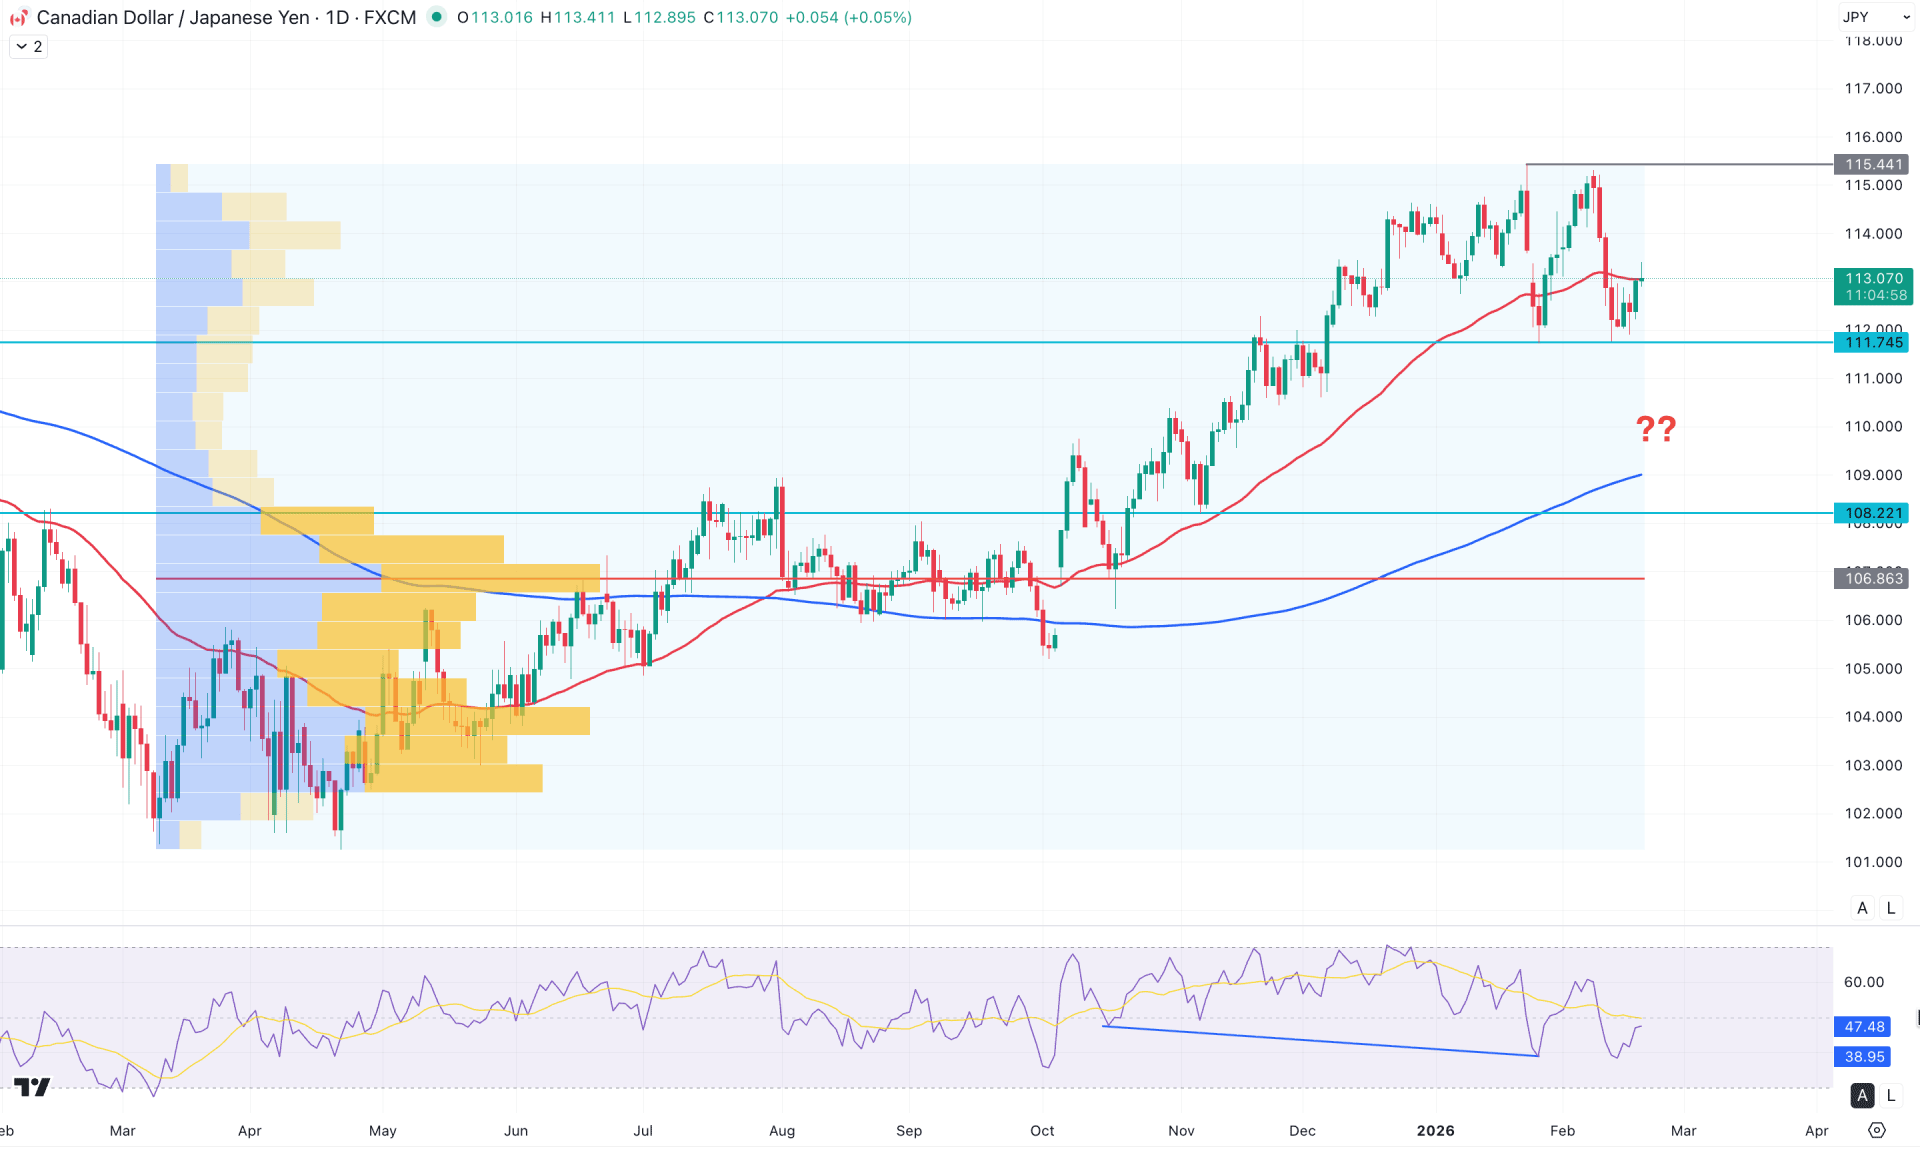
The CADJPY market outlook remains positive even though the price is currently trading near the top of the range. The pair is fluctuating within a rectangle pattern, where buying pressure from the rectangle support could present a continuation opportunity.
On the higher timeframe, the major market momentum remains bullish, with the current price trading sideways at the monthly high. As the January 2026 close formed an inside bar, a bullish breakout could trigger a continuation soon.
In terms of volume activity, the most active level since March 2025 remains below the current price, indicating underlying support. Additionally, the bullish phase from October 2025 produced a symmetrical triangle breakout; however, it failed to generate strong volume at the top. As long as the existing high-volume support remains intact, the primary focus should be on long positions, even if there is some short-term downside correction.
On the main chart, the 200-day SMA is acting as major support, holding below the overall structure. Meanwhile, the 50-day EMA is closer to the current price, suggesting a bullish rebound possibility.
In the secondary indicator window, the Relative Strength Index (RSI) is holding above the 30.00 oversold level, suggesting a bullish continuation. Although the RSI line shows a divergence, there is no significant price action yet to confirm a strong reversal.
Based on the current market structure, a bullish daily close above the 50-day EMA could open a long opportunity targeting the 115.45 level. However, any bearish rejection of the 50-day EMA, accompanied by consolidation, could increase the probability of a pullback toward the 110.00 psychological level before offering another long setup.
Extended downside pressure, with a break below 110.00, could push it towards the 106.86 high-volume support zone.
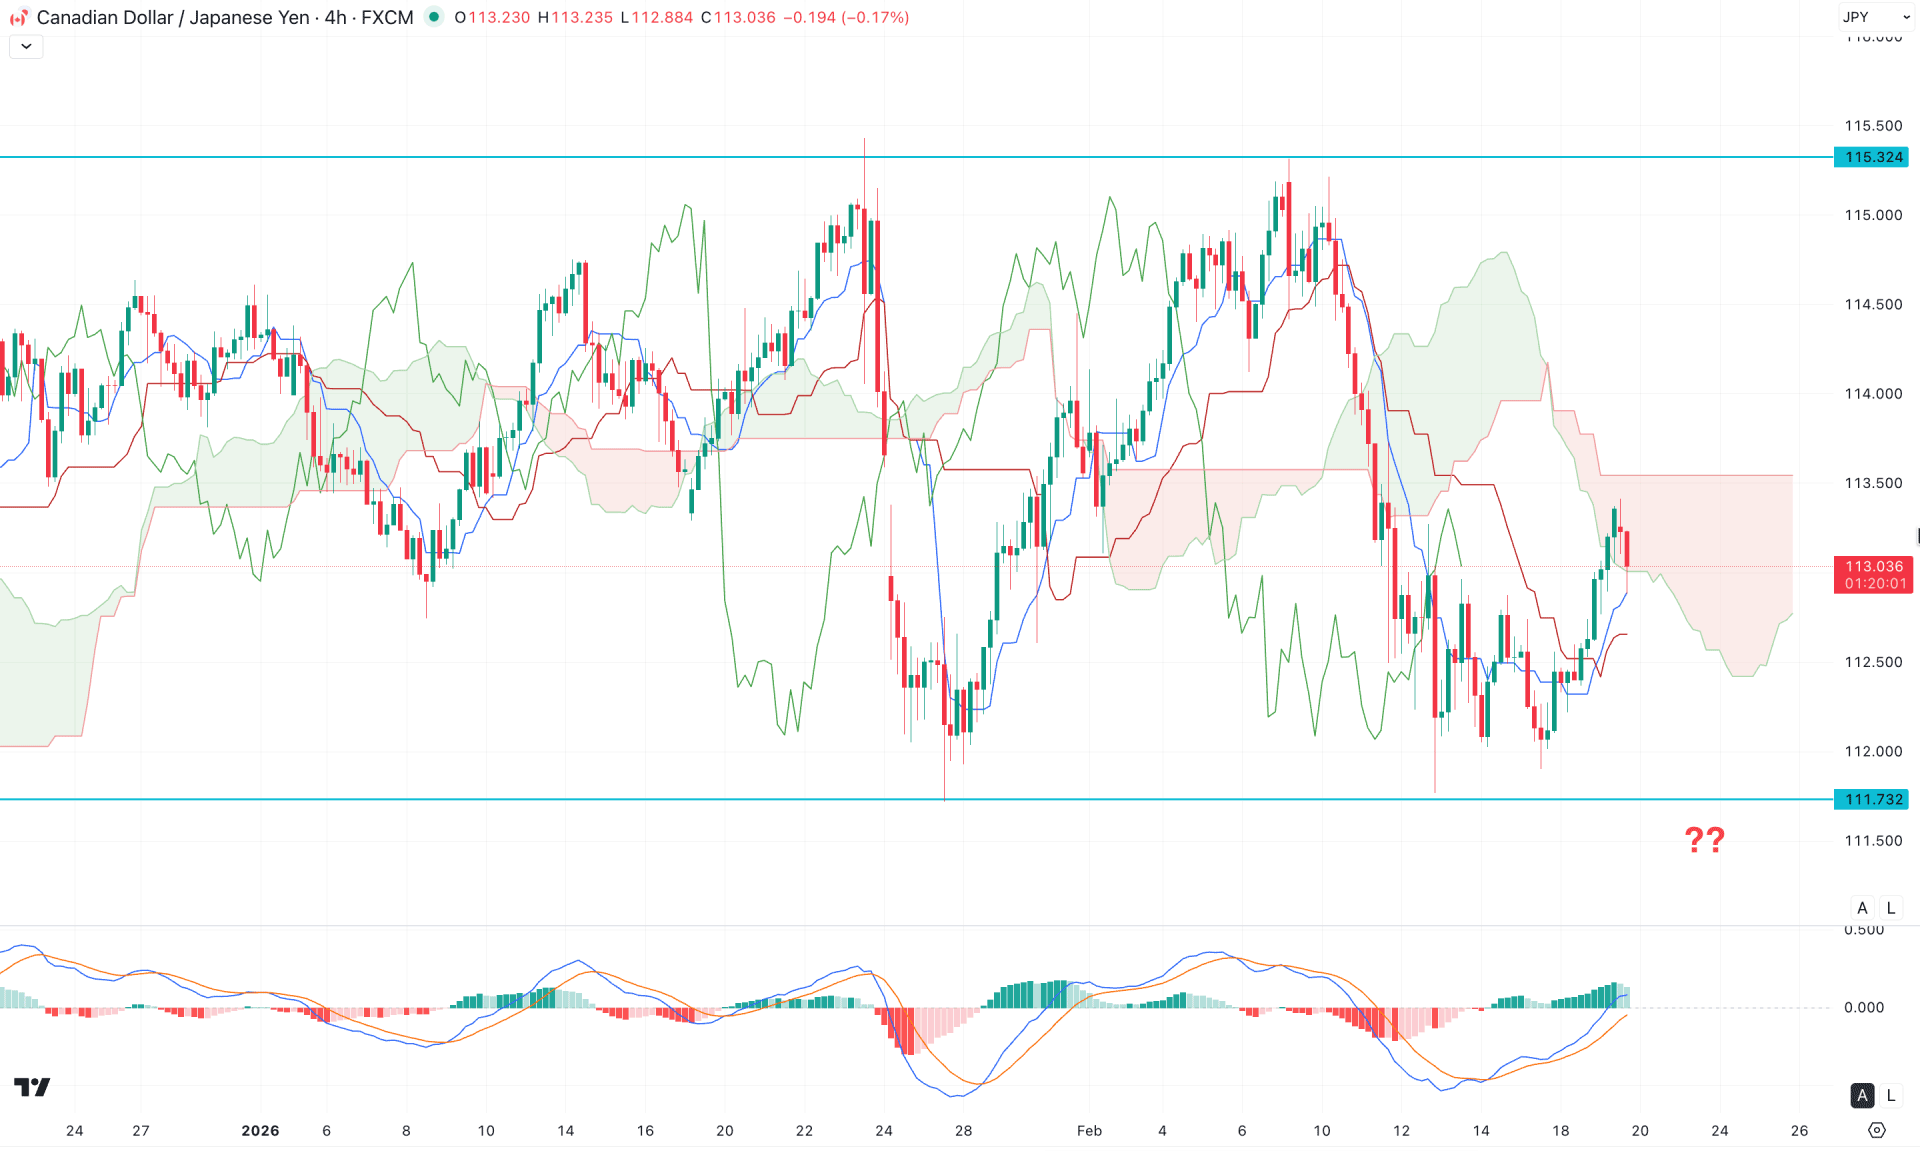
In the H4 timeframe, the market momentum is sideways, with multiple violations of the Ichimoku Cloud zone. Moreover, the Future Cloud shows a mixed structure, where the Senkou Span A is aimed higher, below the flat Senkou Span B.
Moreover, a bullish rebound is visible above the dynamic Kijun Sen line, suggesting minor bullish activity in the price.
In the secondary indicator window, the MACD Histogram maintained a positive outlook, remaining above the neutral line for a considerable period. Moreover, the dynamic Signal line is having a bullish slope from the overbought area, signalling a valid bottom formation.
Based on the H4 market outlook, a potential range extension could offer a long opportunity, with a bullish H4 close above the Cloud area serving as a long signal. On the bullish side, the immediate resistance is at 115.32, which must be overcome before validating the long-term bullish trend continuation.
On the other hand, a failure to hold the price above the Kijun Sen line could initiate an immediate short movement towards the 111.73 support level, before moving below the 110.00 level.
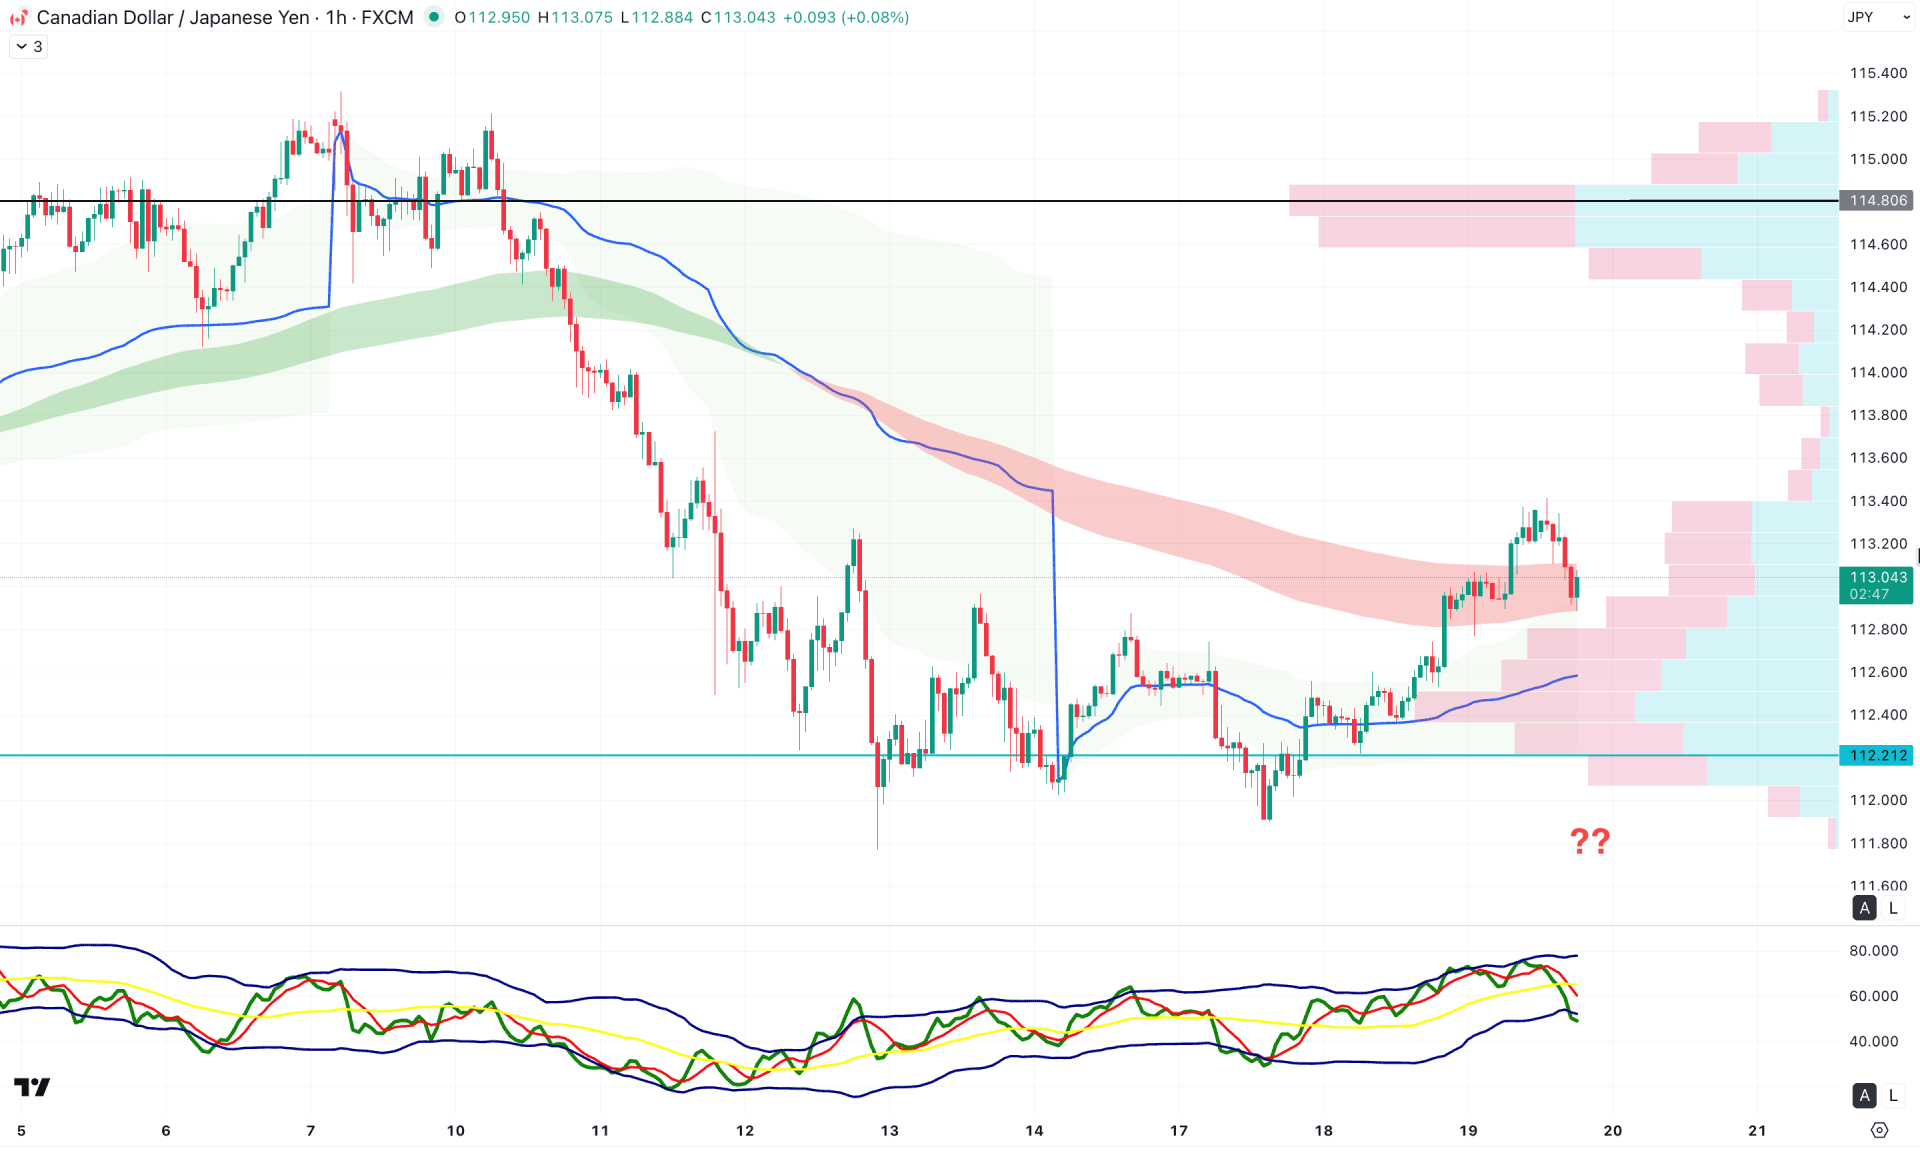
On the hourly timeframe, CADJPY is trading within a bullish correction after forming a valid bottom at 111.76. As the bullish rebound is visible from a significant low, the primary objective for this pair is to look for long trades only.
Furthermore, the intraday high-volume line remains above the current price, which provides supportive pressure on the bullish side. On the other hand, a bullish break is visible in the EMA wave, supported by the rising weekly VWAP, signalling ongoing buying pressure.
In the secondary indicator window, the Traders Dynamic Index (TDI) has fallen to a lower level despite the recent market rebound. In this case, a rebound in the TDI above the 50.00 level could extend the buying pressure.
Based on this hourly structure, the primary aim is to look for long setups as long as the weekly VWAP remains below the current price. On the bullish side, the immediate support is at 111.80, with a target of 116.00.
On the bearish side, failure to hold the VWAP above 112.21, with a bar closing below it, could put pressure on buyers. In that scenario, the price may revisit the 111.00 level to fill the imbalance before forming another long opportunity.
Based on the overall market structure, CADJPY is trading near support, suggesting a discounted price area following the major bullish move. Investors should closely monitor price action. Any bullish rejection from the near-term intraday support area could signal a bullish trend-continuation opportunity.


