
Published: May 17th, 2022
JPY remains under pressure as there is no decision about the currency rate by the Bank of Japan. The inflation in Japan keeps rising, and the nominal wages rate in March showed an improvement of 1.2% year over year. On the other hand, household spending moved down by -2.3% due to the lower-income and higher consumer spending. Final services PMI for April showed development by moving to 50.7 level, but new orders remained falling while the exports showed a development. This week, investors will see the preliminary GDP, expected to move from -1.3% to -1.0%.
On the other hand, the CAD failed to get enough profit from the increased oil price shown in the USDCAD price, which struggled to remain stable above the 1.30 level. However, the CAD maintained its dominance against other currencies, where the CADJPY bulls made a 14.73% gain from 8 March 2022 to 21 April 2022. The CAD CPI is expected to come this week for April, where the current expectation decreases from 1.4% to 0.5%. If the result is better than the previous report, the CADJPY bulls may resume testing the 102.93 swing high.
Let’s see the future price direction from the CADJPY technical analysis.
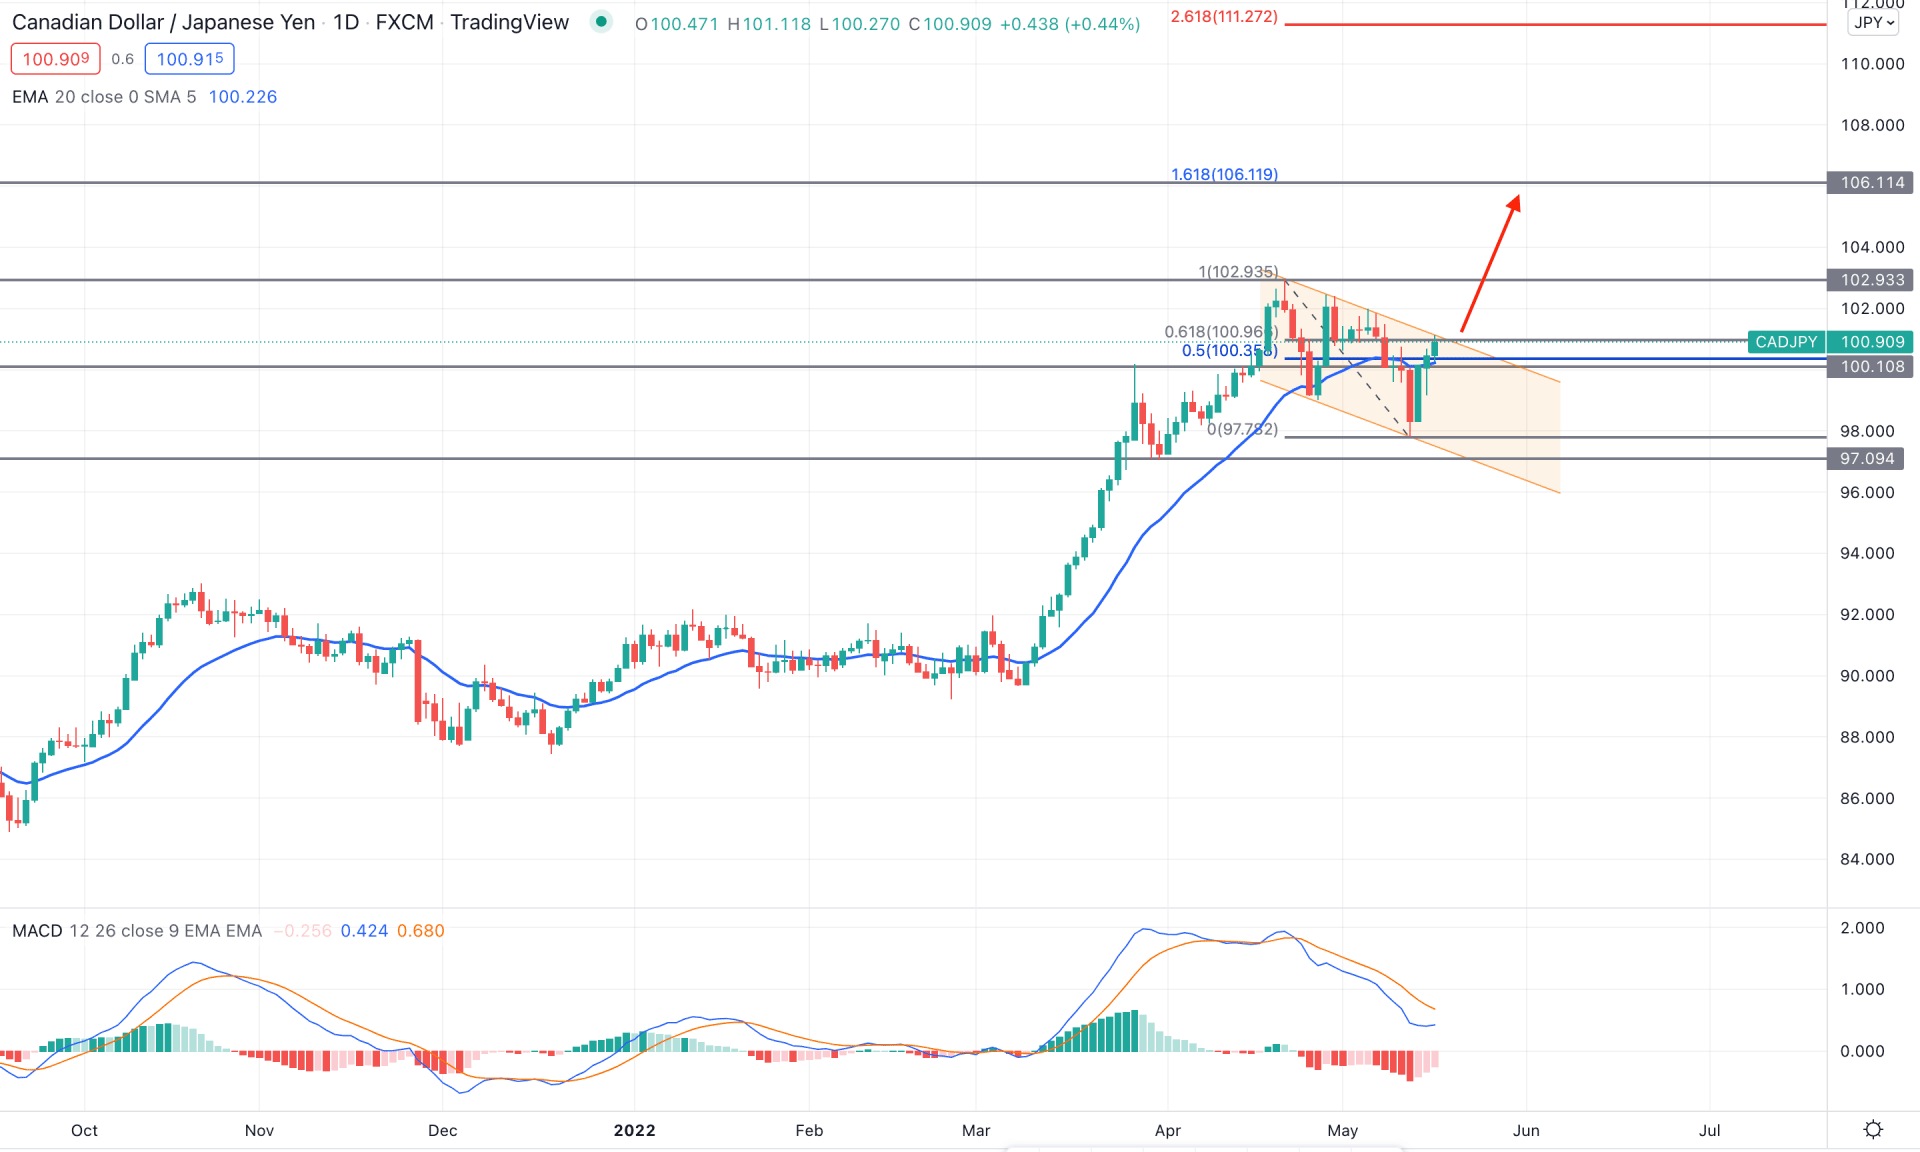
CADJPY bulls maintained a stable buying pressure since the beginning of 2022 that pushed investors to make 1192 pips movement from the yearly opening price. Although the price remained corrective in the first three months of the year, the bullish break of structure on 11 March 2022 came with a massive buying pressure by keeping the price unmitigated. However, the recent formation of the bearish channel came with a strong bearish daily candle below the dynamic 20 EMA, but on the next day, bulls recovered the loss. Moreover, the current price trades above the dynamic support with no sign of sellers’ presence.
The above image shows that the price remained corrective within the bearish flag pattern, where any bullish daily close above the flag resistance would be a buy signal for this pair. The MACD Histogram remained bearish but squeezed to the zero level in the indicator window while the MACD line remained positive.
Based on the current price structure, a bullish daily candle above the channel resistance would resume the broader bullish trend where the primary aim is to test the 106.11 level, which is the 161.8% Fibonacci Extension level of 27 April high to 1 May low. On the other hand, the price left some unmitigated price action during the break of structure on 11 March 2021 that may fill if bulls fail to hold the momentum above the 97.09 key support level.
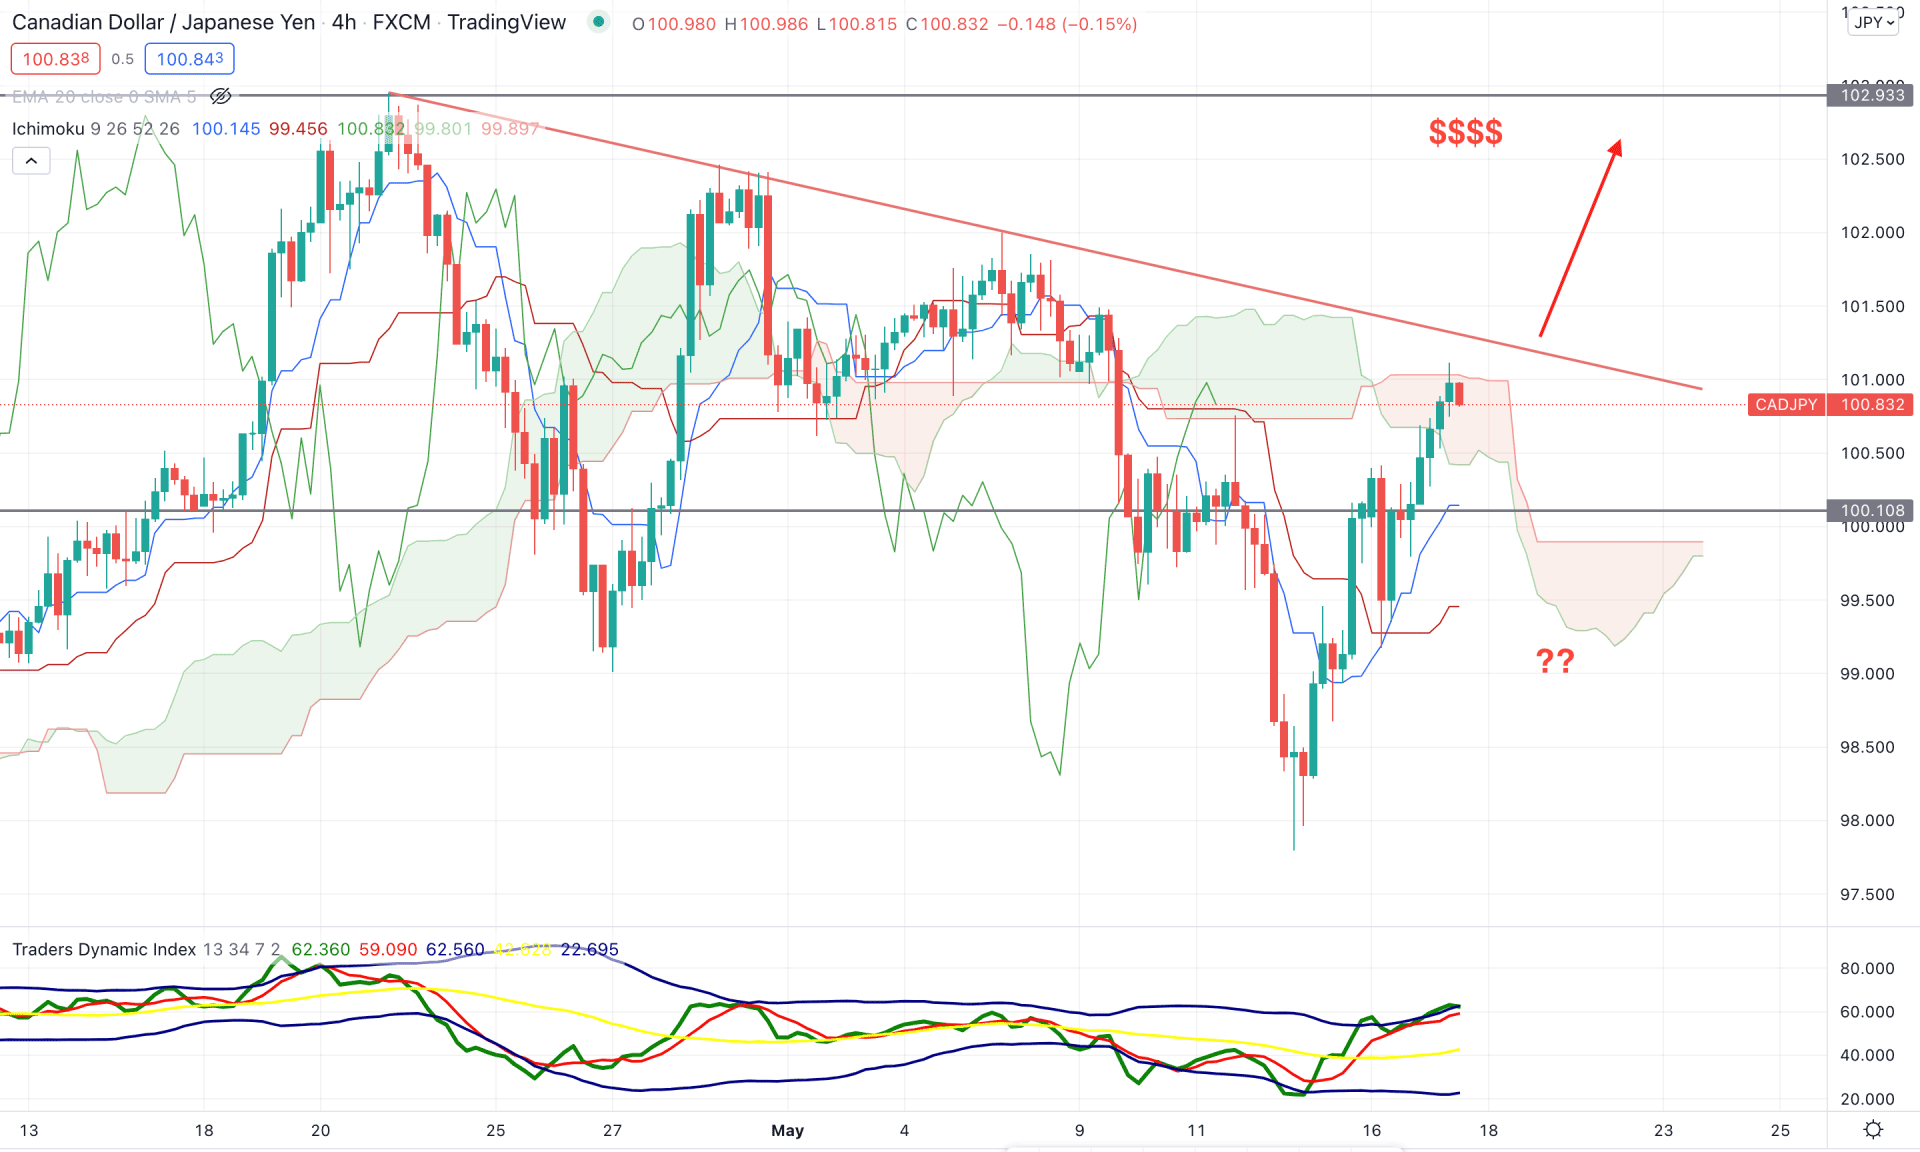
According to the Ichimoku Cloud analysis, the broader market context in the CADJPY is indecisive as the current price is trading within the Kumo Cloud. Moreover, in the future cloud, Senkou Span A and Senkou Span B remain closer, a primary sign of a breakout. On the other hand, the price is approaching the trendline resistance, where the possibility of grabbing retail liquidity is high.
The above image shows how the price approaches the trend line resistance while buyers’ strength remains strong. In the indicator window, the Traders Dynamic Index shows that the TDI line reached the upper band, which is a sign of a strong buyers’ presence. Moreover, the bullish momentum may extend if bulls hold the TDI line above the 50 level.
Based on the H4 context, bulls are more likely to show a breakout above the current trendline resistance and grab the retail liquidity. In that case, the primary target of the bull run is to test the 102.93 support level from where a bearish correction may appear. On the other hand, the alternative approach is to wait for a bearish breakout below the dynamic Kijun Sen with an H4 close before aiming toward the 98.00 level.
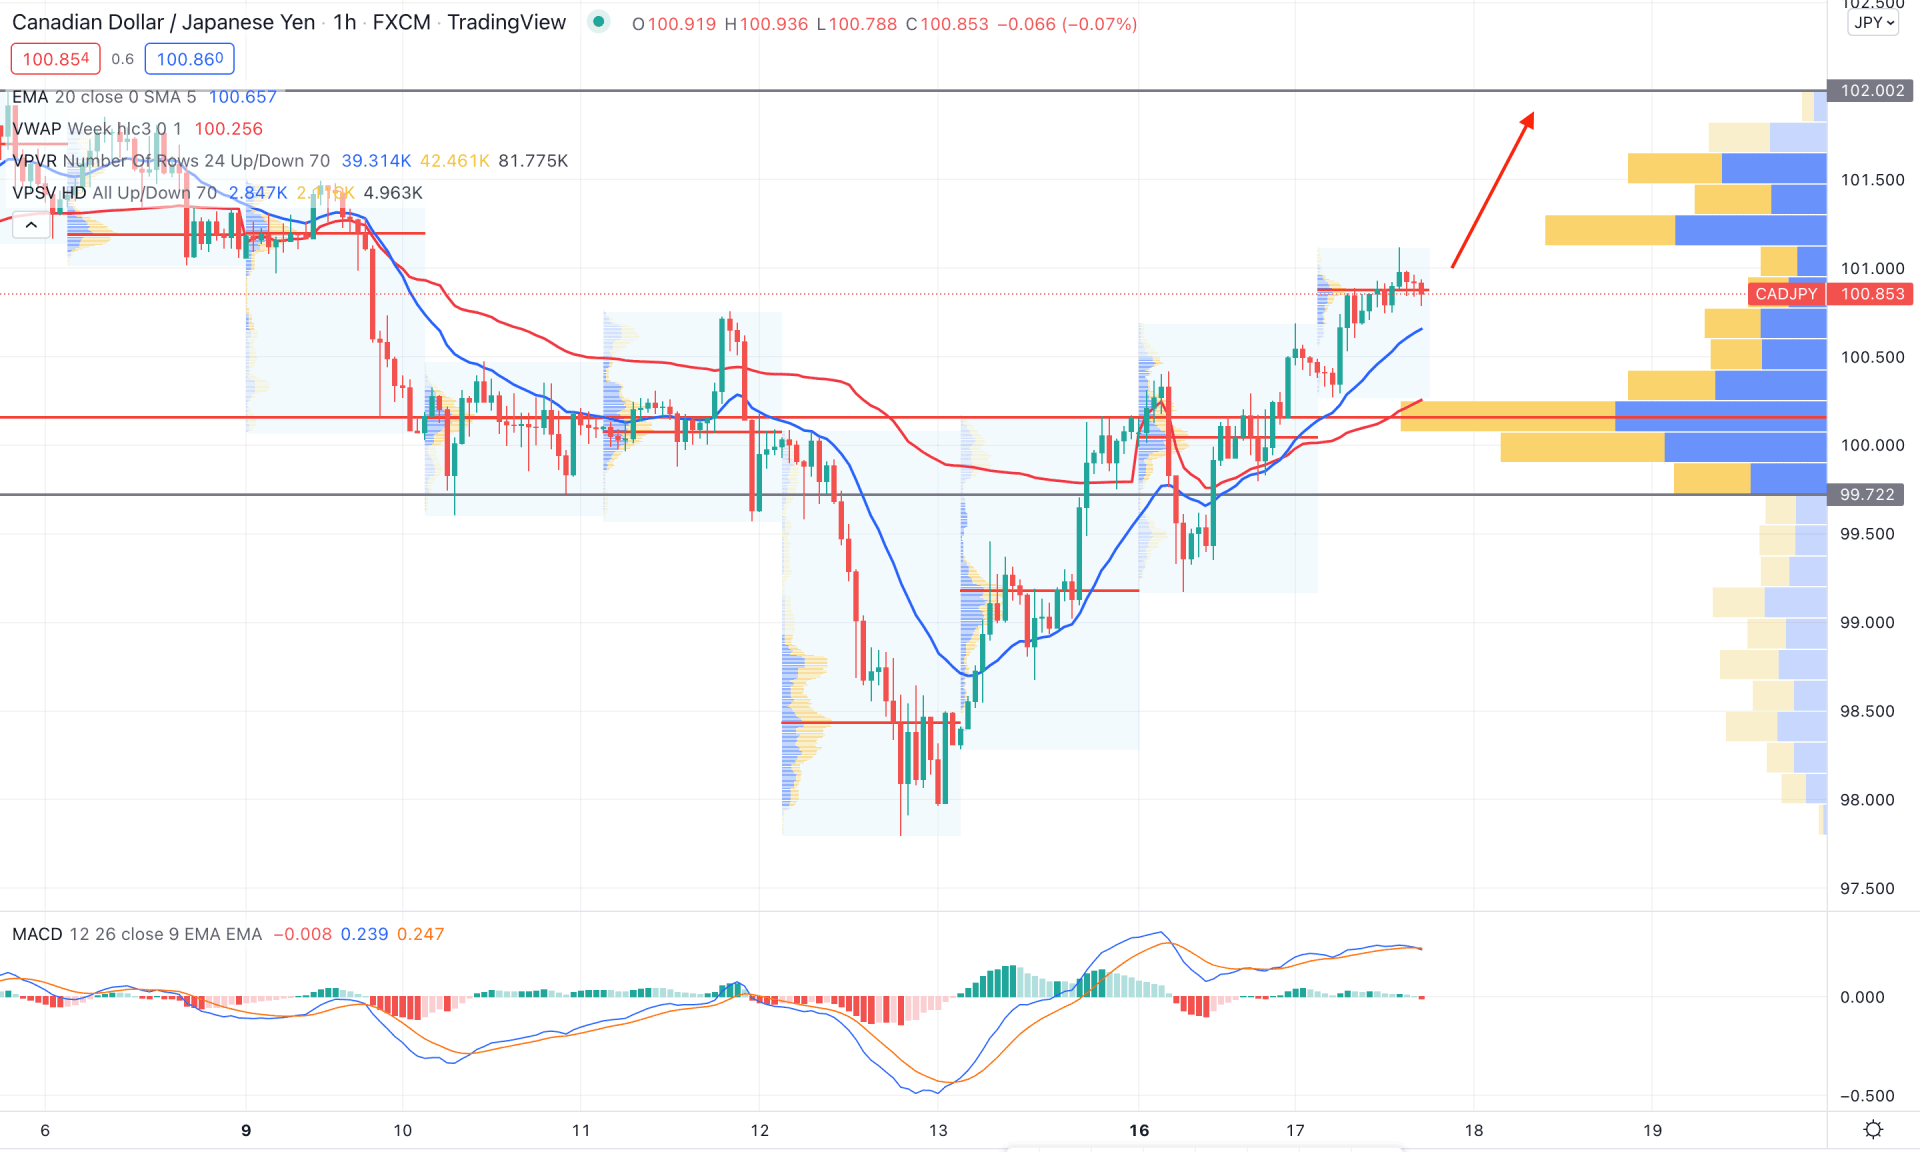
In the intraday chart, CADJPY trades within a bullish pressure where the most recent price has been above the dynamic 20 EMA for a considerable time. Moreover, the price is closer to the intraday high volume level from where another buying pressure may come.
The above image shows that the highest volume from the visible range was at the 100.08 level, which is below the current price. Moreover, in the indicator window, the MACD Histogram is corrective at the zero level with less activity. Meanwhile, the weekly VWAP is below the price and working as minor support.
Based on the H1 context, the buying pressure is valid as long as it trades above the dynamic weekly VWAP level, where the primary aim is to test the 102.00 level. On the other hand, the break below the 100.08 level with a strong selling pressure would be the first sign of the possible bearish pressure in the price towards the 98.00 level.
As per the current market context, CADJPY is more likely to extend the current bullish pressure if the price shows a bullish channel breakout. However, investors should monitor the lower timeframe price action to find the best price before taking a trade.