
Published: May 1st, 2025
The Liberal Party's win in the Canadian federal nomination process, which fortifies current Prime Minister Mark Carney's stance in trade talks with the US, continues to support the Canadian dollar (CAD). But the recent decline in crude oil prices to a level that hasn't been seen in almost three weeks negated the positive reasons.
On the JPY side, the Bank of Japan (BoJ) board members agreed to maintain the immediate interest rate target in the range of 0.40% to 0.50%.
In the recent chart, the Japanese yen (JPY) falls against the basket of currencies, compounding the dovish losses caused by the Bank of Japan (BoJ). Following the post-meeting press briefing, BoJ Governor Kazuo Ueda stated that the timeframe of fundamental inflation to reach the 2% target will be somewhat delayed, but the intraday selling bias persisted. This keeps the JPY weak and dampens prospects for an interest rate increase in June or July.
In April 2025, the ultimate au Jibun Bank Japan Manufacturing PMI was 48.7, above both the 12-month low of 48.4 in March and an unexpected reading of 48.5. Although it doesn't offer much of a boost ahead of the major central bank event risk, this is nevertheless the tenth consecutive month of a drop in factory activity.
Let's see the complete outlook of this pair from the CADJPY market analysis:
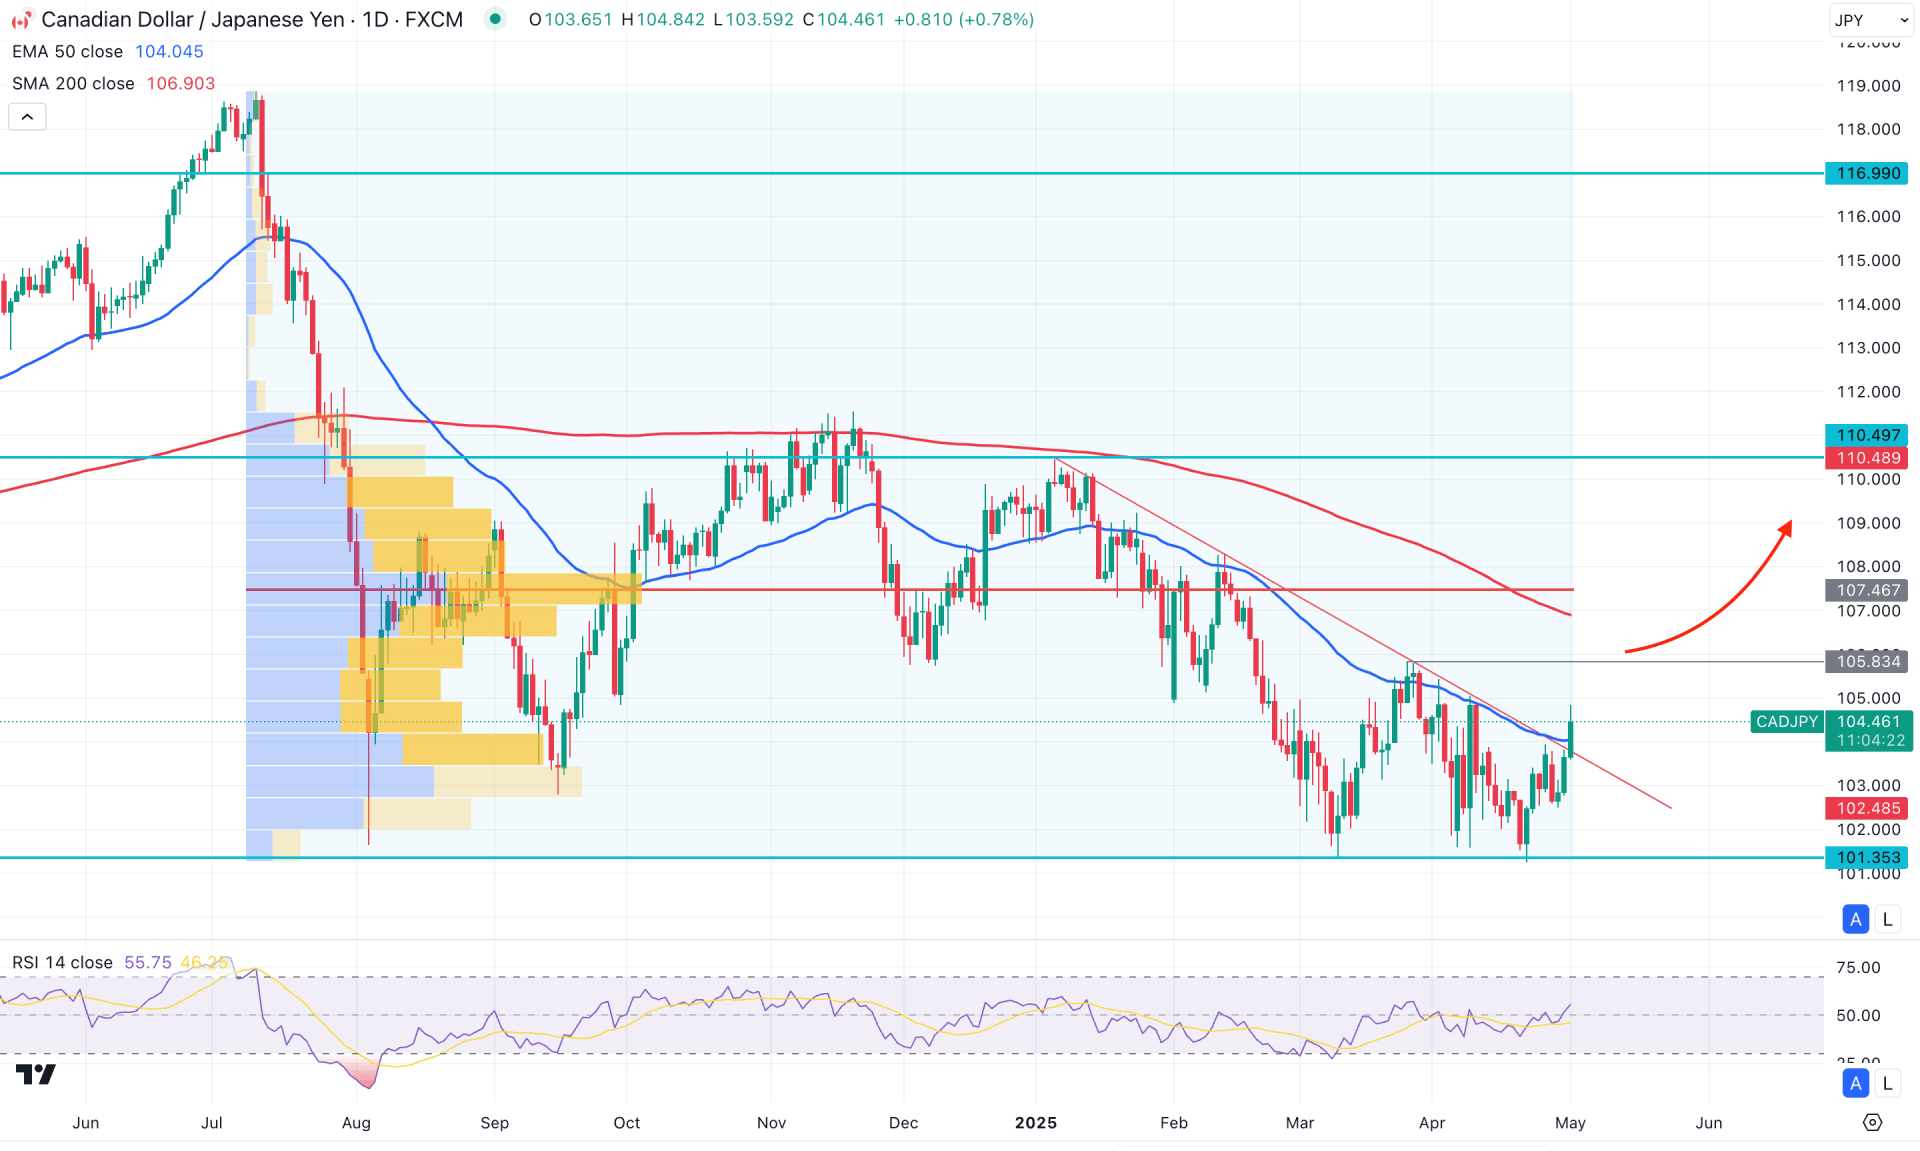
On the daily chart of CADJPY, the existing bearish pressure appears to have found a bottom, as the recent downside momentum came with corrective characteristics. A potential double-bottom pattern is forming, suggesting that investors may wait to see how the price reacts to a new swing high.
On the higher time frames, multiple indecision candlesticks are visible on the monthly chart, indicating the need for a range breakout. Meanwhile, the weekly candle remains sideways after testing the 101.35 bottom, from where a bullish recovery is possible.
In the volume structure, the price appears oversold, as no significant lower low has formed since March 10, 2025. However, further confirmation is required before anticipating a bullish trend reversal, as the high from July 2024 still remains above the current price.
On the main price chart, the dynamic 200-day SMA is still above the current price and is trending lower from the previous high-value area. Conversely, the 50-day EMA is now below the current price and is acting as a support, indicating the presence of buying pressure.
Based on the current market structure, a bullish continuation above the 105.83 daily resistance could validate the double-bottom formation. In that case, the price is likely to revisit the 200-day SMA and potentially test the 110.49 key resistance level.
On the other hand, current buying pressure above the trendline resistance could trigger a buy-side liquidity sweep. A recovery followed by a breakdown below the 103.00 level may resume the existing bearish trend, targeting levels below the 101.00 area.
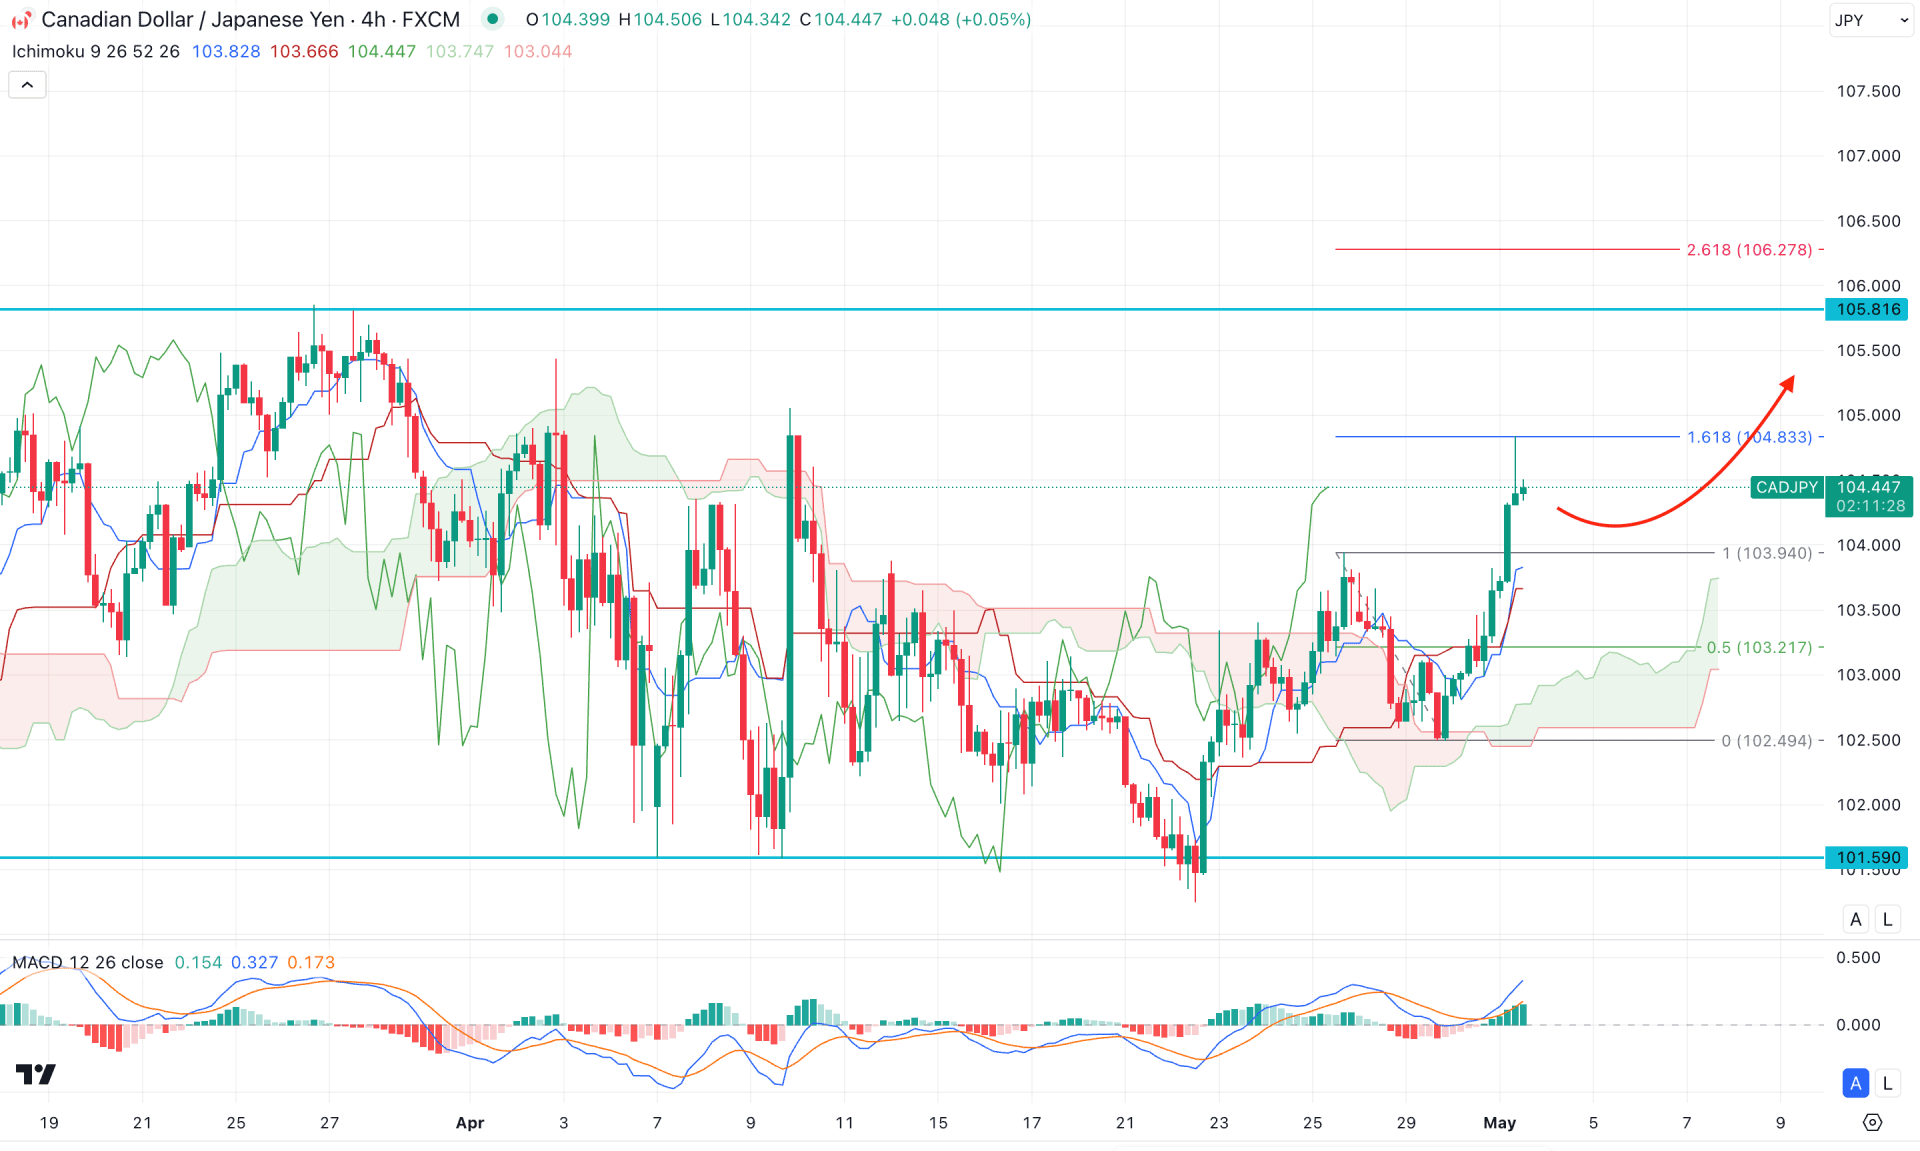
In the H4 timeframe, the recent price showed a buying pressure above the cloud area, signalling a primary bullish pressure. On the other hand, the existing market momentum is extremely sideways as a massive congestion is visible on the left.
As per the Ichimoku Cloud structure, the Futures Cloud is extremely bullish as the Senkou Span A and B are aiming higher. Moreover, the Tenkan Sen and Kijun Sen lines are below the current price, working as a confluence of buying pressure.
In the indicator window, the MACD Histogram remains steady bullish, while signal lines are above the neutral area. However, the Signal line has reached the highest level in a month, with a flat Histogram signaling a pending downside correction.
Based on the H4 outlook of CADJPY, the bullish continuation is potent as long as it trades above the Ichimoku Cloud zone. A valid bullish reversal from the dynamic Kijun Sen level could be a bullish continuation opportunity, aiming for the 106.81 level.
On the other hand, the buying pressure has reached the 161.8% Fibonacci Extension level and completed the bullish ABCD correction. In that case, a potential bearish signal is visible, which might initiate from the 104.80 to 105.80 zone.
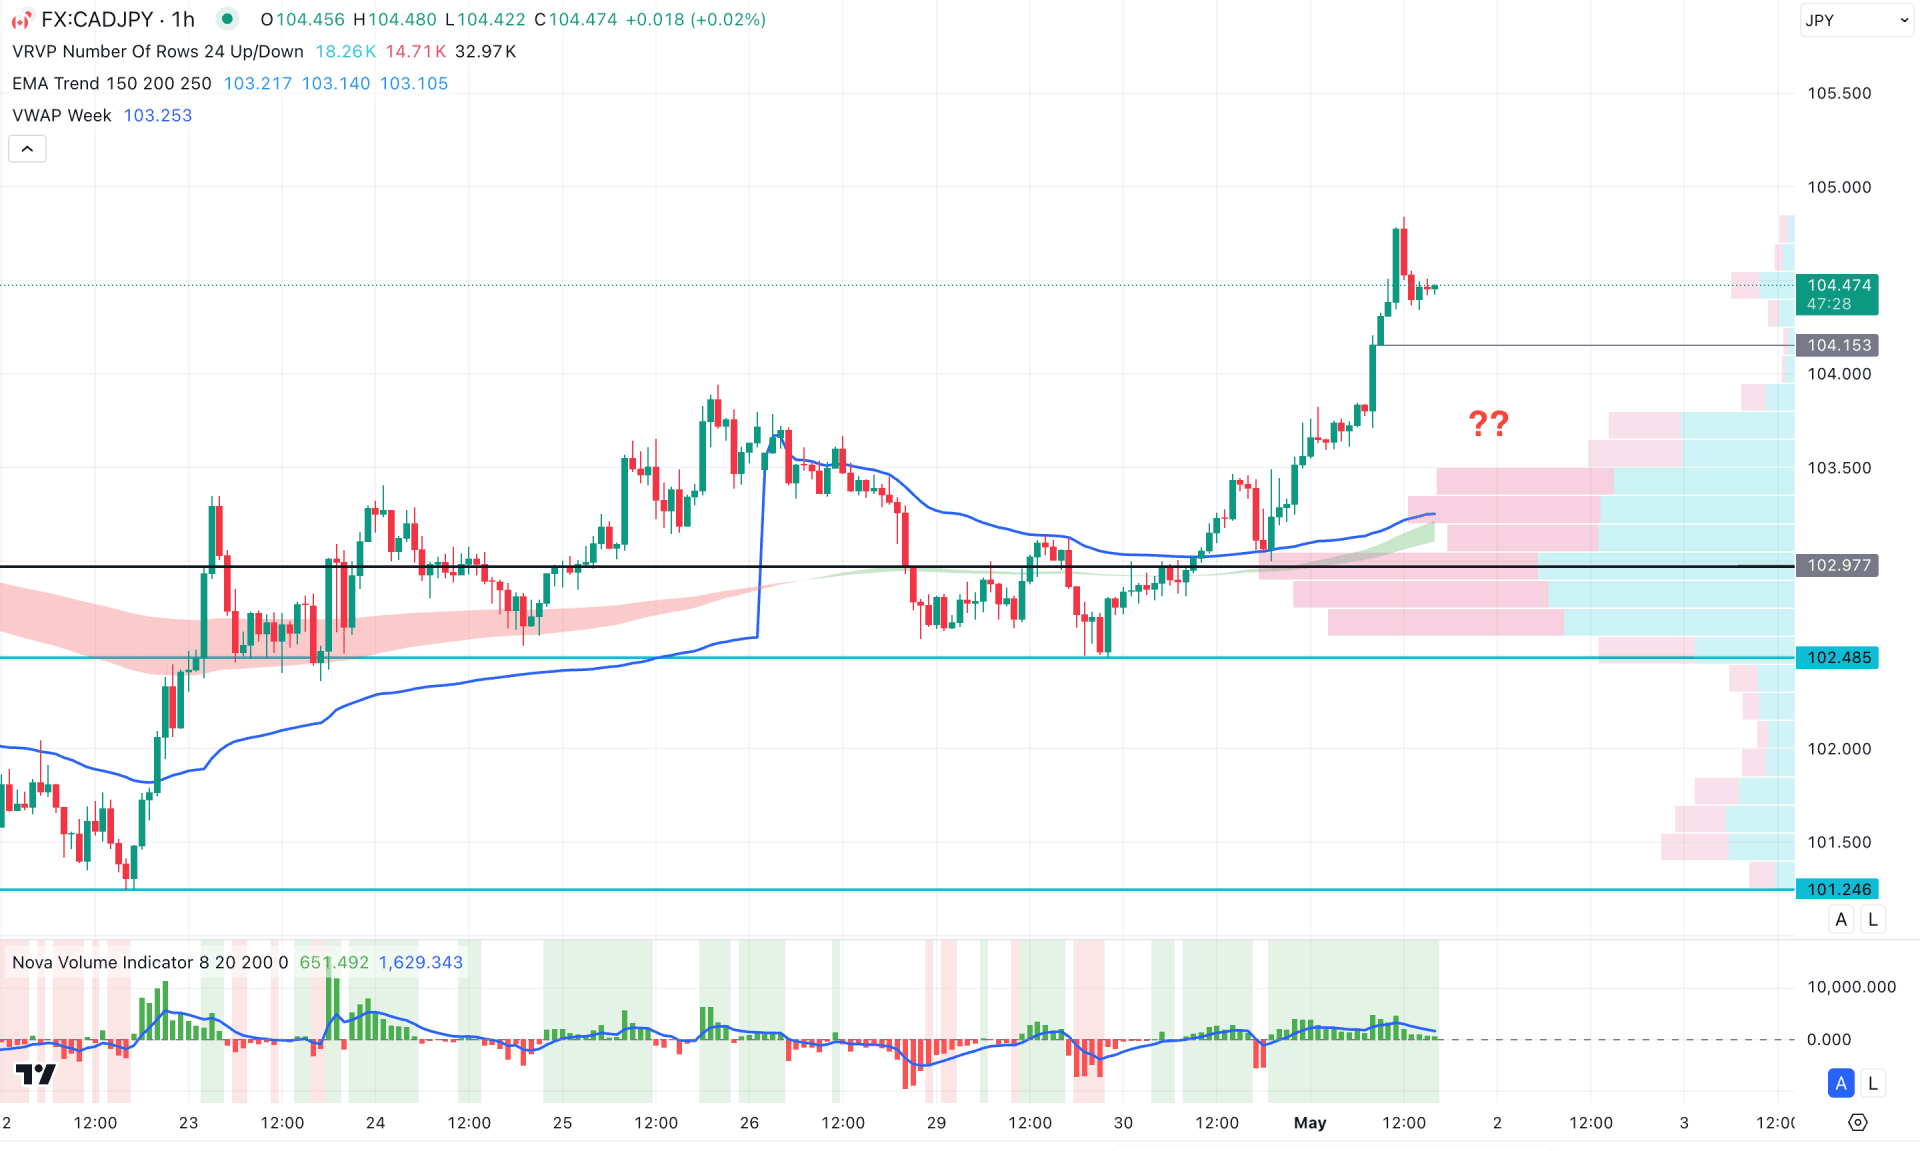
In the hourly time frame, an ongoing buying pressure is visible as the current price hovers above the Visible Range High Volume line. Moreover, the EMA wave is below the current price along with the VWAP line, suggesting additional buying pressure.
On the other hand, the Volume Histogram remains closer to the neutral point, signalling a lower trading activity. Moreover, the gap between the current price and dynamic lines has widened, opening a possibility of a mean reversion.
Based on this outlook, a bearish H1 candle below the 104.15 level could lower the price towards the EMA wave area, from where a bullish reversal could come.
However, an extended selling pressure below the 102.97 level could initiate a bearish reversal towards the 101.24 support level.
Based on the current multi-timeframe analysis, CADJPY could initiate a bull run once the bottom is confirmed with a new swing high formation. As of now, the intraday price is bullish, from where a decent downside correction is pending.


