
Published: September 21st, 2023
The decline in oil prices has hurt the Canadian dollar, as Canada is the leading crude exporter to the United States. The Canadian Consumer Price Index (CPI) for August rose to 4.0% year-over-year, up from 3.3% in July, according to data released on Tuesday. The core CPI, which excludes volatile energy and food prices, increased from 3.2% to 3.3% year-over-year. These figures may prompt the Bank of Canada (BoC) to contemplate additional interest rate increases.
Sharon Kozicki, Deputy Governor of the Bank of Canada, has emphasized that the fluctuations observed in recent months are not unusual. This is why the central bank focuses primarily on core inflation measures.
On a different note, in remarks made by Japan's Chief Cabinet Secretary Hirokazu Matsuno, he stated that he does not rule out any options in response to currency fluctuations. For the Yen, it could raise the possibility of government intervention to support the currency. Moreover, speculation that the Bank of Japan (BoJ) may abandon its negative interest rate policy is positive for the Japanese Yen (JPY).
Based on this outlook, the Japanese Yen could rise against the Canadian Dollar, leading to a strong market reversal for CADJPY bulls.
Let’s see the upcoming price direction of this pair from the CADJPY technical analysis:
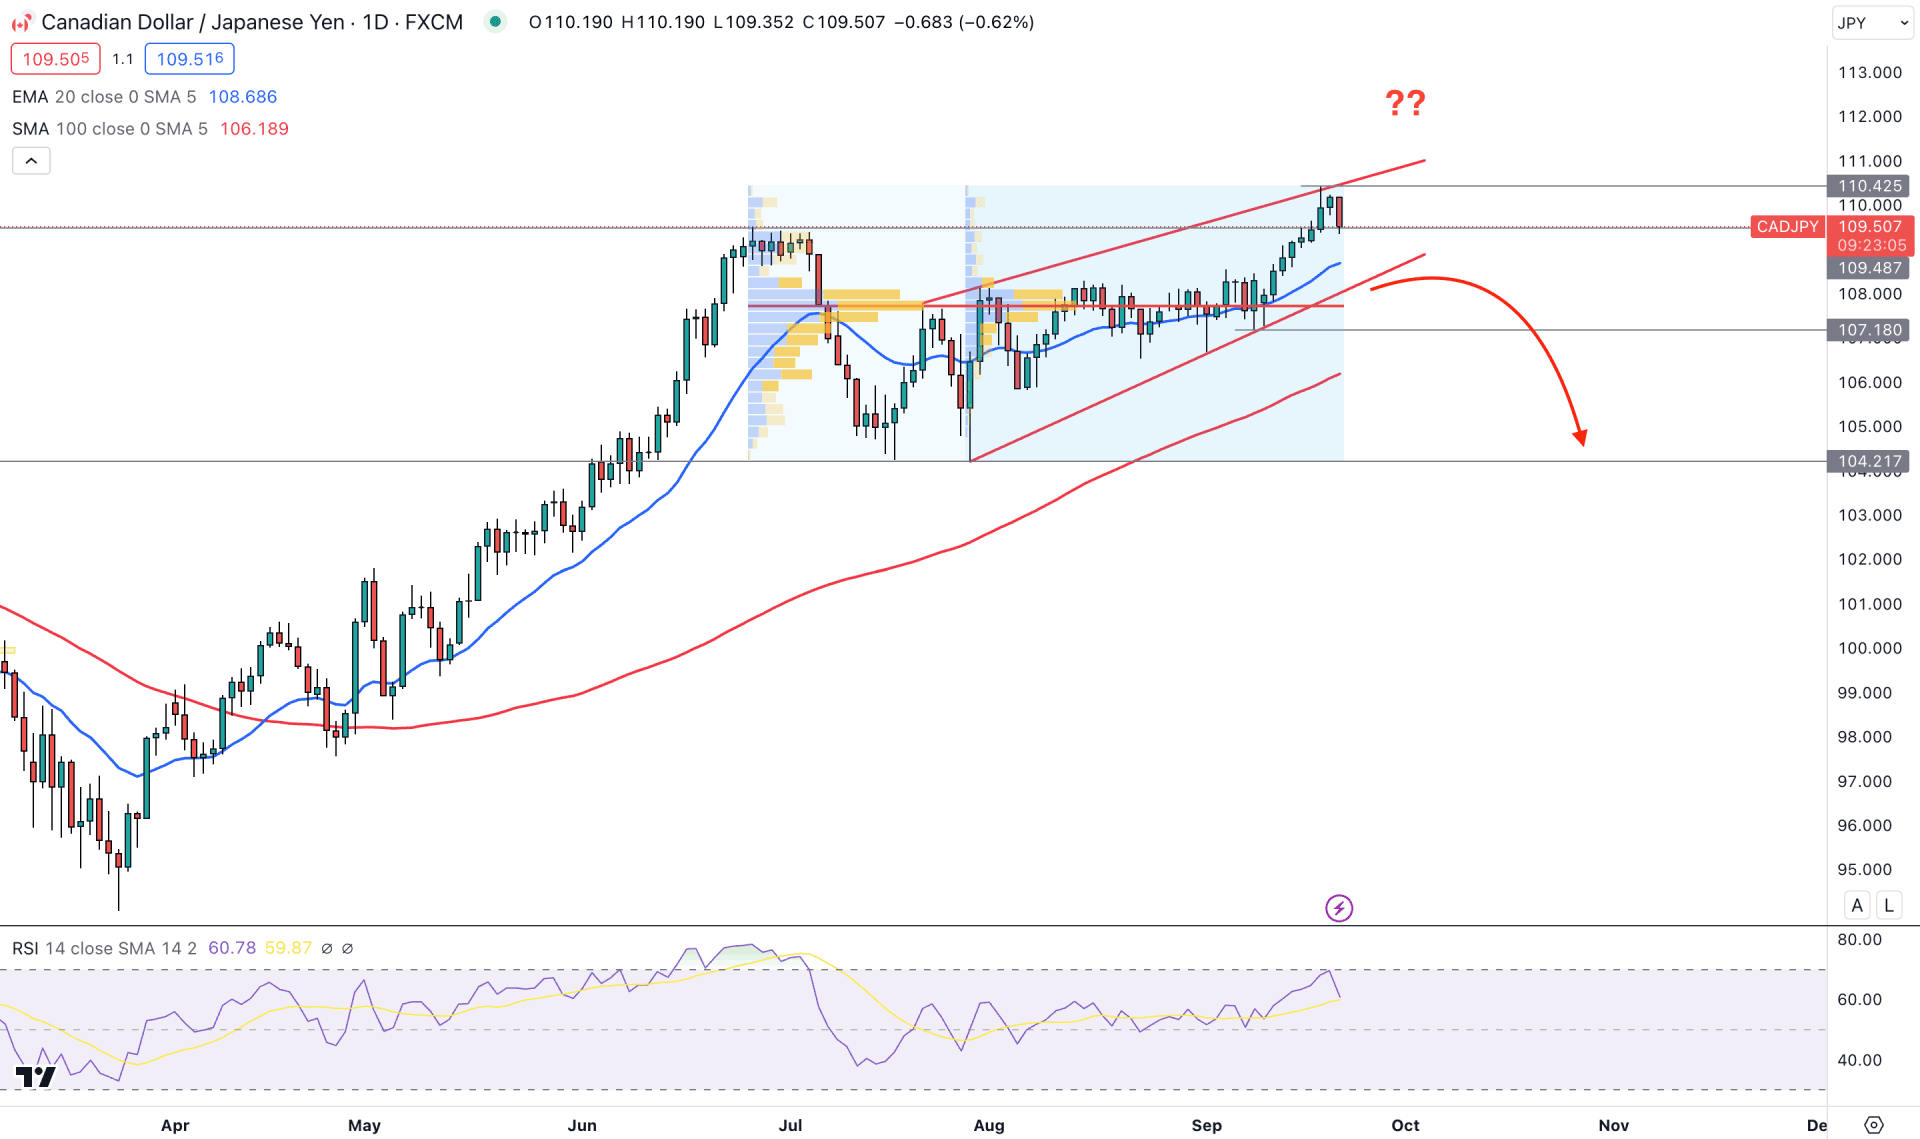
In the daily price of CADJPY, the overall market outlook is bullish as the recent price shows a strong upward pressure from the March 2023 low. Moreover, the bottom was formed with a sell-side liquidity sweep from the 94.58 swing, which initiated a valid bullish impulsive trend. However, the recent price shows an upward overextension by making a new 2023 high, which is a strong liquidity zone.
A bearish trend continuation is potent in the higher timeframe as the monthly candle reached the September 2022 resistance. However, the weekly candlestick is still bullish, which needs a valid bearish rebound before relying on the downside pressure.
The daily chart shows a potential bearish opportunity from the rising wedge wedge formation. Within the pattern, the 109.48 level would be crucial as an immediate bearish rebound from this level could indicate a strong liquidity grab. However, an additional bearish sign is needed from the wedge breakout with solid support from volumes.
In the fixed range high volume level, the most active level since the 27 June high and 28 July low is at 107.66 levels. As both levels are at the same place, a bearish pressure below this area could be a strong sell signal.
A potential divergence is seen in the secondary window, as the Relative Strength Index (RSI) failed to make a new higher high following the price swing. Moreover, the RSI rebounded from the overbought 70.00 level, which could soon reach the 50.00 neutral area.
Based on the daily price outlook, a conservative bearish approach could come from a solid bearish Daily candle below the 107.18 swing low. However, an early bearish opportunity might come after a solid bearish momentum below the 109.00 level. In both cases, the primary target would be at the 104.21 level before approaching the 101.74 level.
On the bullish side, an immediate rebound and a daily candle above the 110.42 level could increase the price towards the 112.73 level, which is the 161.8% Fibonacci Extension level from the most near-term swing.
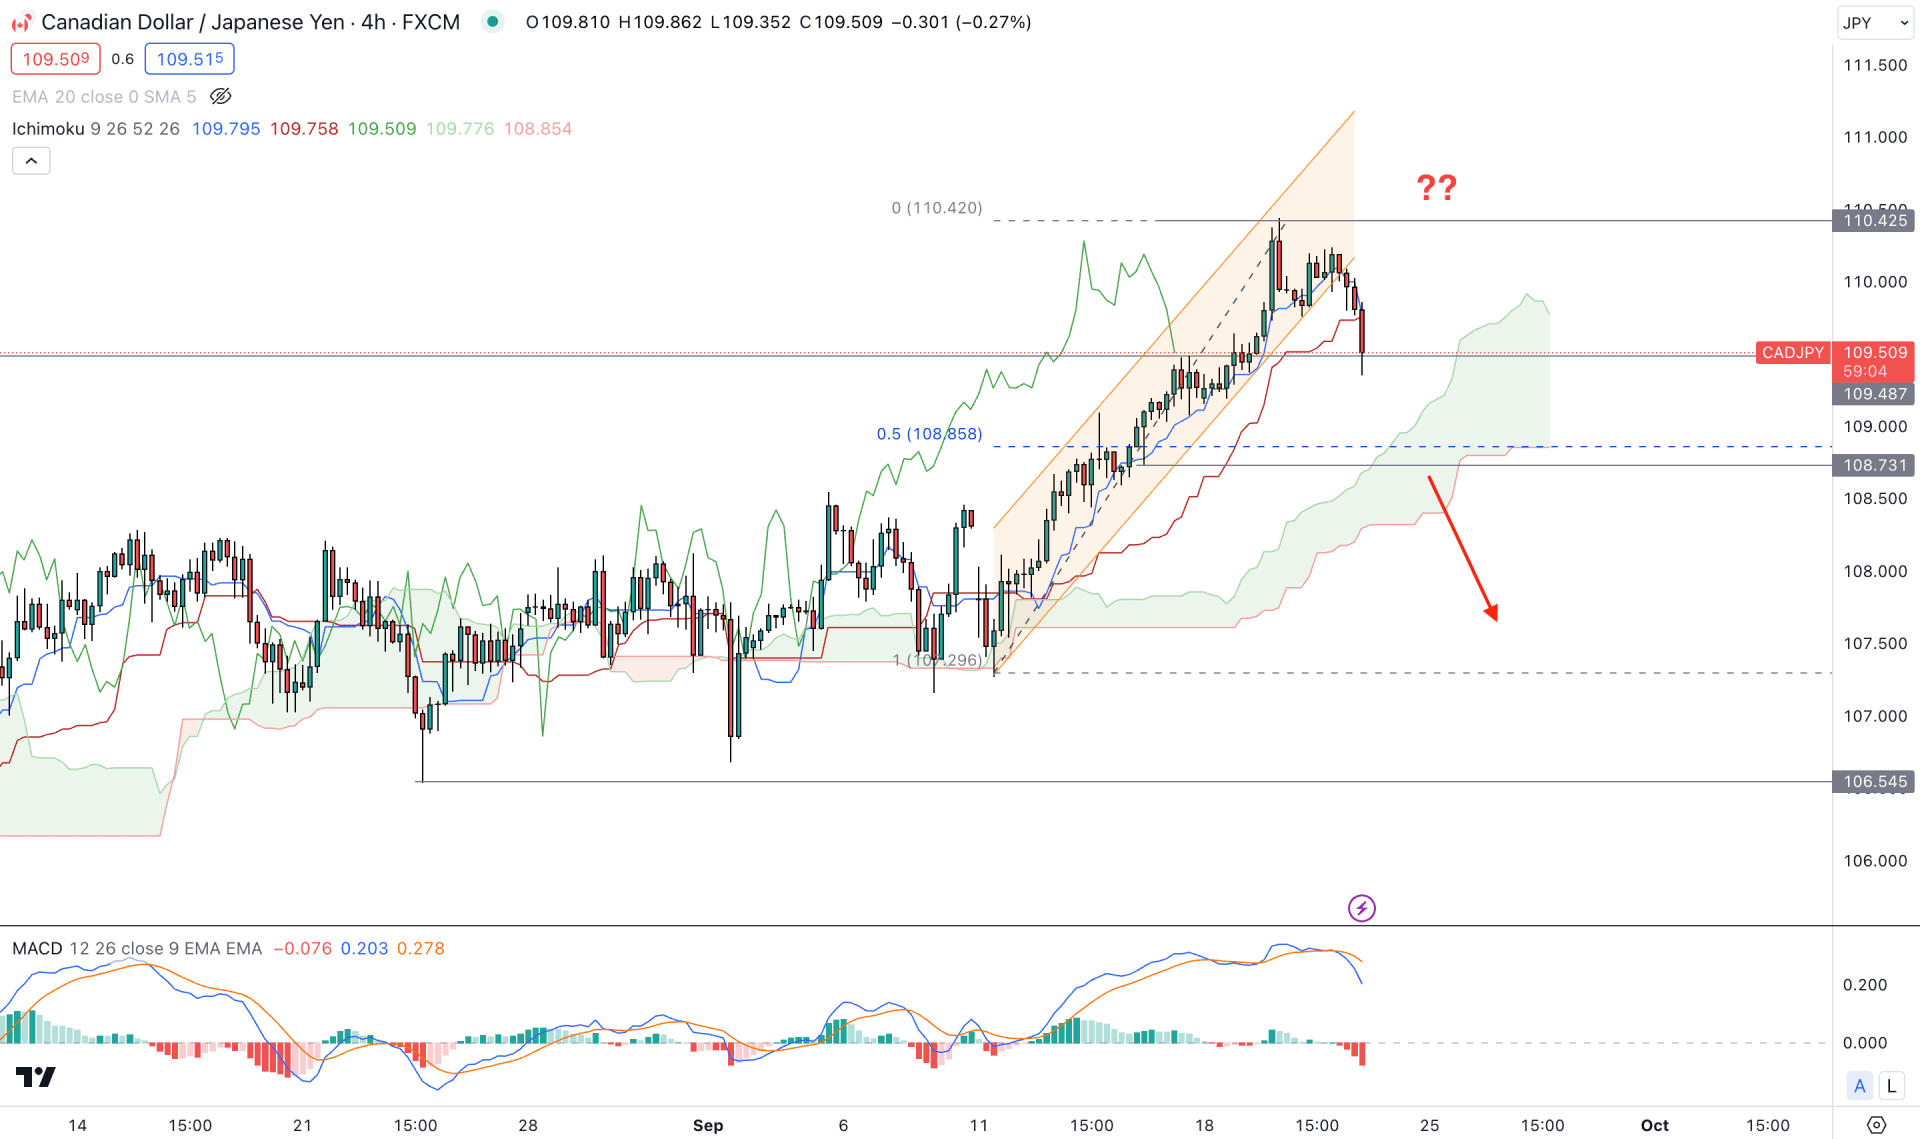
In the H4 timeframe, the current price is trading above the Ichimoku Kumo Cloud with a solid bullish breakout after a consolidation. Moreover, the future cloud shows a strong bullish possibility as the Senkou Span A is higher than B with.
In the current swing from the 107.28 low to the 110.42 high, the immediate bearish pressure came with a new low formation at the 109.33 level. Moreover, the downside pressure is supported by the violation of dynamic Tenkan Sen and Kijun Sen levels.
In the secondary window, the MACD Signal line shows a bearish crossover from the positive zone, which could signal an active downside pressure.
Based on the H4 outlook, the downside possibility is potent as long as it trades below the 110.42 level. In that case, the bearish momentum could extend towards the 108.73 level, before reaching the 106.54 level.
On the bullish side, a bullish recovery and an H4 candle above the 110.50 level could extend the upward pressure towards the 112.00 psychological level.
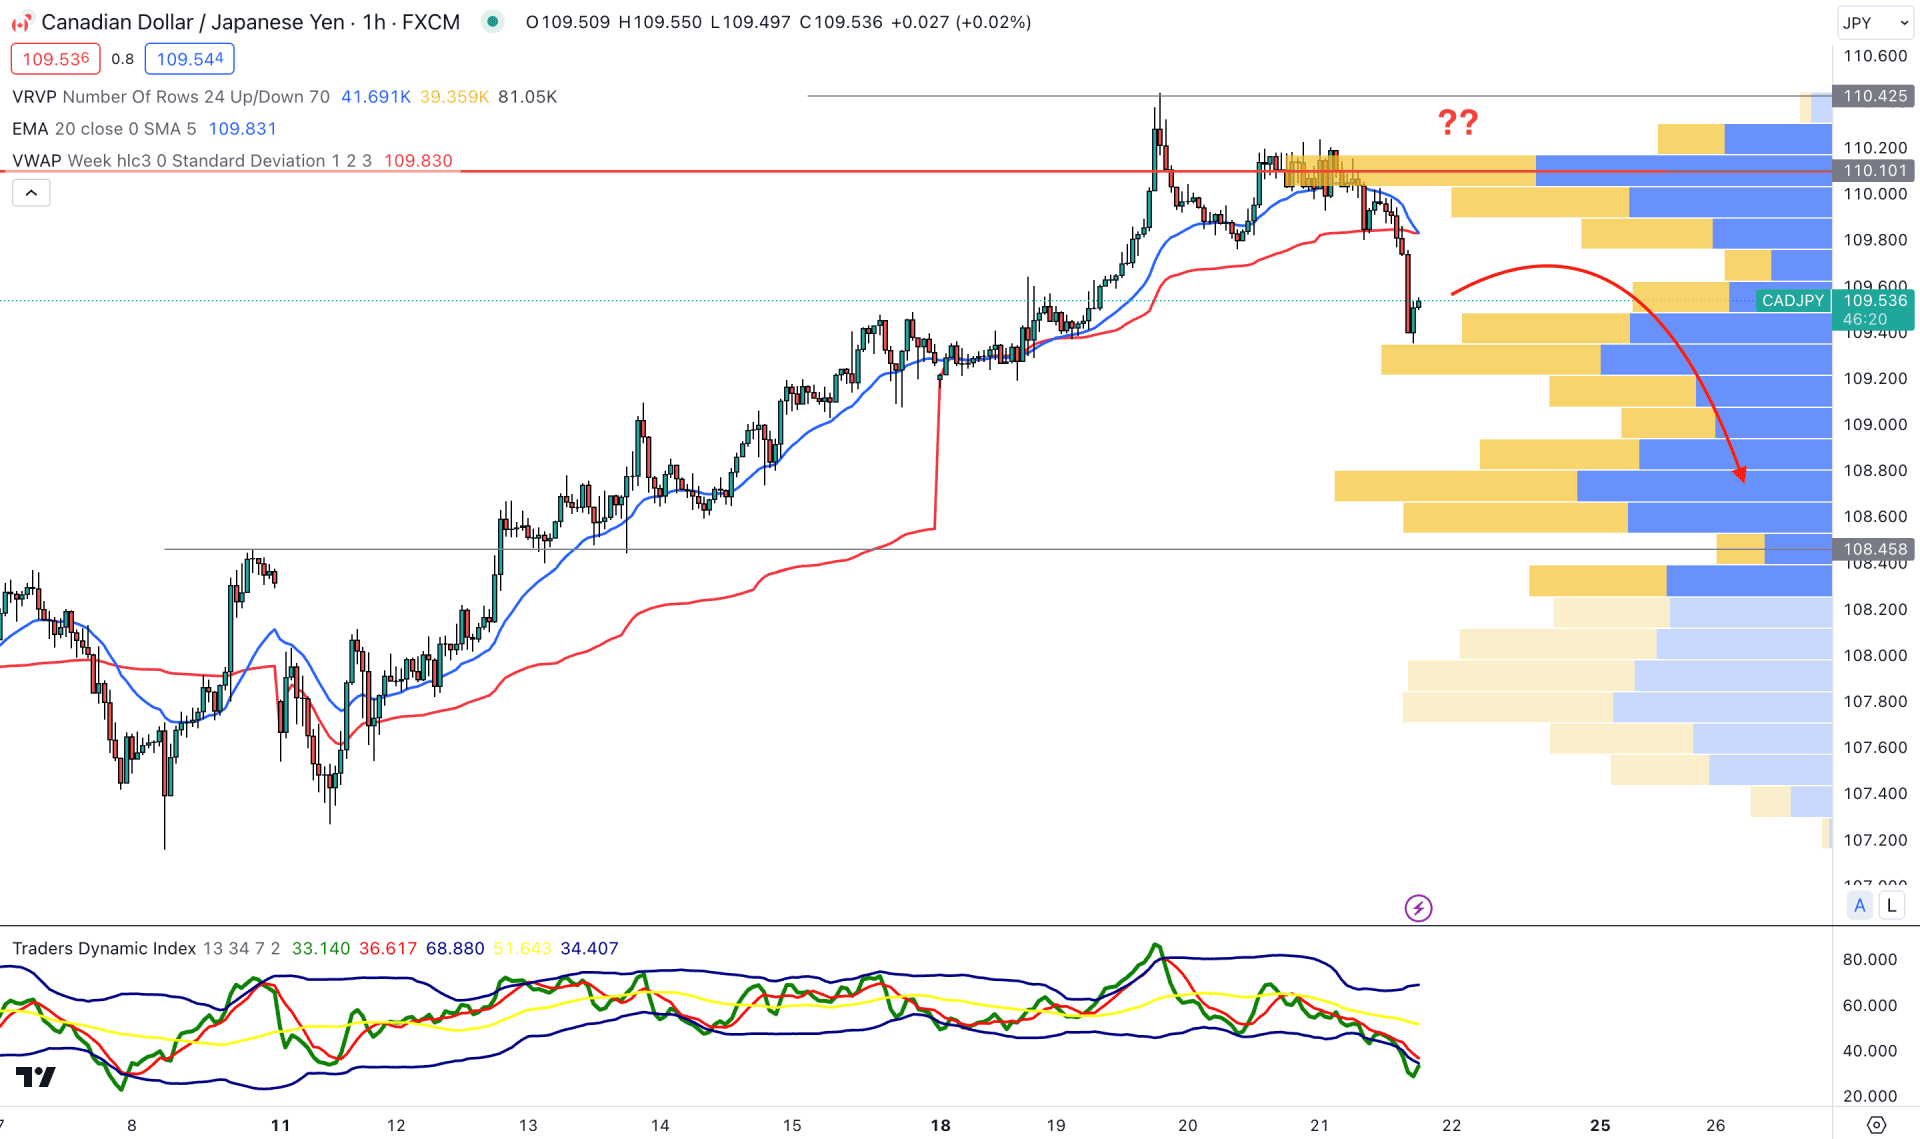
In the intraday chart, CADJPY downside momentum is active as the current price trades below the visible range high volume level. Moreover, multiple bearish H1 candles are seen below the dynamic 20 EMA level, which could signal an active bearish trend.
In the secondary window, the Traders Dynamic Index (TDI) is at an oversold zone, which signals a minor bullish recovery.
Based on this structure, the downside pressure may extend toward the 108.45 support level. However, the bearish possibility is active as long as the price trades below the 110.10 high volume level. An immediate recovery and an H1 close above the 110.20 level could increase the price towards the 112.00 level.
Based on the current market outlook, the CADJPY price is trading within a strong bullish pressure, where a solid recovery and a wedge breakout are needed to form a short opportunity. As the current price is still within the price pattern, investors should closely monitor the intraday momentum before relying on the bearish pressure.


