
Published: June 14th, 2022
According to the latest economic releases, investors have seen another stellar employment report from Canada where the employment change in May came at 39.8K, up from the 30K expectation. Moreover, the unemployment rate slipped to 5.1% and is currently at a record low area. On the other hand, the BOC has flagged higher housing prices over the past few years but stated that it is still early to consider that the housing activity has reached its peak. Considering the current economic condition, the banks showed interest in bringing back the inflation to the targeted level by raising interest rates to 2-3% over time.
In Switzerland, the SNB published the foreign exchange reserve for the month of May at 912.4bn CHF, down from 926.1bn CHF. Moreover, the seasonally adjusted unemployment rate came at 2.2% for April, unchanged from the last two months. This week, investors will see the SNB meeting, where the current possibility is a rate hike of around 70%.
Let’s see the future price direction from the CADCHF technical analysis
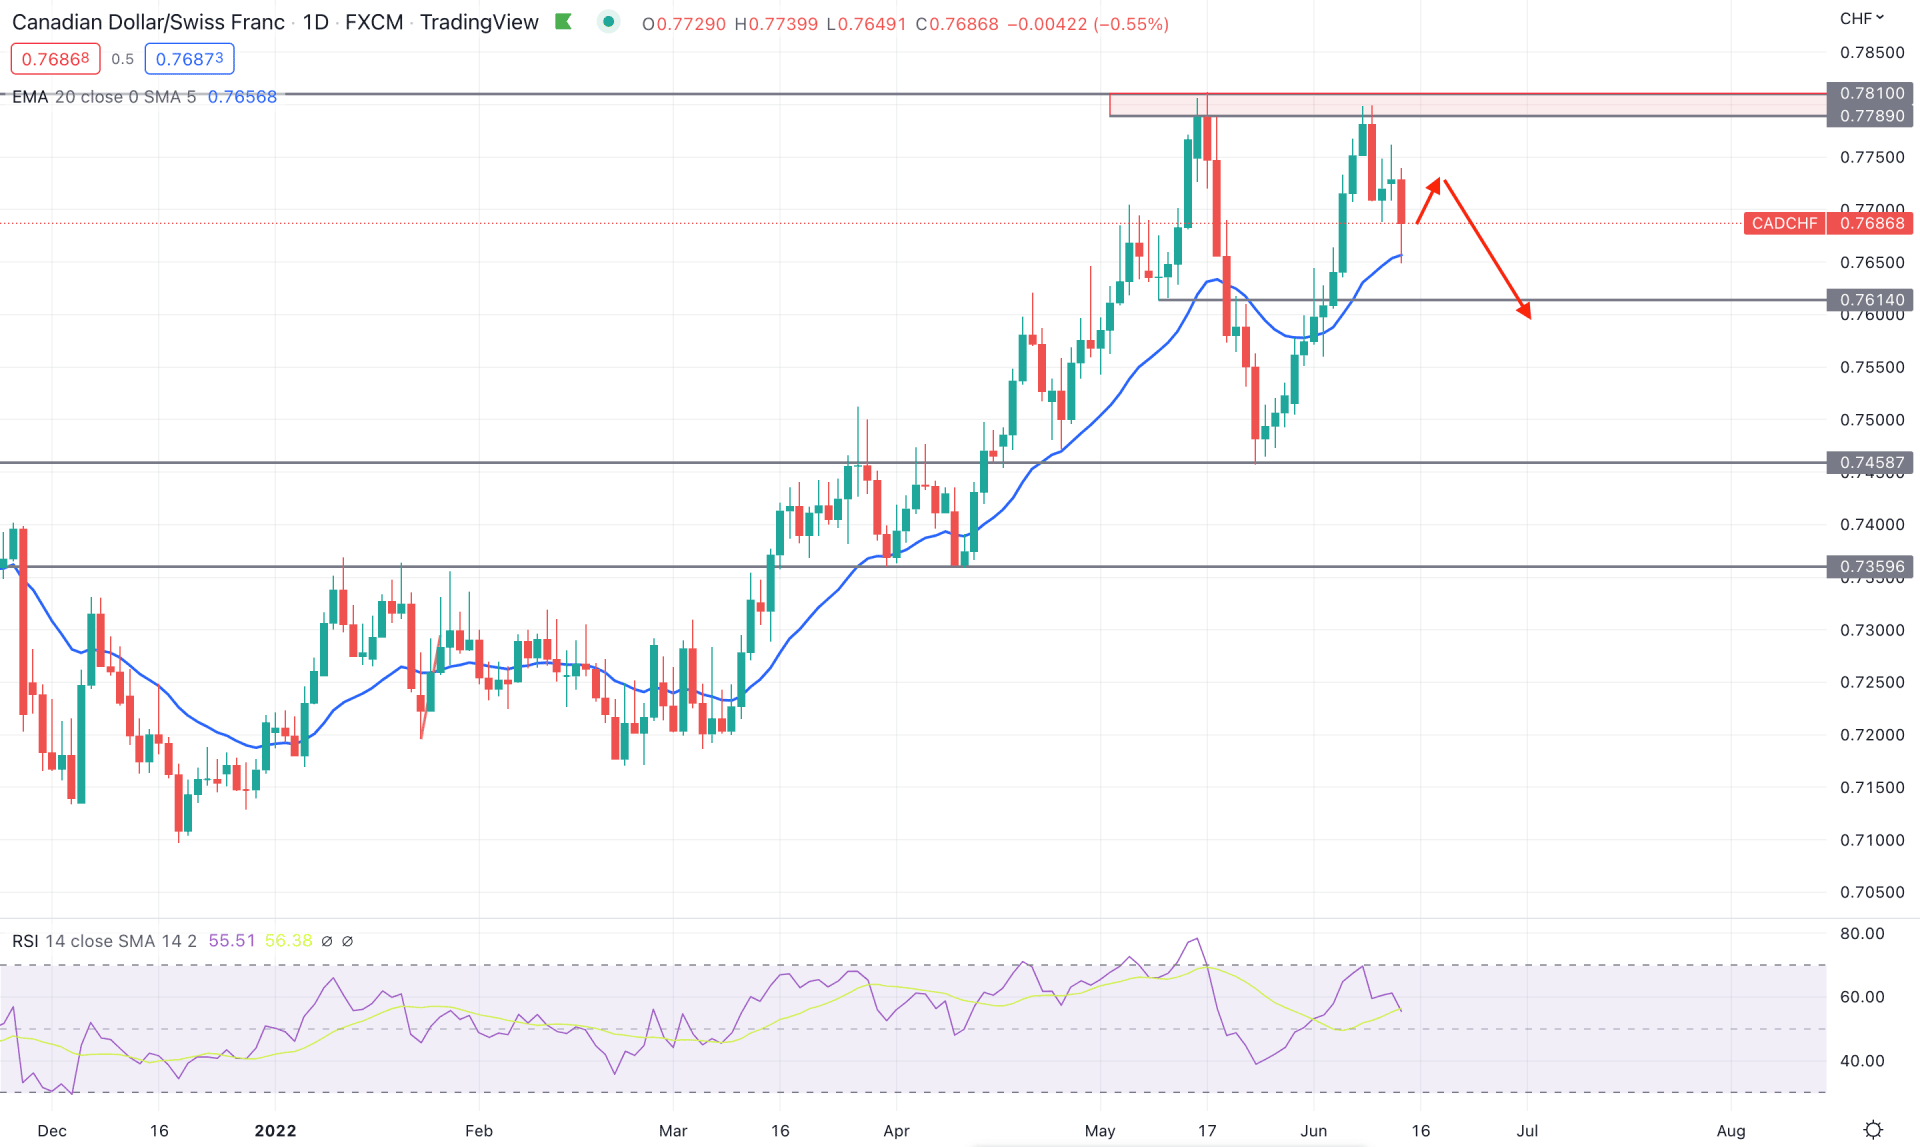
In the CADCHF daily chart, the price showed a steady bullish pressure from the beginning of 2022 that found temporary relief from the 0.7800 key resistance level from a significant selling pressure of 350 pips appeared. However, the counter-impulsive momentum on the bearish side is the primary indication of a trend reversal that may extend its pressure after a considerable correction.
The current bearish opportunity has become potent as the price returned to the key supply zone but failed to hold the momentum again. As a result, a bearish break of the structure appeared in the daily chart below the 0.7689 level, opening room for more downside momentum in the coming days.
The daily chart shows how the price reached the immediate support at the dynamic 20 EMA while the Relative Strength Index failed to extend the bullish momentum above the 70 level. Therefore, as the current price is still above the dynamic 20 EMA, investors should closely monitor the intraday chart to find a suitable trading opportunity.
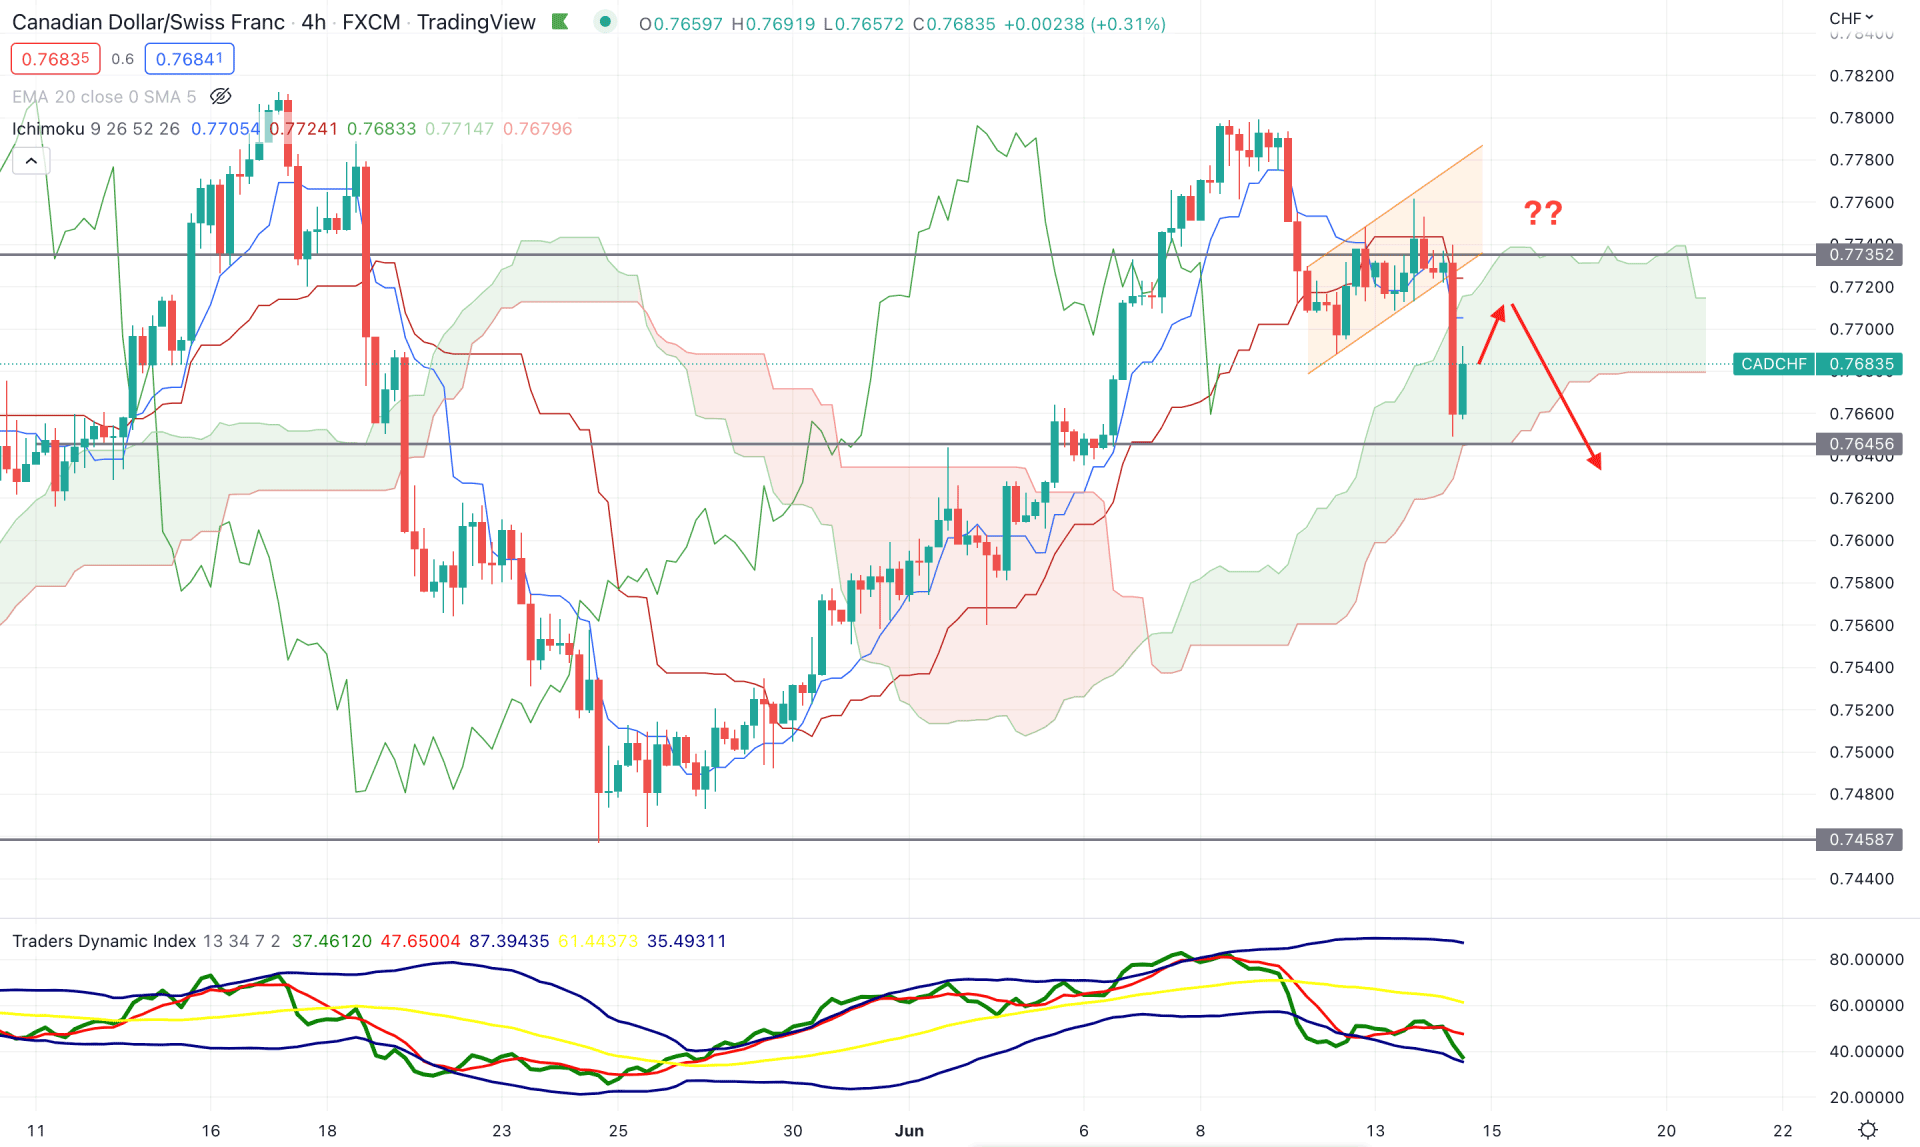
According to the Ichimoku Cloud, the current market, the recent bullish pressure above the Kumo Cloud by 175 pips without any considerable correction. As a result, the extensive buying pressure above the cloud with no correction has become the primary indication of a trend reversal. Moreover, the price moved lower within the Kumo Cloud, followed by an ascending channel breakout. The Senkou Span A and Senkou Span B remained sidelined in the future cloud, indicating a corrective market momentum.
The above image shows how sellers’ momentum found a bottom from the Traders’ Dynamic Index. The current TDI line reached the lower band, followed by a strong selling momentum that may signify a bullish correction. On the other hand, there is a bearish crossover between dynamic Tenkan Sen and Kijun Sen, where the Kijun sen is working as an immediate resistance level.
Based on the H4 context, investors should wait for the bullish correction to complete where any bearish rejection from the dynamic Kijun Sen of static 0.7730 level would be a bearish opportunity. The primary target of the selling pressure will be towards the 0.7480 to 0.7460 area from where a bullish correction may appear.
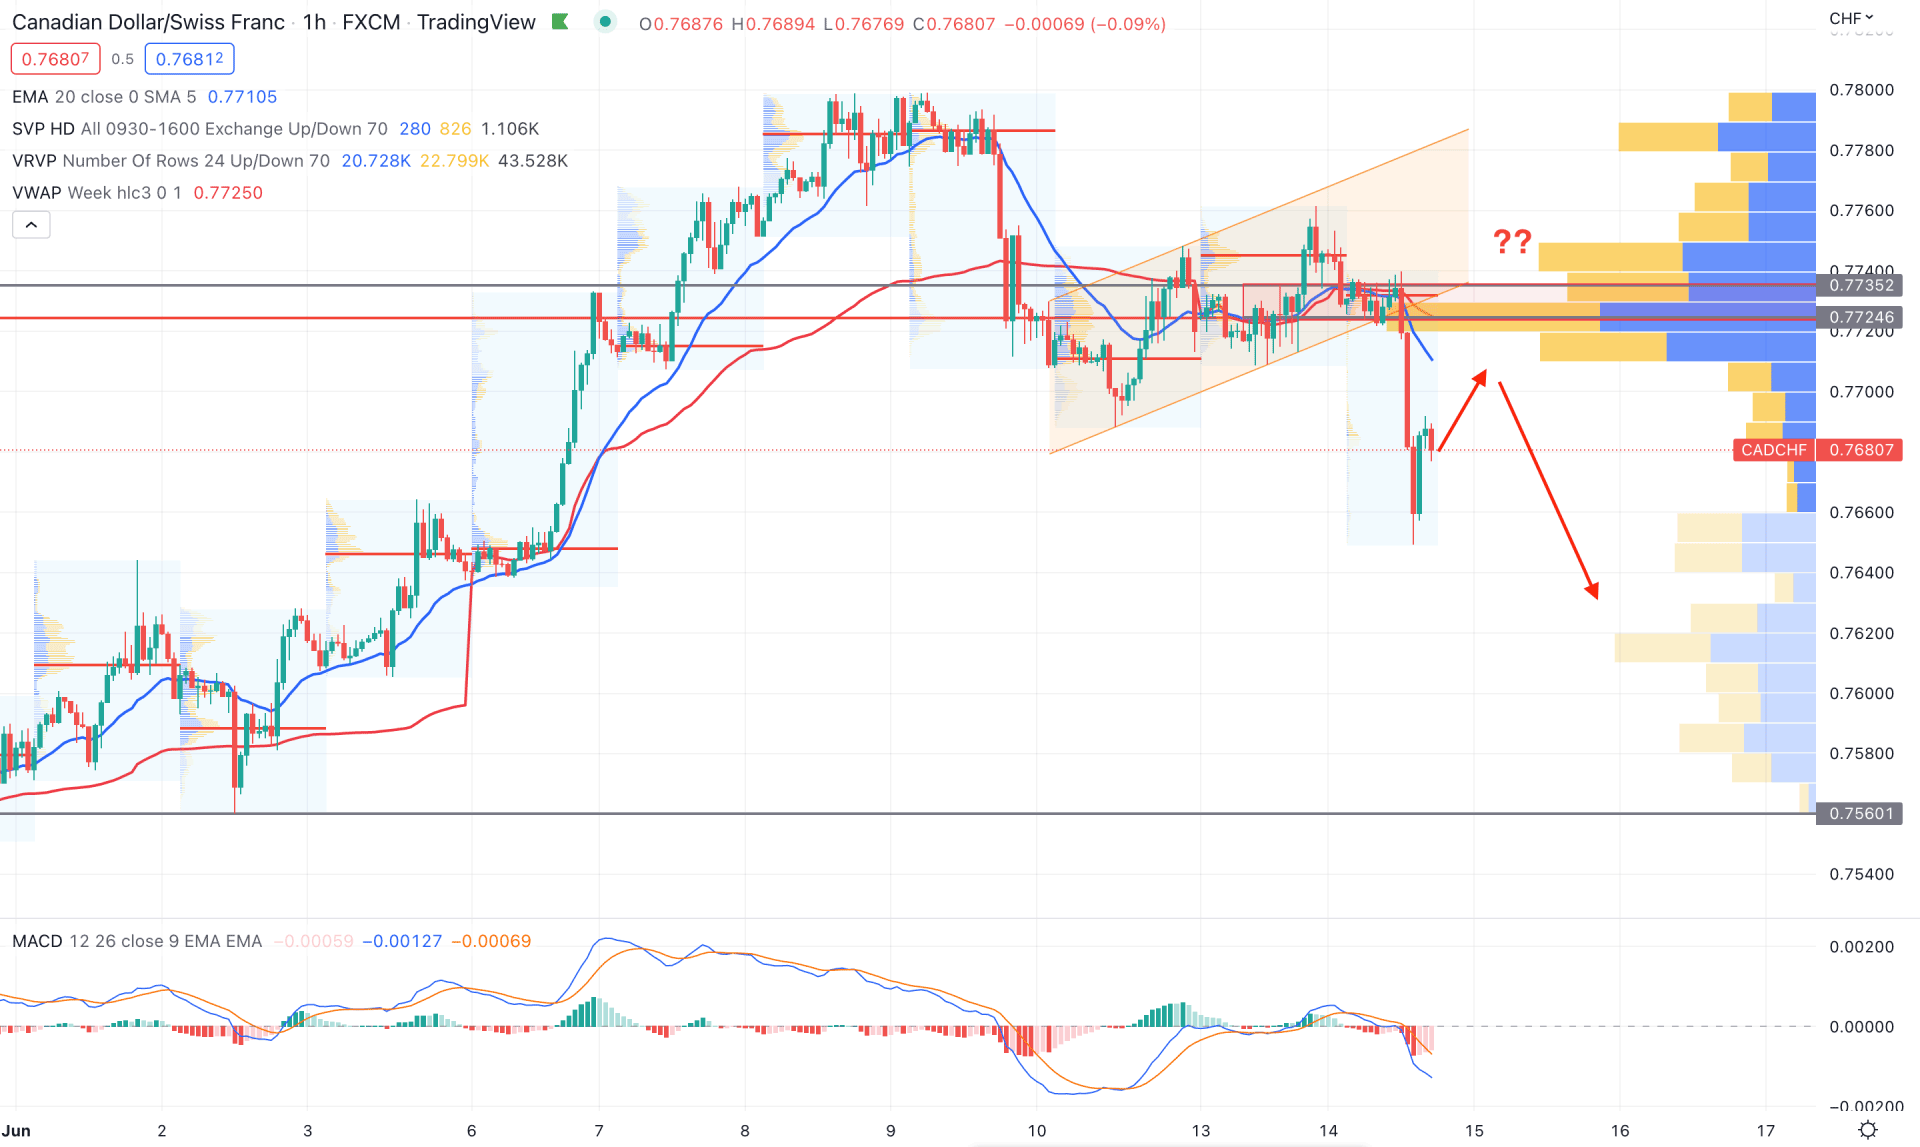
In the intraday chart, CADCHF is trading within a strong bearish trend where the current volume structure also supports bears. According to the current volume from the visible range, the highest investor activity is at the 0.7724 level, from where the latest channel breakout appeared. Moreover, the intraday high volume level is also above the current price, indicating an intense bearish pressure in the coming hours.
The above image shows how the MACD Histogram changed its direction to the sellers’ side while dynamic 20 EMA and weekly VWAP remained above the current price. In that case, as long as the price remains below the weekly VWAP level, we can expect the selling pressure to extend in the coming days.
The primary trading approach is to wait for the bullish correction to over and find sellers' presence from a dynamic level. The primary target of the bearish trend is towards the 0.7560 static support level from where a bullish correction may appear.
As per the current market context, CADCHF's bearish possibility is potent as the current intraday price trades below the channel breakout with support from volume. In that case, the best trading approach is to wait for a minor correction to over and open sell trades after finding a suitable candlestick formation.


