
Published: April 5th, 2023
The annual inflation rate in Switzerland dipped to 2.9% in March from 3.4% in February, which increased the buying pressure on CHF against a basket of currencies.
Moreover, the Swiss National Bank (SNB) has aggressively pursued rate policies to restrain inflation. They also increased the cash rate to 1.5%, the fourth straight increase.
Nonetheless, the recent decline in inflation may complicate future rate hike decisions, with policymakers considering a 25-basis point hike or a pause in rates. There are signs of economic weakness, such as flat GDP in the fourth quarter and a decline in the KOF Economic Barometer, which increased the possibility of a weaker economy.
Switzerland's manufacturing PMI decreased to 47.0 in March, down from 48.9 in February. Weak manufacturing remains a global concern. As a result of the Russian invasion of Ukraine and China's zero-Covid policy, which have disrupted supply chains and reduced demand, it is anticipated that the US ISM Manufacturing PMI would decline in March to 47.5, from 47.7 in February.
The Canadian economy saw no growth in the fourth quarter of 2022, indicating that the Bank of Canada's rate hikes had hindered economic activity. Even though Canada added 150,000 new jobs in January, the Bank of Canada remains concerned about the impact of the recent banking crisis on the global banking system.
At its upcoming meeting, the Bank of Canada (BoC) is anticipated to pause to examine global financial concerns, a stable job market, and steady wage growth.
Let’s see the upcoming price direction of CADCHF from the multi-timeframe technical analysis:
In the higher timeframe price action, the broader outlook of the CADCHF is bearish. The bearish monthly candle in February is showing a strong downside possibility in this month. Also, the recent weekly charts are signaling a bullish correction, followed by an impulsive bearish trend.
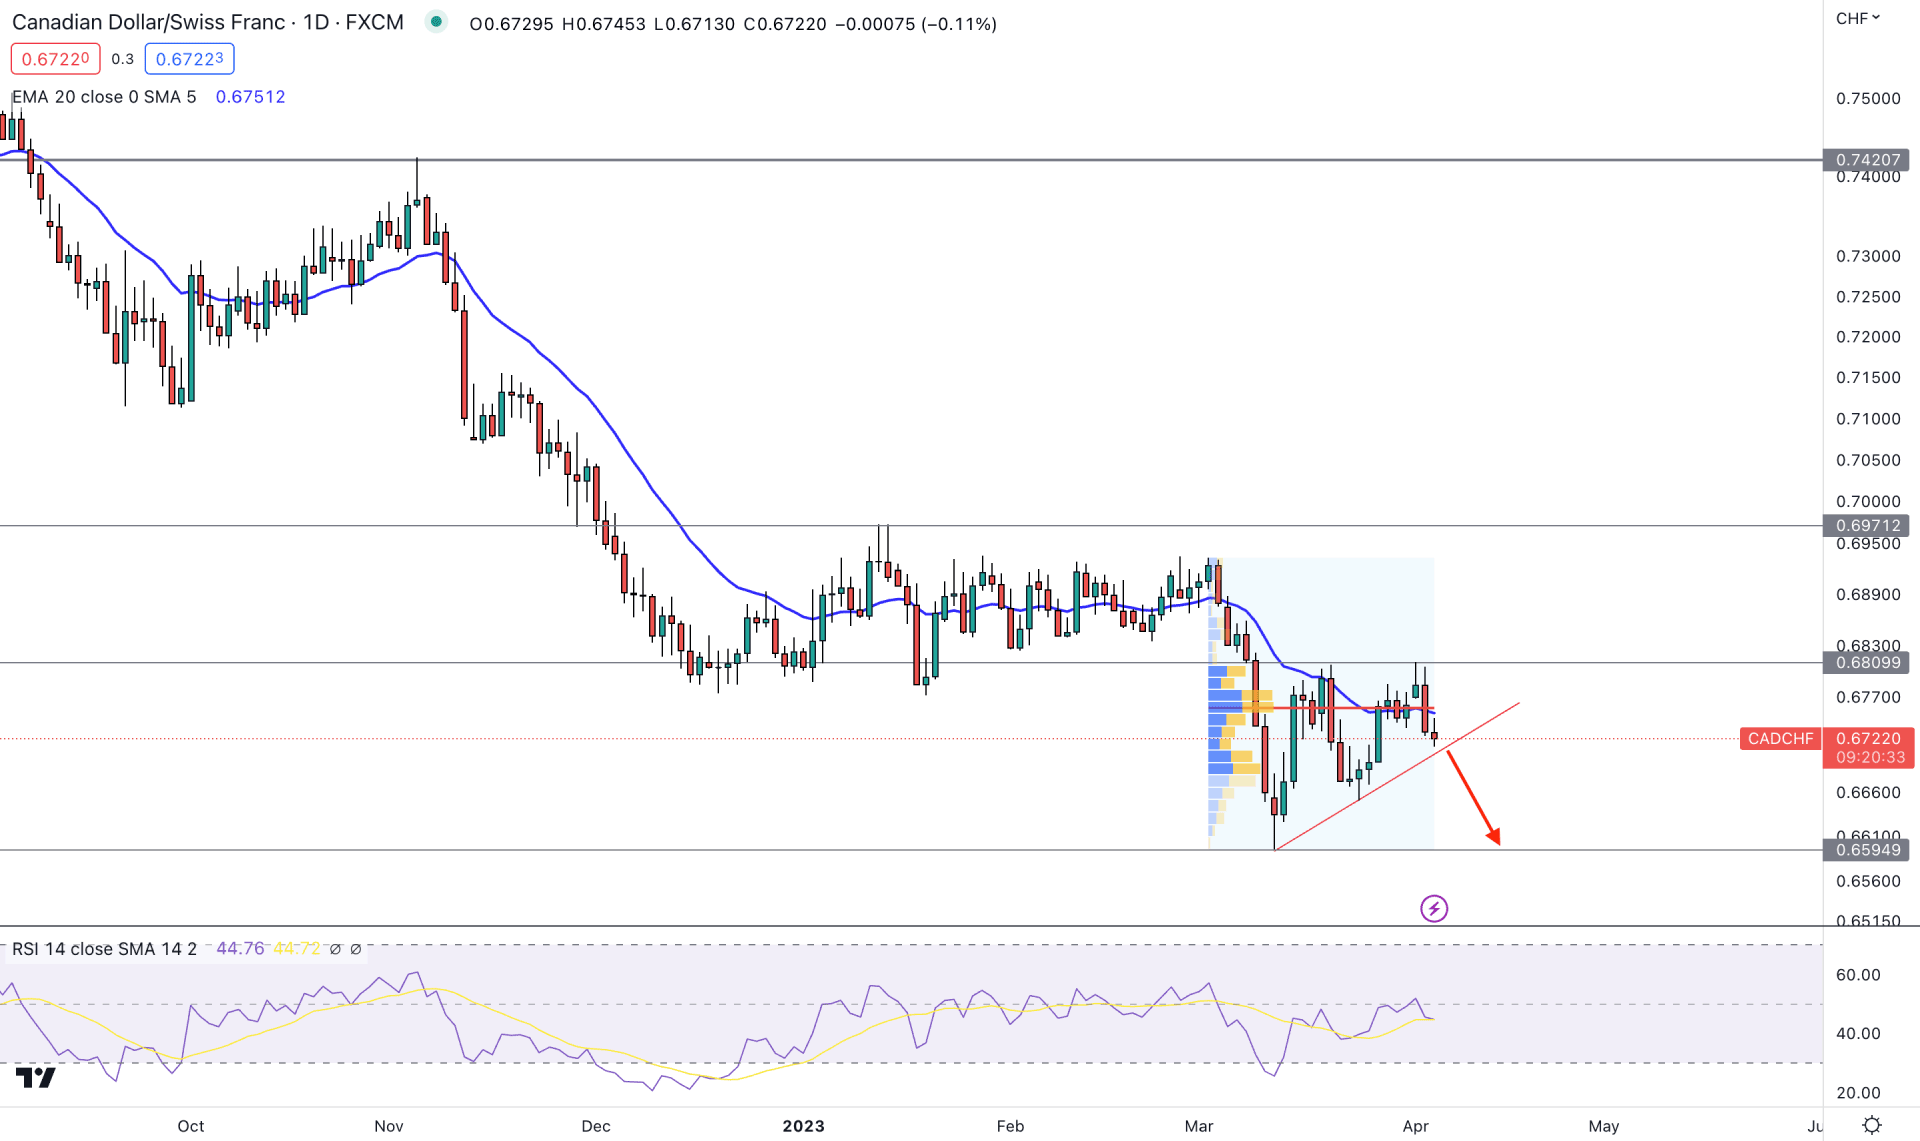
In the daily price, the current bullish correction is clear as the price is squeezing to a near-term resistance level. If we draw a trendline at the bottom, it would appear as an ascending triangle pattern. As the broader outlook of the market is bearish, any downside pressure below the trendline support could work as a sell signal.
The highest trading volume level from March 2023 high to the April low is the market at 0.6756, which is just above the current price. As bears are holding the price with a greater volume, we may expect the downside pressure to extend in the coming days.
The dynamic 20-day Exponential Moving Average in the main chart is the immediate resistance from where a bearish daily candle appeared. Also, the static 0.6809 level would be the second resistance level, which might work as a barrier to bulls.
The downside momentum is visible from the indicator window where the current Relative Strength Index (RSI) shows a bearish pressure from the neutral 50.00 line.
Based on the current price structure, investors may experience downside pressure in the CADCHF price as the broader outlook is bearish. A new daily candle formation below the triangle trendline support could validate the short opportunity targeting the 0.6594 level.
On the other hand, a proper breakout with a daily candle close above 0.6809 is needed before aiming for the 0.6971 resistance level.
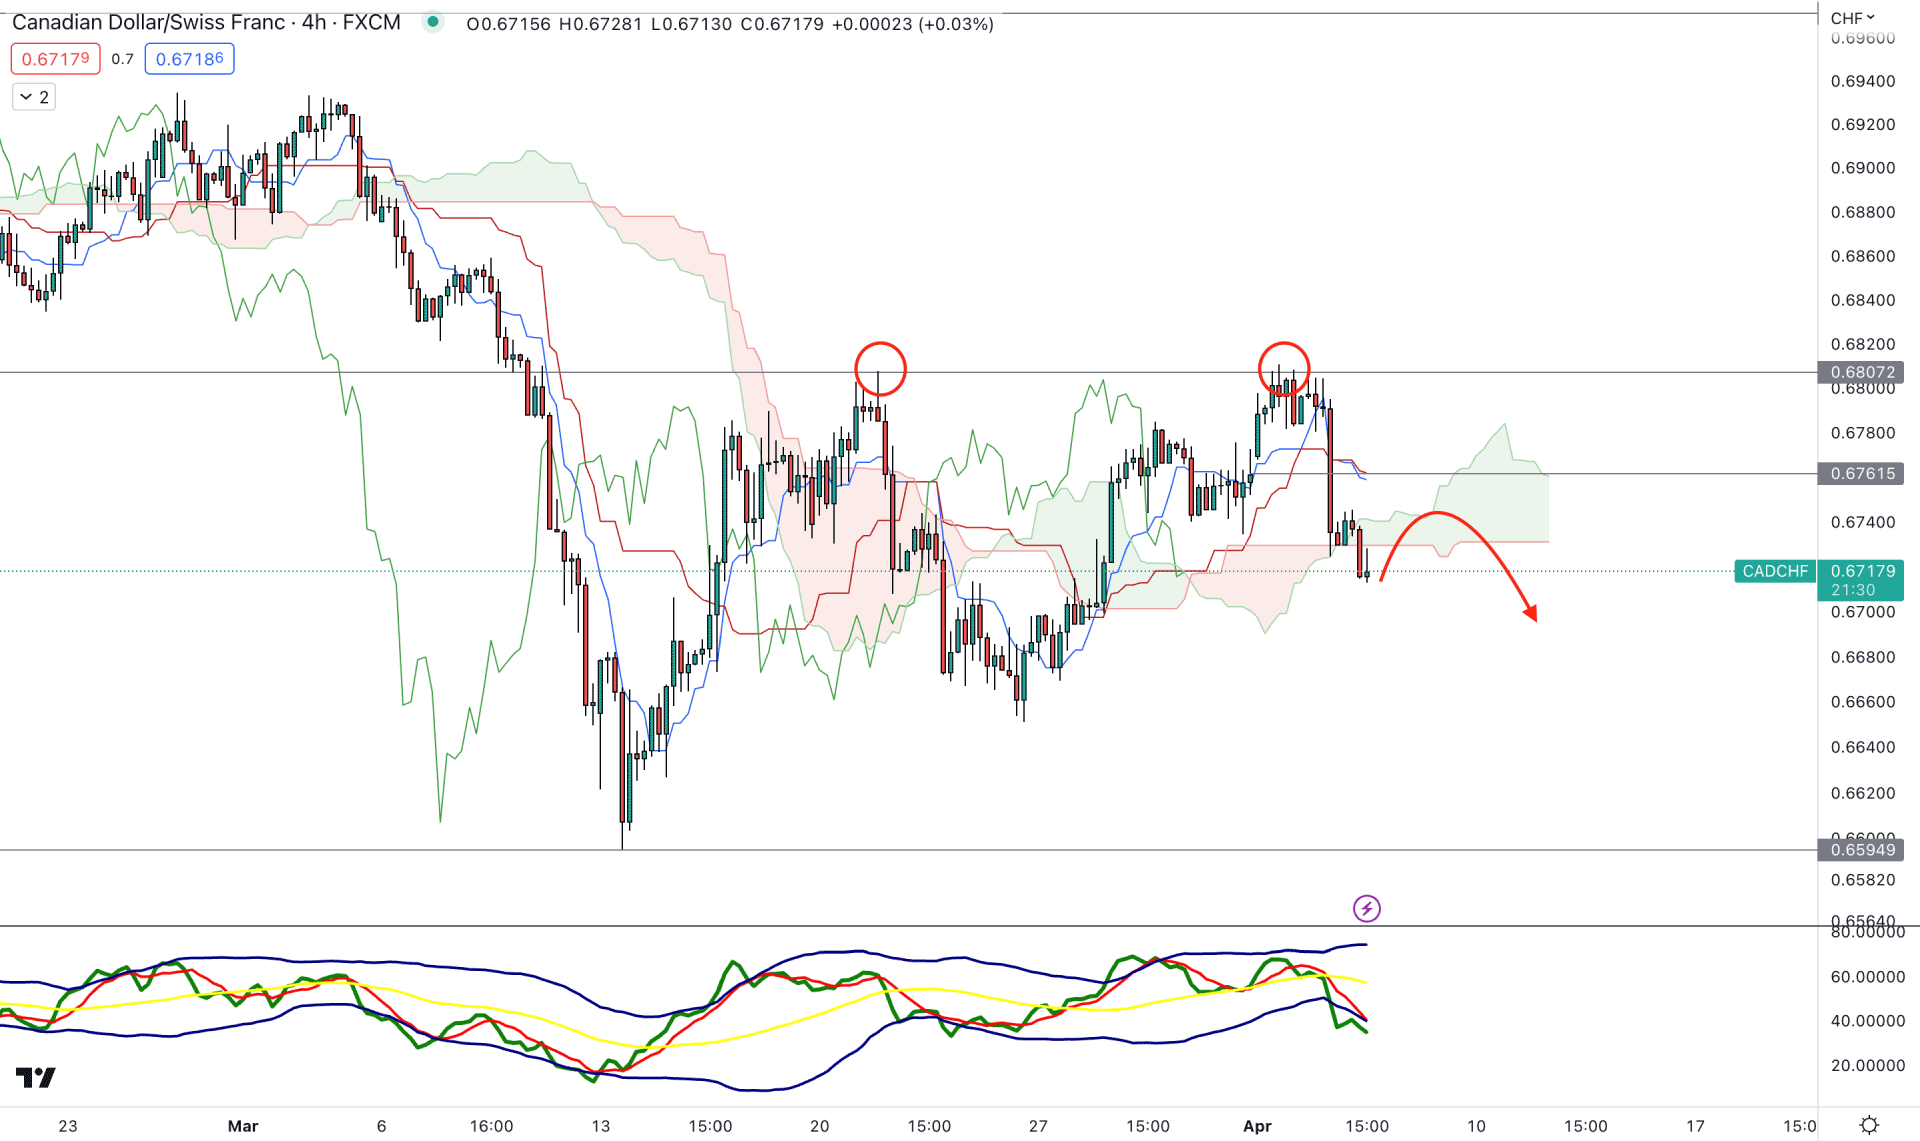
According to the Ichimoku Cloud analysis, the current H4 chart of CADCHF is trading within an indecisive momentum.
Strong downside pressure came from the beginning of March, which completed the bullish correction on 21 March. Later on, the range bound price action came, but the downside possibility is potent from the potential double top formation.
In the future cloud, the bearish possibility is questionable as the Senkou Span A is above B.
Based on this structure, a minor upside correction toward the 0.6761 level is possible. However, an immediate bearish recovery with an H4 rejection from the dynamic 20 EMA could lower the price toward the 0.6640 area.
On the other hand, a stable bullish break above the 0.6800 level is needed before aiming for the 0.6900 level.
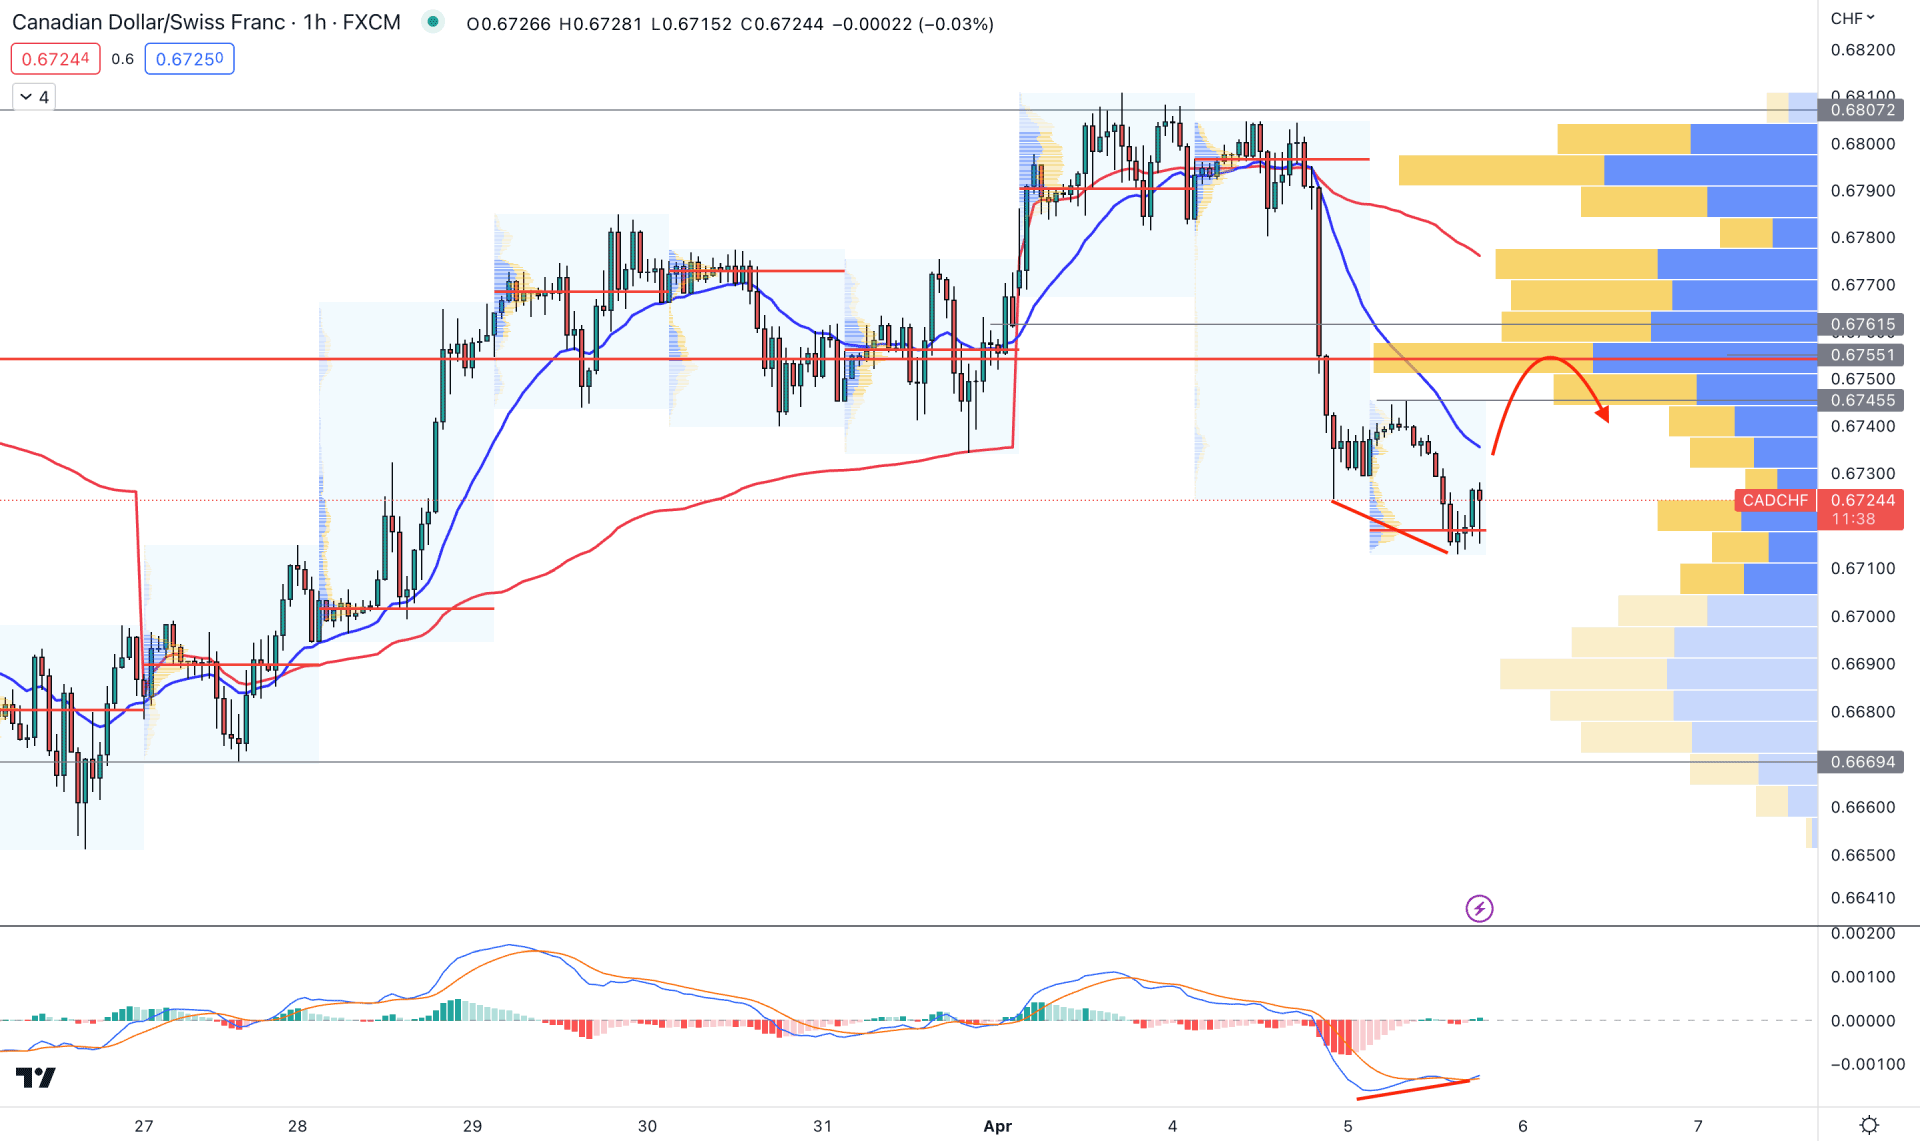
In the hourly chart, the current price is trading down below the visible range high volume level. It is a primary sign that bears are more active in the market than bulls and can lower the price at any time.
In the most recent chart, a minor bullish correction is visible with a divergence with MACD, signifying that short-term bulls are active in the market.
The MACD Histogram is extremely corrective, which is an indication of a possible breakout.
Investors might expect a minor bullish correction in the CADCHF H1 chart based on this price behavior. Therefore, any bearish rejection from the high volume level with a candle close below the 20 EMA could validate the bearish opportunity targeting the 0.6669 level.
Based on the current price behavior, CADCHF will likely decrease in the coming days. Therefore, any short opportunity could work well but a close attention to the near-term price level is needed to find the high probable short opportunity.


