
Published: August 2nd, 2022
In a recent report, The Canadian economy showed a flat movement in quarterly growth where the May GDP came in flat, down from April’s 0.3% movement m/m. An upside pressure came from warehousing sectors while the manufacturing side reported a contraction.
However, investors are keen to see the CAD employment report, which is expected to be released on Friday. The current expectation of employment is 14.2K, up from last month's -43.2K. Moreover, the unemployment rate is expected to rise from 4.9% to 5.0%, where a better-than-expected result would make CAD stronger than CHF.
The SNB total sight deposit for the week ending 25 July came at 746.60 billion CHF, down from 745.40 billion CHF in the previous week. Moreover, the SNB feels comfortable with the current CHF valuation, where this week’s CPI report will provide a hint about the economy. As per the current projection, the CPI may move lower from 0.5% to -0.1%, indicating a bullish pressure for the CHF.
Can CADCHF move higher from the current price? Let’s see the future price direction from CADCHF Technical analysis.
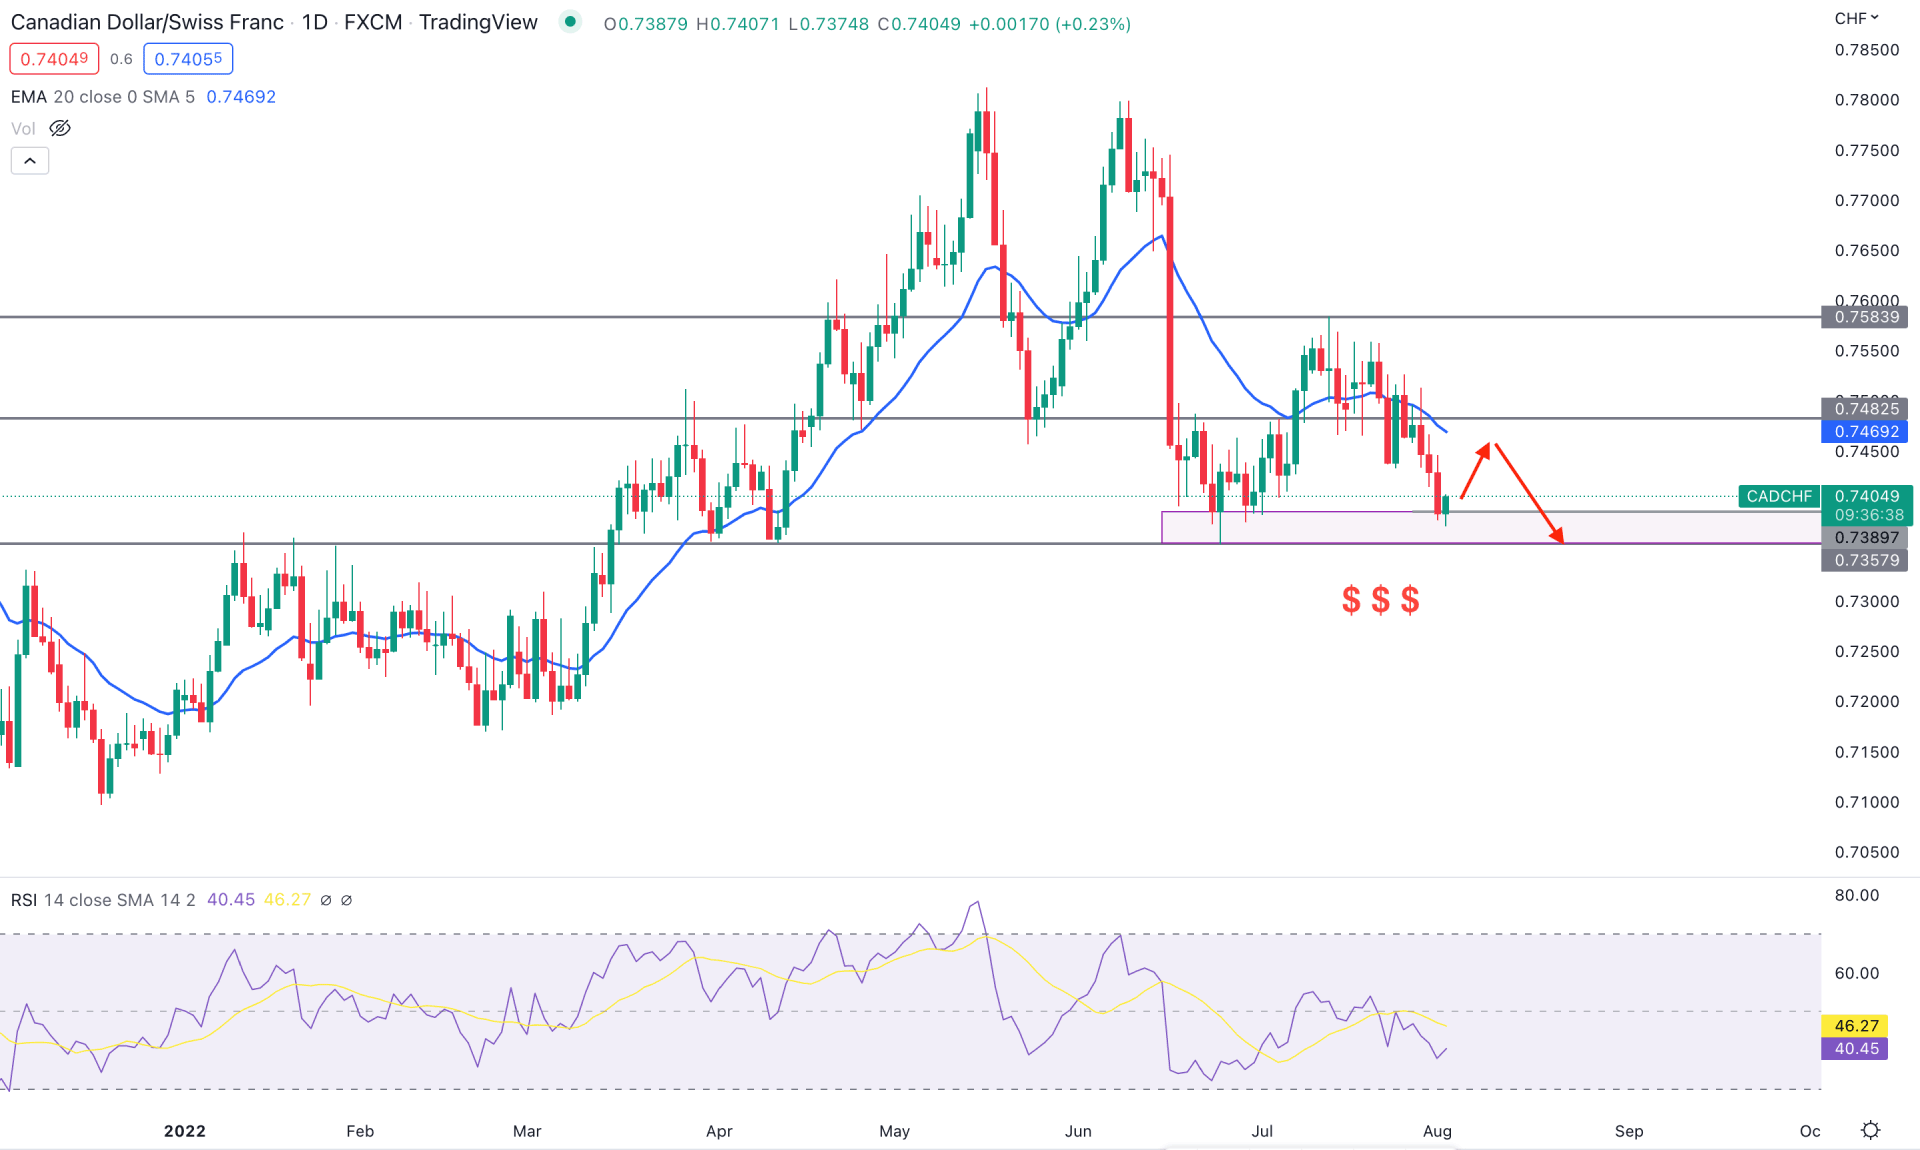
The current CADCHF selling pressure came from the potential double top formation from the 0.7810 key resistance zone, as shown in the previous CADCHF analysis. However, the latest price action has become choppy after testing the 0.7357 key support level.
The support level of 0.7357 worked as important support and resistance throughout the year, but since the bullish break from March 2022, the price has been in buyers’ control. However, the bulls tried to take the price up from the 0.7389 to 0.7357 key demand zone when no significant bullish pressure was seen. The price increased with corrective pressure and formed a ceiling at the 0.7583 level, before moving below the 20-day moving average.
The indicator window shows the Relative Strength Index (RSI) shows how it moves below the 50% neutral zone with a possibility of testing the overbought 30 areas. On the other hand, the dynamic 20-day moving average is above the current price, indicating a mean reversion.
Based on the daily price action, a bullish daily candle from the current demand zone could increase the buying pressure towards the 0.7583 resistance level. On the other hand, a bearish daily candle below the 0.7357 historic level could resume the existing selling pressure towards the 0.7200 support zone.
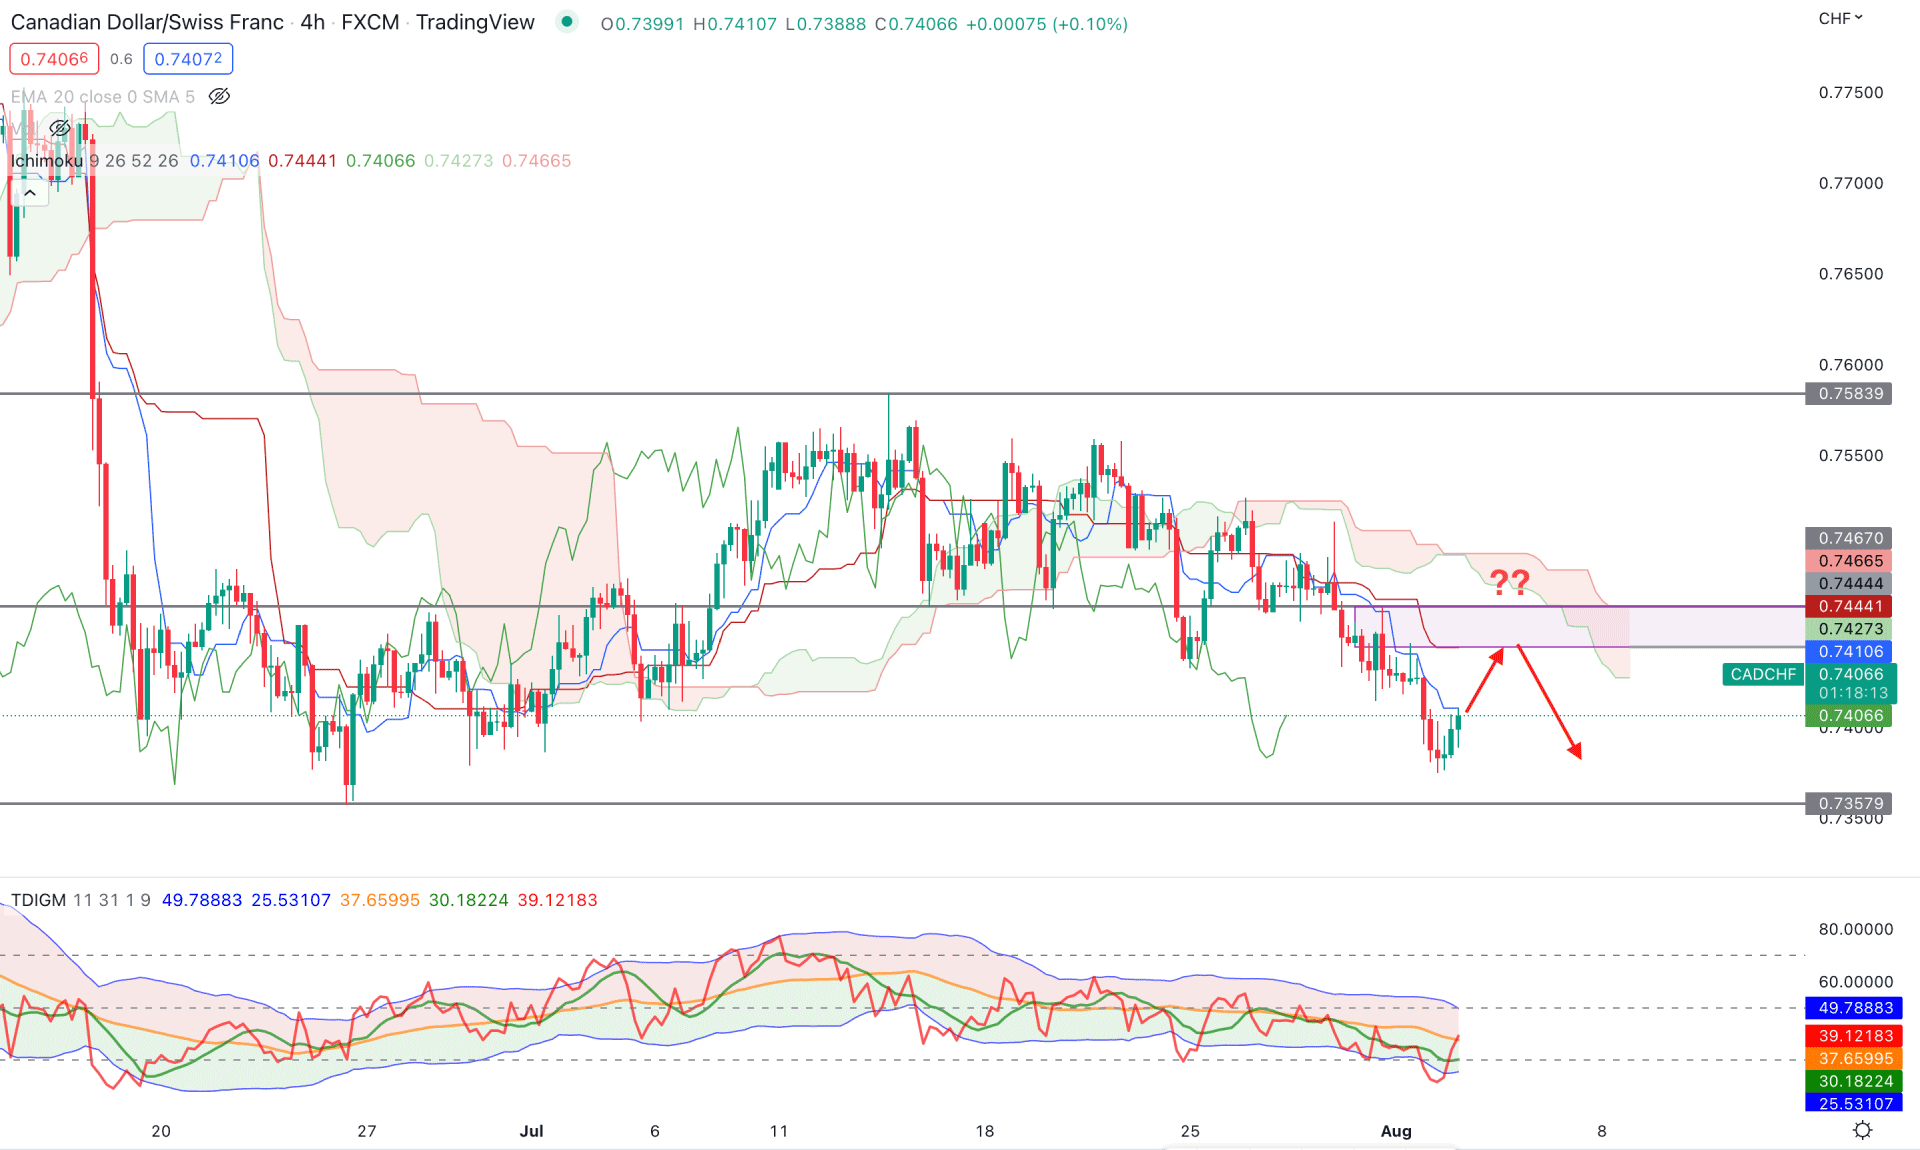
In the H4 timeframe, the market trend is still bearish as the current price is below the Kumo Cloud while the dynamic Kijun Sen is above the price. In the future cloud, the Senkou Span A and Senkou Span B represent sellers' presence in the market where any bearish rejection candlestick from the Kijun Sen level could resume the bearish trend.
The indicator window represents a neutral pressure from bulls and bearish as the current TDI line is heading to the 50% level, after testing the overbought area. The Kijun Sen is working as an immediate resistance where the comfortable selling is at 0.7467 to 0.7410 area. On the other hand, a bullish breakout above the 0.7467 level with a strong H4 candle could eliminate the current bearish possibility and possibly test the 0.7583 resistance level.
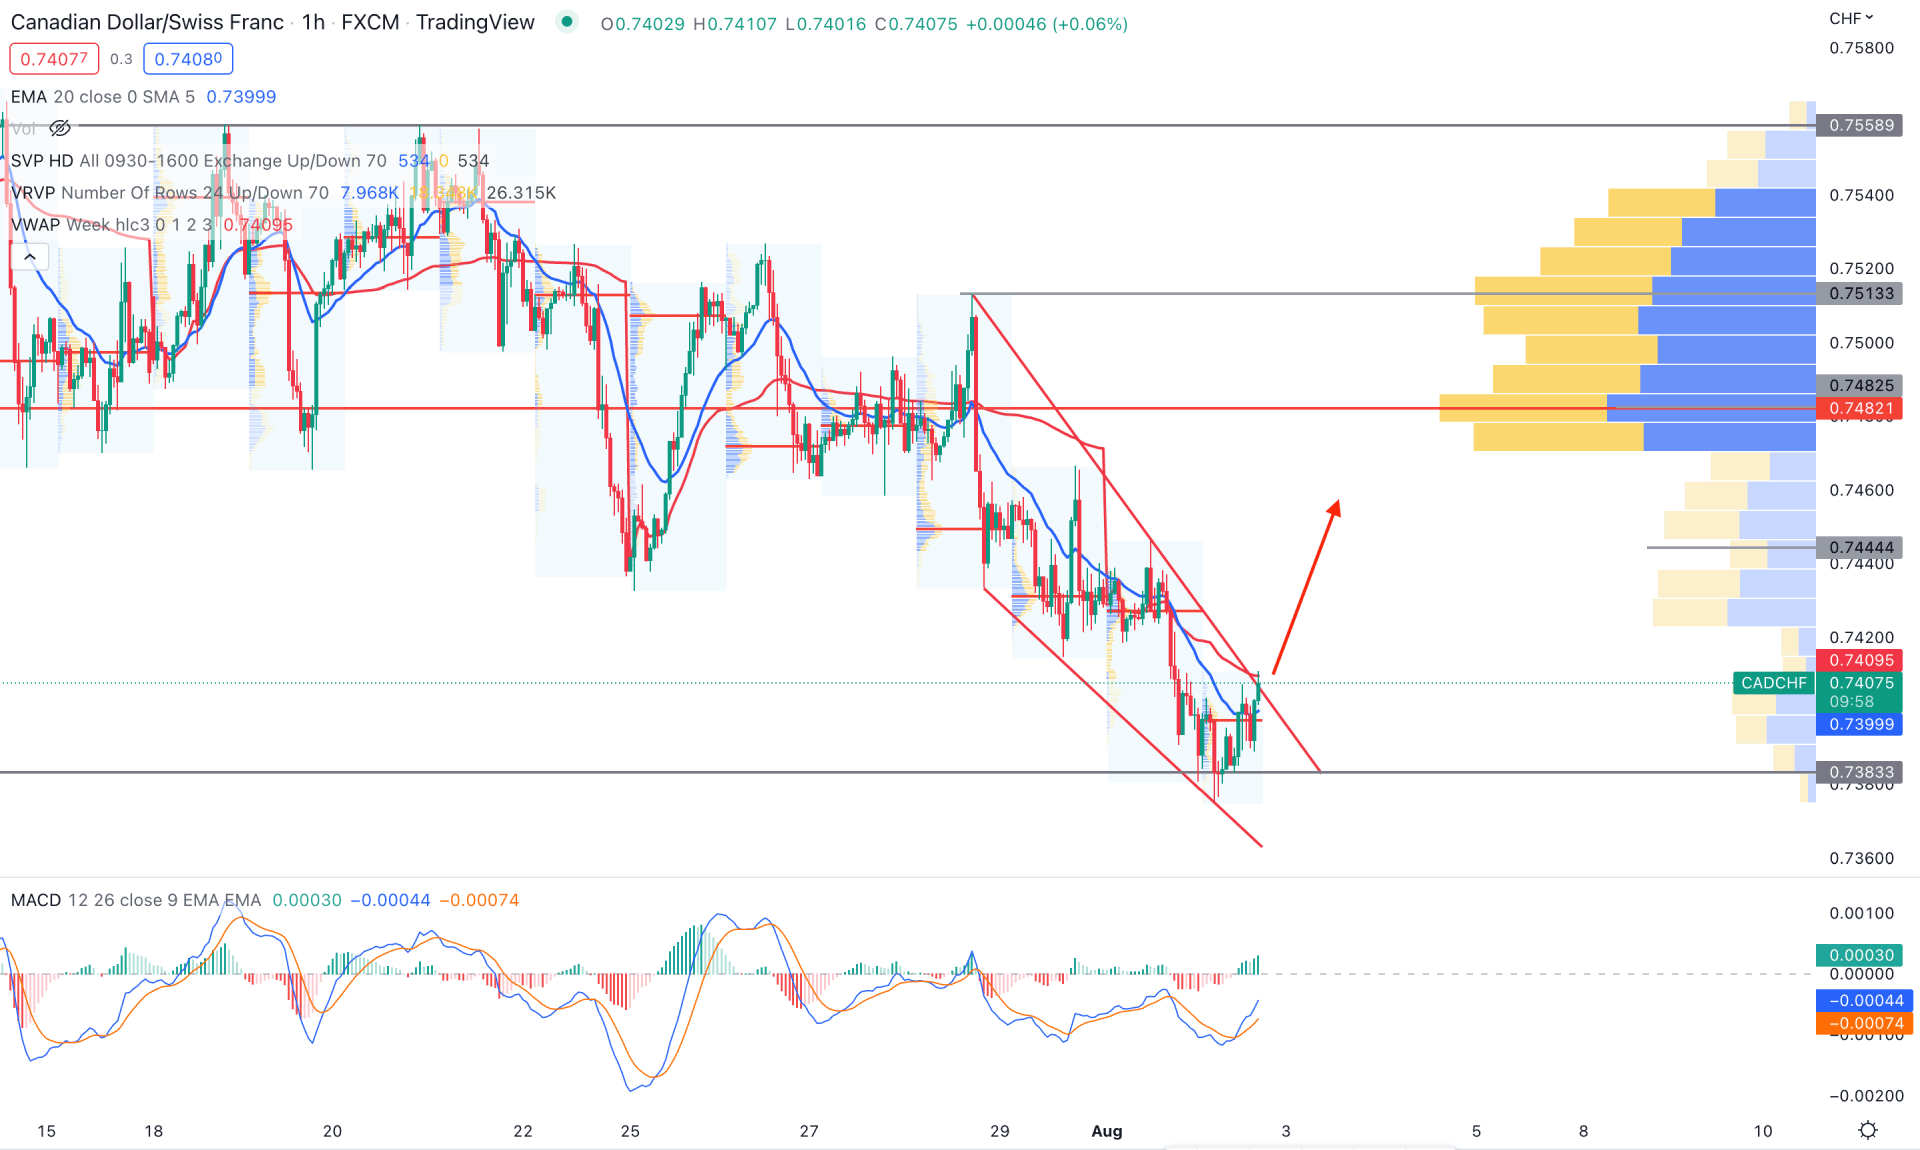
The intraday buying pressure is solid from the CADCHF H1 chart, where the price trades at the falling wedge resistance level. Moreover, based on the volume analysis, the biggest trading volume level from the visible range is higher than the current price at 0.7482. In that case, a solid bullish H1 candle above the dynamic 20 EMA resistance level could extend the buying momentum towards the 0.7482 high volume level. On the other hand, the intraday high volume level is below the price, providing strength to bulls.
The indicator window shows a bullish crossover in MACD lines where the Histogram is above the neutral line. Therefore, the primary trading approach is to find a bullish H1 candle above the weekly VWAP and aim for the 0.7482 high volume level. On the other hand, the failure to break the wedge resistance with a bearish H1 candle below the 0.7383 level could resume the current trend towards the 0.7300 level.
Although the daily price reached a key demand zone, the intraday price action needs a strong bullish breakout to validate the buying pressure. In that case, investors should monitor how the H4 price trades at the Kijun Sen zone, from where a bearish rejection could resume the existing bearish trend.


