
Published: August 24th, 2023
Switzerland's Trade Balance shrunk to 3,129 million, falling short of the market consensus estimate of 4,300 million. As reported by the Swiss Federal Customs Administration on Tuesday, Exports decreased by 16.7% in July, while Imports decreased by 12.5%.
However, mounting concerns about China's deteriorating economy are likely to dampen market participants' and risk-averse investors' enthusiasm. This may increase demand for the traditional safe-haven Swiss Franc.
On the other hand, WTI crude oil, a significant Canadian export, is exhibiting slight losses near $78.40 as it recovers from a one-month low reached Wednesday.
The weekly stockpile data from the US Energy Information Administration (EIA) indicates that there has been a significant reduction in oil inventories despite market concerns about declining energy demand due to recent disappointing PMI figures. These contradictory factors might influence both oil and CAD traders.
In the meantime, Canada's Retail Sales for June showed a revised monthly increase of 0.1%, as opposed to the 0.0% expected by the market. However, Retail Sales, excluding the Automotive sector, declined by a greater percentage, from -0.3% to -0.8%. This decline is contrary to the 0.3% increase predicted by the market.
The positive fundamental data for Canada could be a strong bullish sign for the CADCHF price, but a precise outlook may come from the multi-timeframe analysis.
Let’s see the complete price direction from the CADCHF technical analysis:
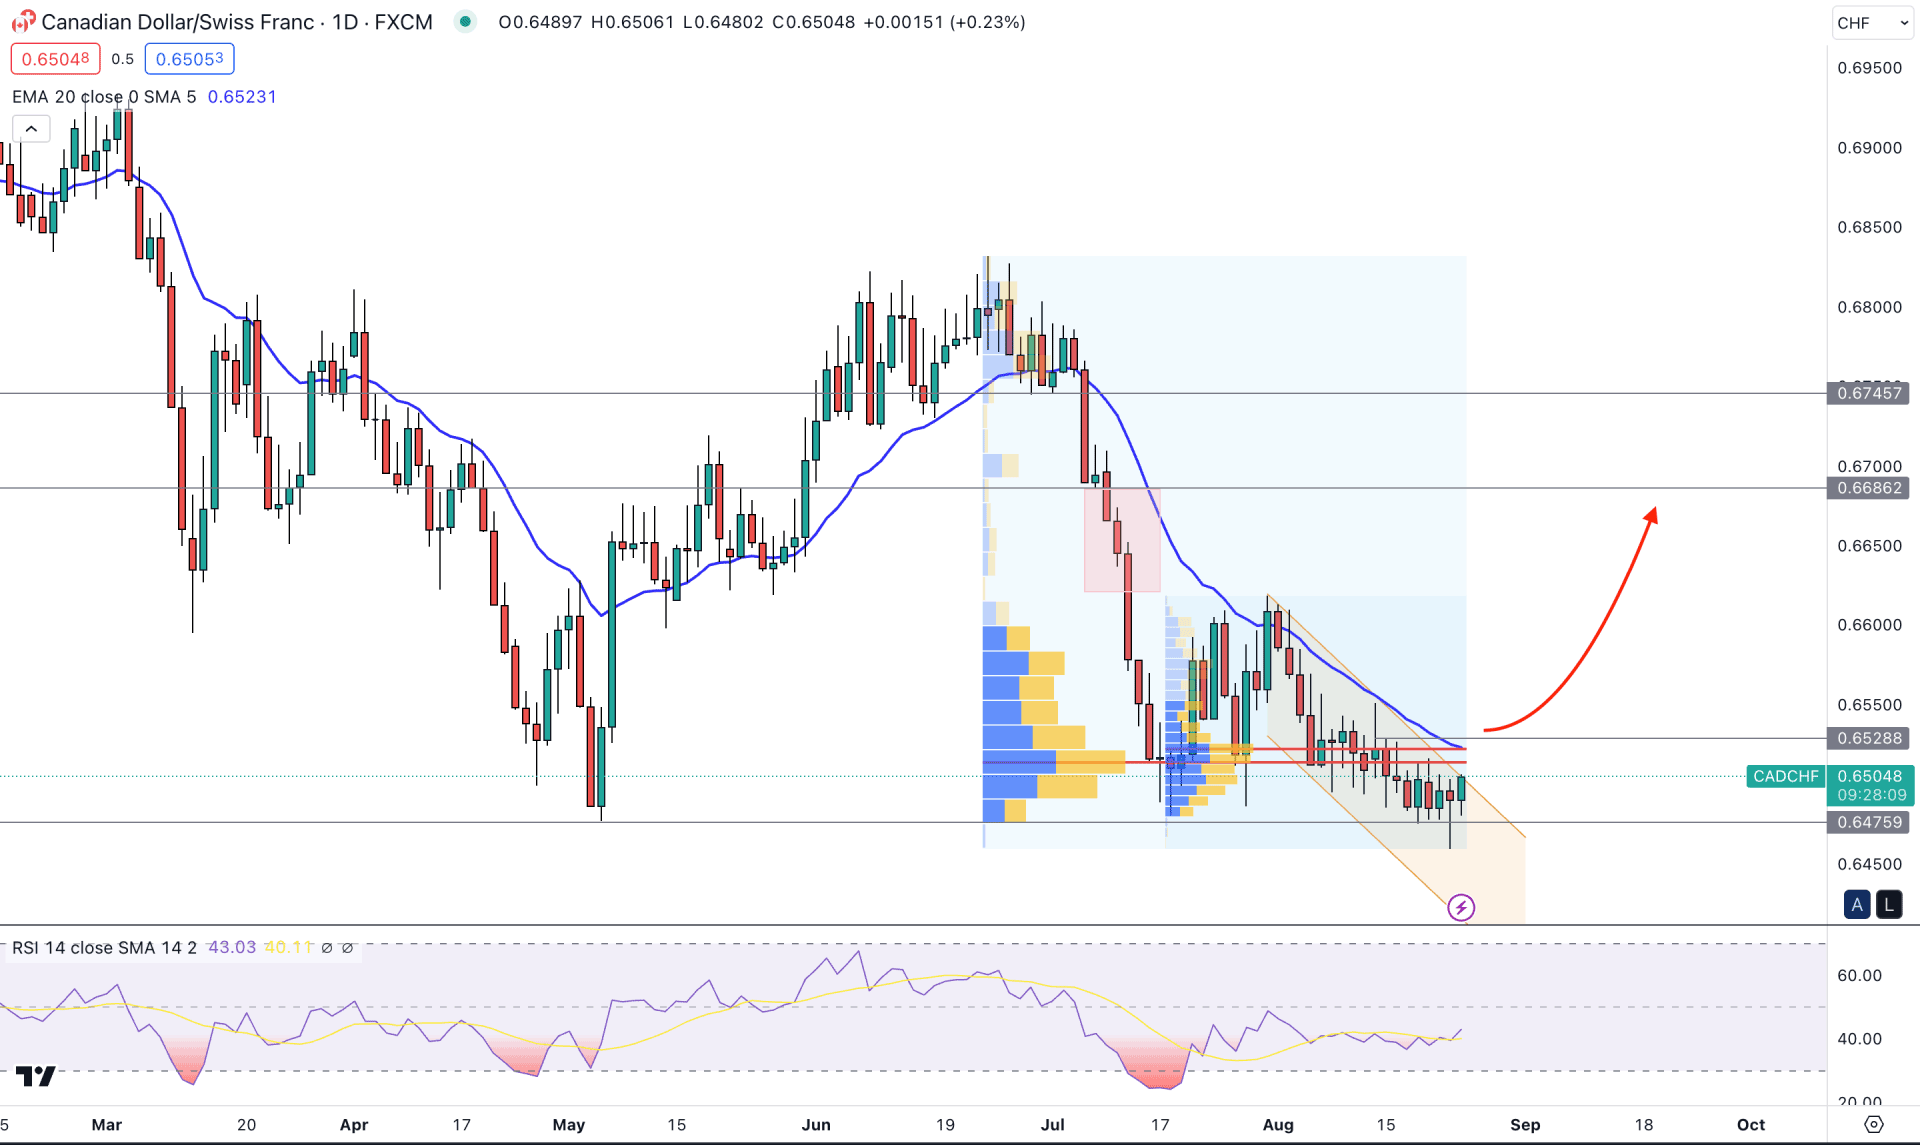
In the CADCHF daily chart, the current price is trading within strong volatility, which came after a long bearish trend. The current consolidation consists of an increased trading volume, which could result in a trend change at any time.
In the financial market, trading changing a trend is very common, where institutions leave some clues before making the shift. Usually, wiping out sellers are common signs of a bullish trend formation, and there is no exception for the CADCHF pair. The price dropped nearly 5.4% from the 19 June 2023 peak and formed a sell-side liquidity sweep at the 0.6475 support level. However, investors should find further bullish evidence before considering it a stop-loss hunt.
In the monthly chart, the current candle is still bearish before the monthly decease period, while the weekly price remained sideways.
As per the fixed range high volume level indicator, the highest trading volume level since 23 June is at 0.6512 level. Another high volume level from the 18 July low is at 0.6521 level, As these significant levels are above the current price, a stable bullish pressure may come after a solid breakout.
The current 20-day Exponential Moving Average is above the current price at the 0.6521 level. Moreover, the near-term resistance level is spotted at the 0.6428 level. The current RSI has shown a rebound from the oversold 30.00 level, which is an early sign of buying pressure.
Based on the daily chart, the conservative bullish approach in this pair is to wait for a D1 close above the 0.6530 level, which may open rooms for filling imbalance at the 0.6686 to 0.6626 area. However, the current price is still below the 20 EMA, and an additional bearish rejection with a candle close below the 0.6470 level might resume the bearish trend towards the 0.6400 level.
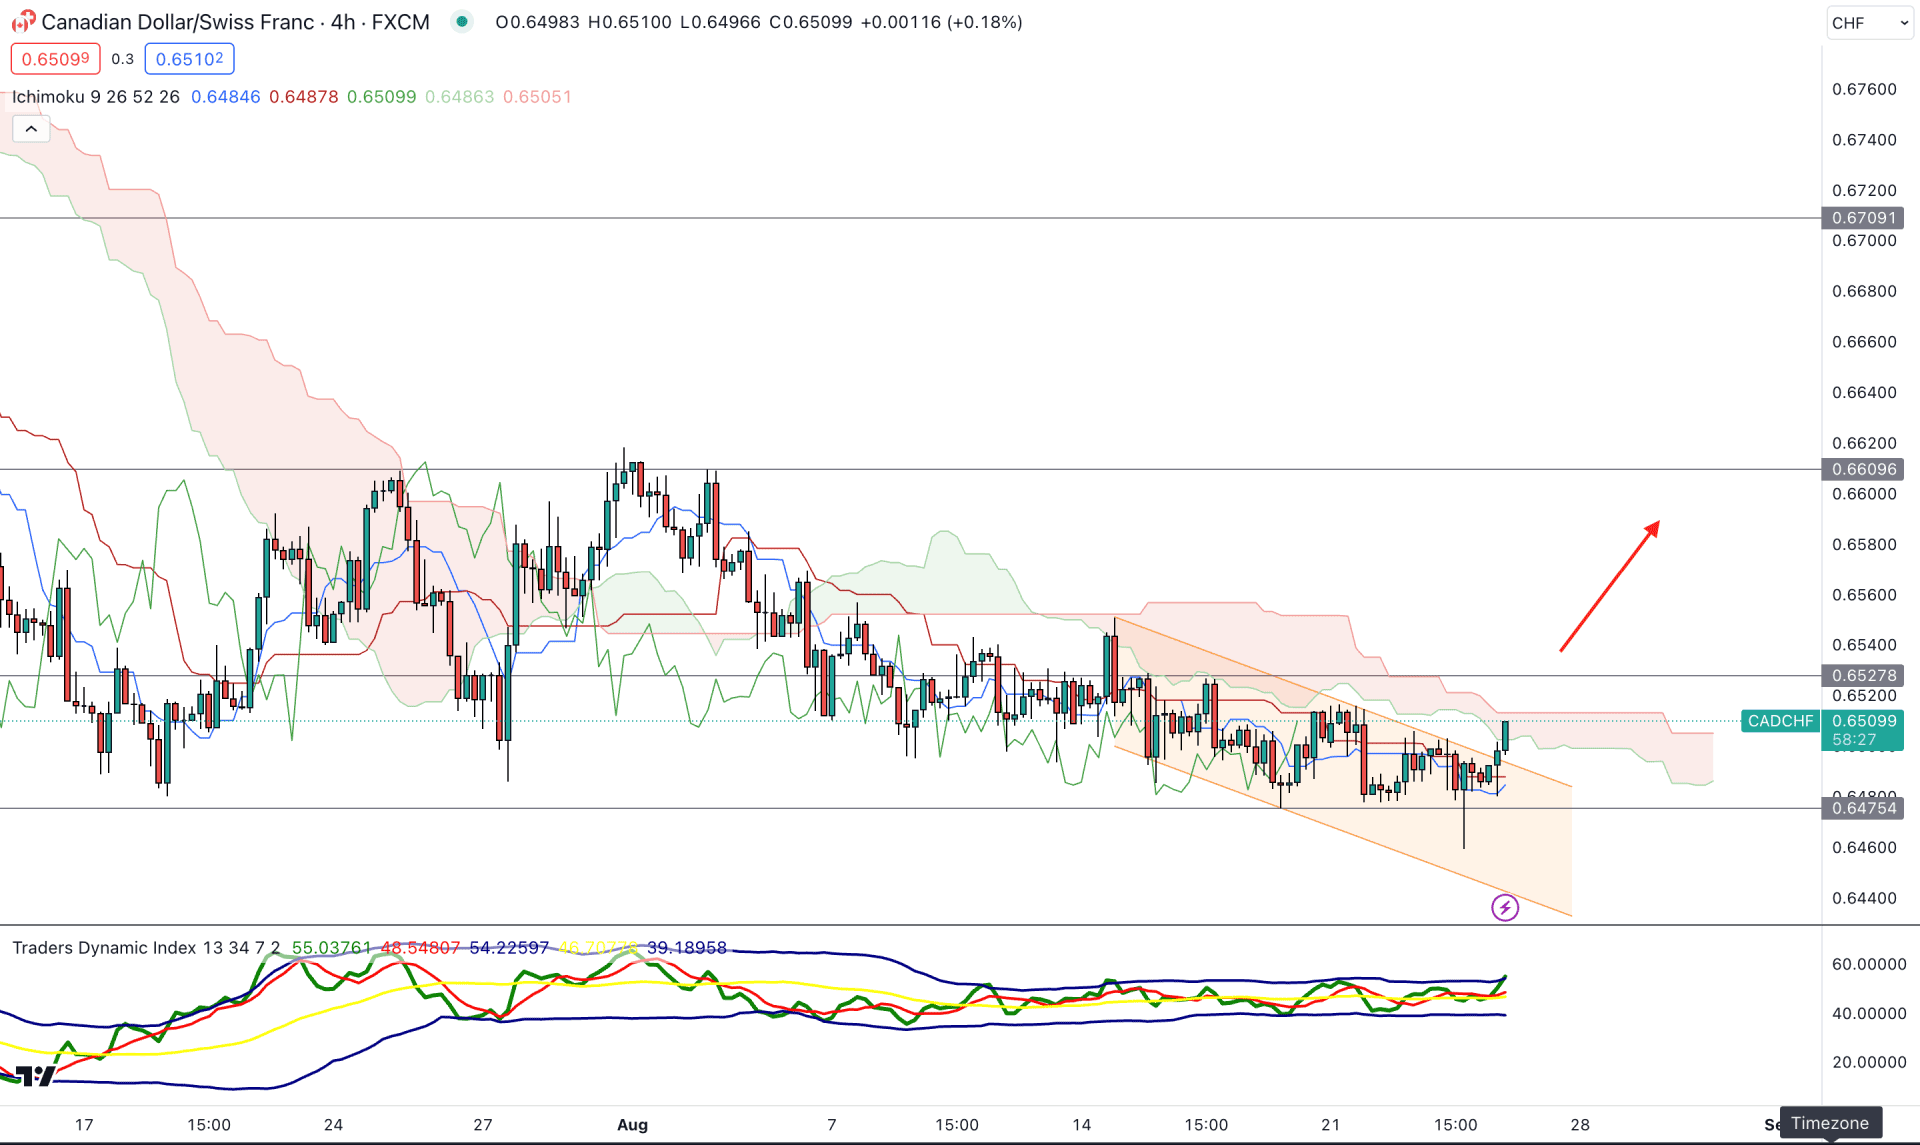
In the H4 timeframe, strong volatile price action is present below the Ichimoku Cloud zone. Although the price made a new low below the 0.6475 level, it formed an immediate bullish reversal with a counter-impulsive momentum. However, the future cloud is still bearish, while the Senkou Span B is flat.
In the trader's dynamic index, the current reading shows an overbought condition, where the TDI remains at the upper band area.
Based on this structure, a bullish breakout with an H4 candle above the 0.6527 level would be a long opportunity, targeting the 0.6600 level.
The alternative approach is to find a bearish rejection and a candle close below the dynamic Kijun Sen level before approaching the 0.6440 support level.
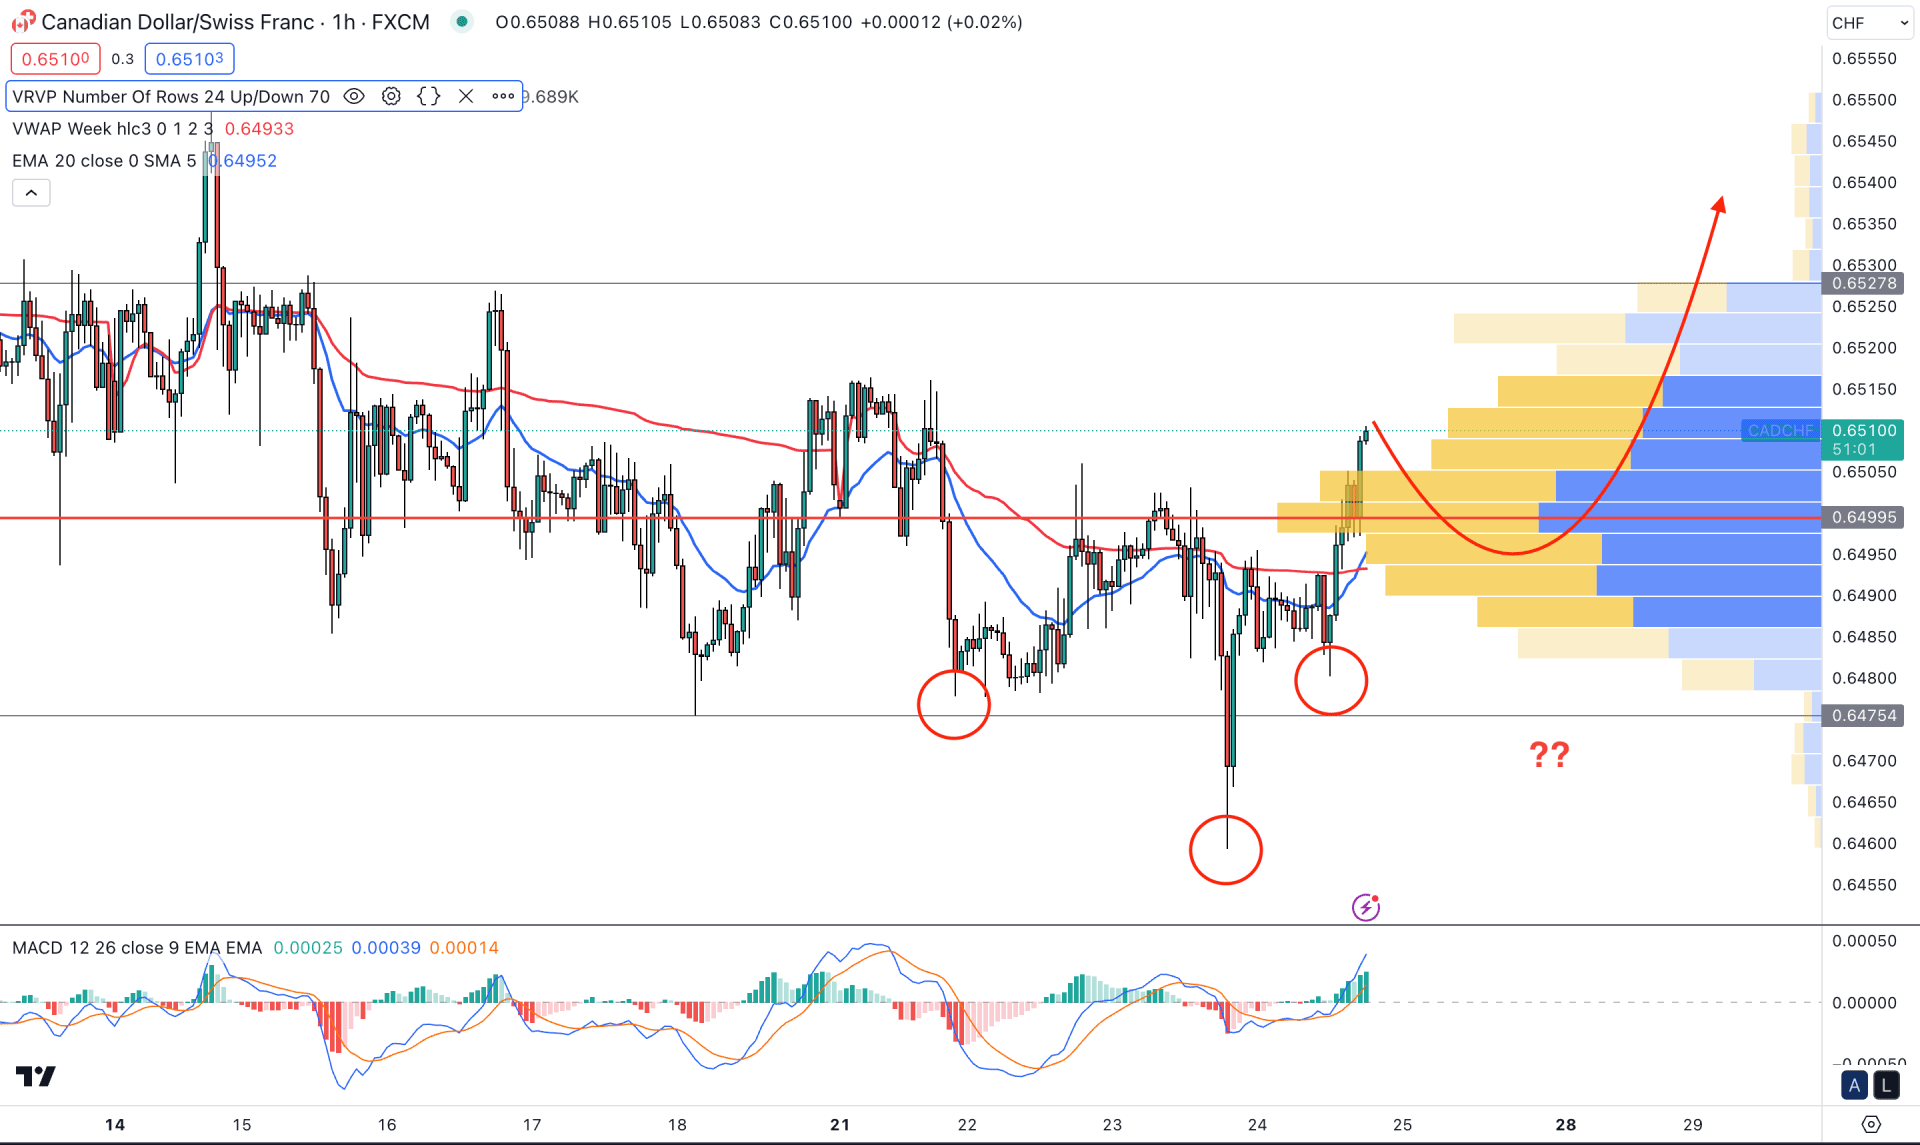
In the H1 timeframe, a bullish possibility is potent from the inverse Head and Shoulders formation, where the current price is trading above the neckline. Also, the bullish breakout from the neckline came with a high volume level formation.
In the secondary window, the current MACD Histogram is at an overbought zone with MACD lines, which indicates a pending bearish correction.
Based on the H1 timeframe, a bearish intraday pressure is pending in this pair. An additional bullish rejection from the 0.6500 to 0.6480 area could be a valid buying point, targeting the 0.6600 level.
The alternative approach is to find a bearish H4 candle below the 0.6475 level, which may lower the price towards the 0.6455 area.
As per the current findings, CADCHF has shown the early sign of a trend reversal, but confirmation is needed with a bullish range breakout. Investors might find an early opportunity to join the bullish trend after getting a valid rejection from the intraday chart.


