
Published: September 2nd, 2020
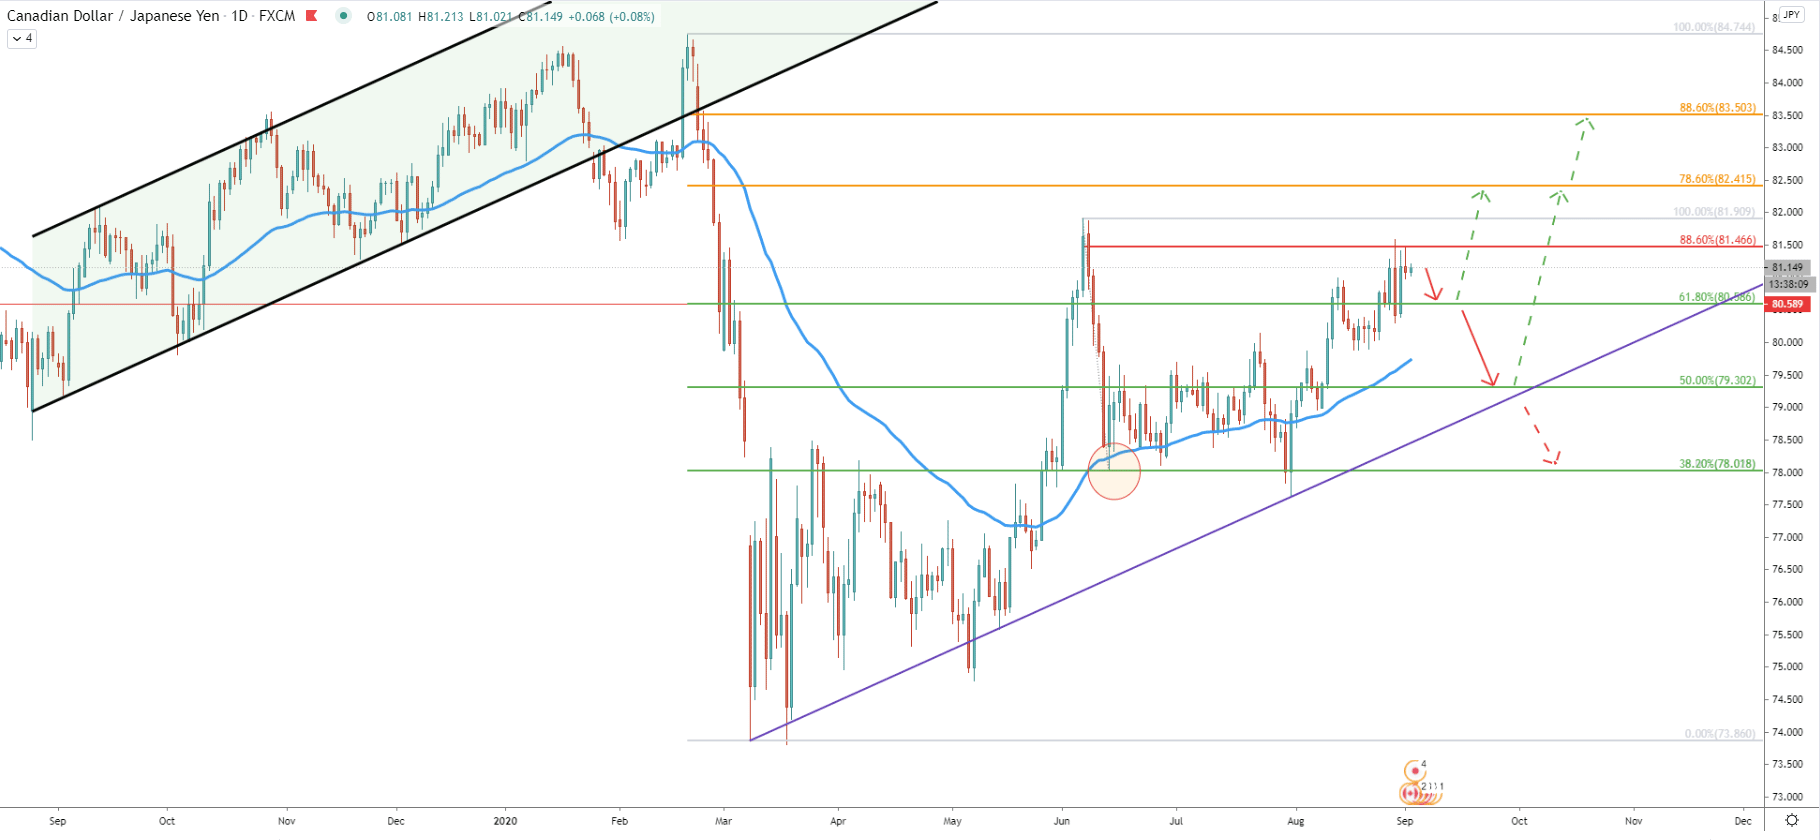
After the breakout below the ascending channel, massive downtrend has started, resulting in the price drop from 84.74 down to 73.86, which is over 1000 pips move. Although since the March CAD/JPY has been on a steady rise and the price has managed to recover strongly.
It seems that the recovery might continue although it becomes riskier and riskier for the buyers to hold long positions. This is because the 88.6% Fibonacci retracement has been rejected cleanly, which might suggest a correctional move to the downside.
The correction could be either small or huge depending on the price action in the coming days or weeks. The nearest support is located at 80.58, which is confirmed by 61.8% Fibonacci retracement level. It might be the most important level to watch because it should give further clues on the long term price development.
Rejection of this support, if/when reached, will likely confirm the continuation of the recovery phase, and CAD/JPY could start rising towards the 78.6% Fibs at 82.41 or 88.6% Fibs at 83.50. On the other hand, break below the 80.58 support should be confirming a strong selling pressure and price can be expected to drop down to 50% Fibs at 79.30 or 38.2% Fibs at 78.00 psychological support.
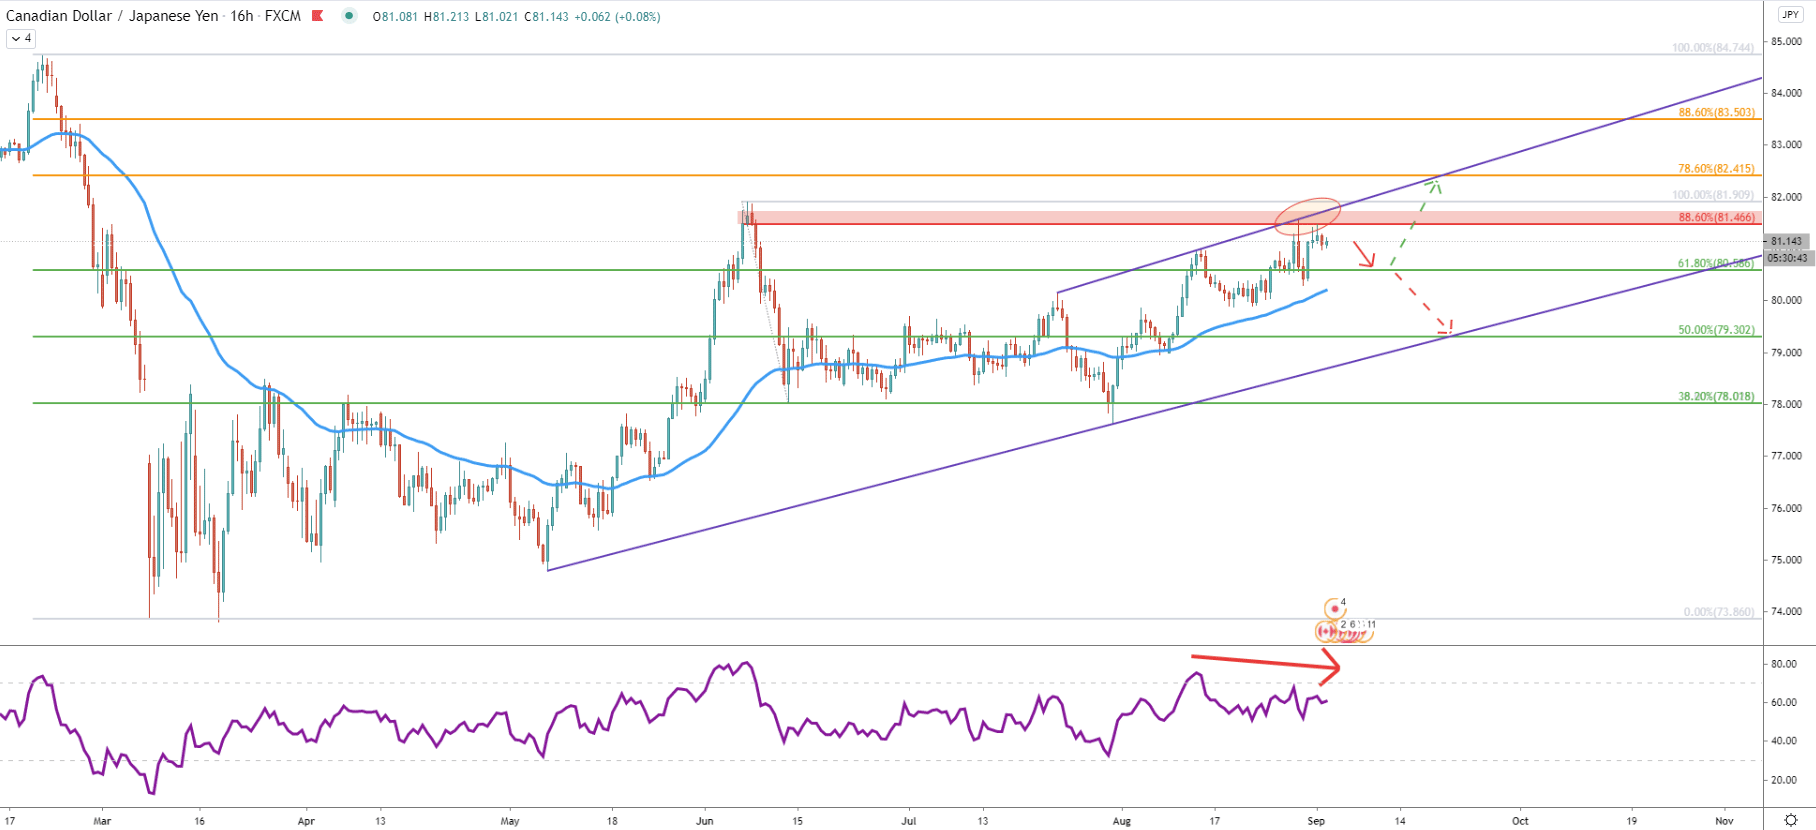
On August 28 CAD/JPY has cleanly rejected the resistance uptrend trendline along with the previously formed resistance near 81.50. At the same time, the RSI oscillator formed a bearish divergence suggesting a correctional move to the downside. Today, there was a very clean bounce off the 88.6% Fibs, suggesting the beginning of the price decline. Obviously this scenario can only be valid as long as daily close remains below recently printed high. In regards to the downside target, if 80.58 is broken, the price can easlity test 50% Fibs at 79.30, which cleanly corresponds to the uptrend trendline.
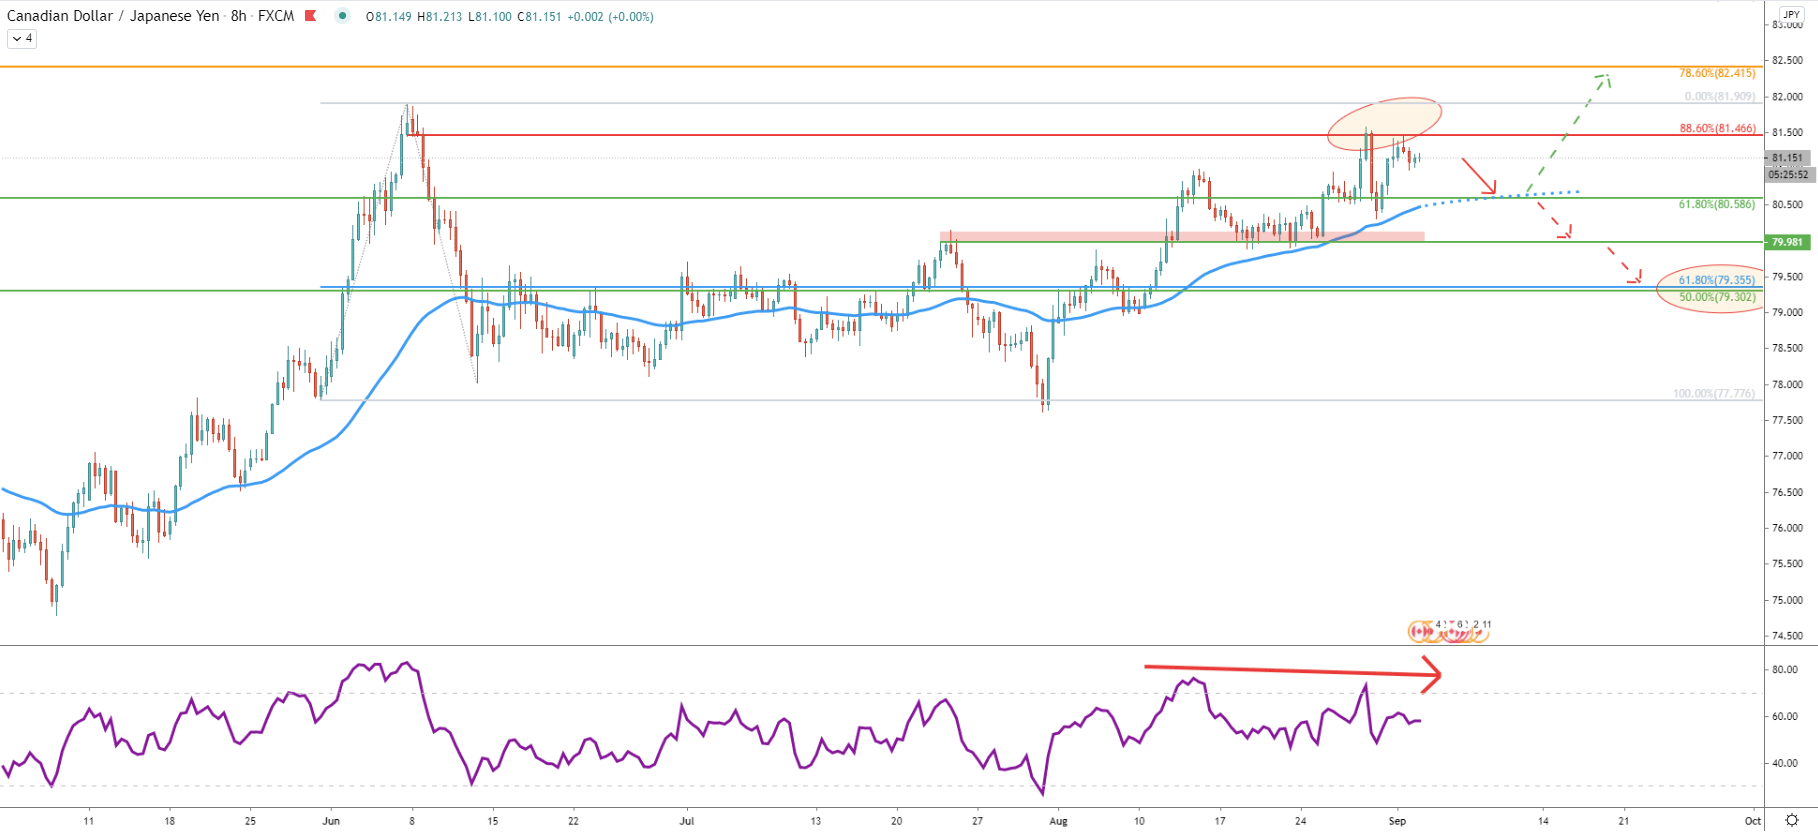
On this chart, the nearest downside target at 80.58 corresponds to the 50 Exponential Moving average, which hasn’t been tested recently. But the price might spike lower to test the previously formed supply/demand area at 80.00 key psychological level. Upon the break and close below 80.00, the next downside target becomes at 79.35, confirmed by two Fibonacci retracement levels. First is the 81.8% Fibs applied to the last wave up where 81.90 high was produced. And second is the 50% Fibs as per the daily chart. Considering the formation of the bearish divergence on the 16-hour and 8-hour chart, the downside move remains highly probable.
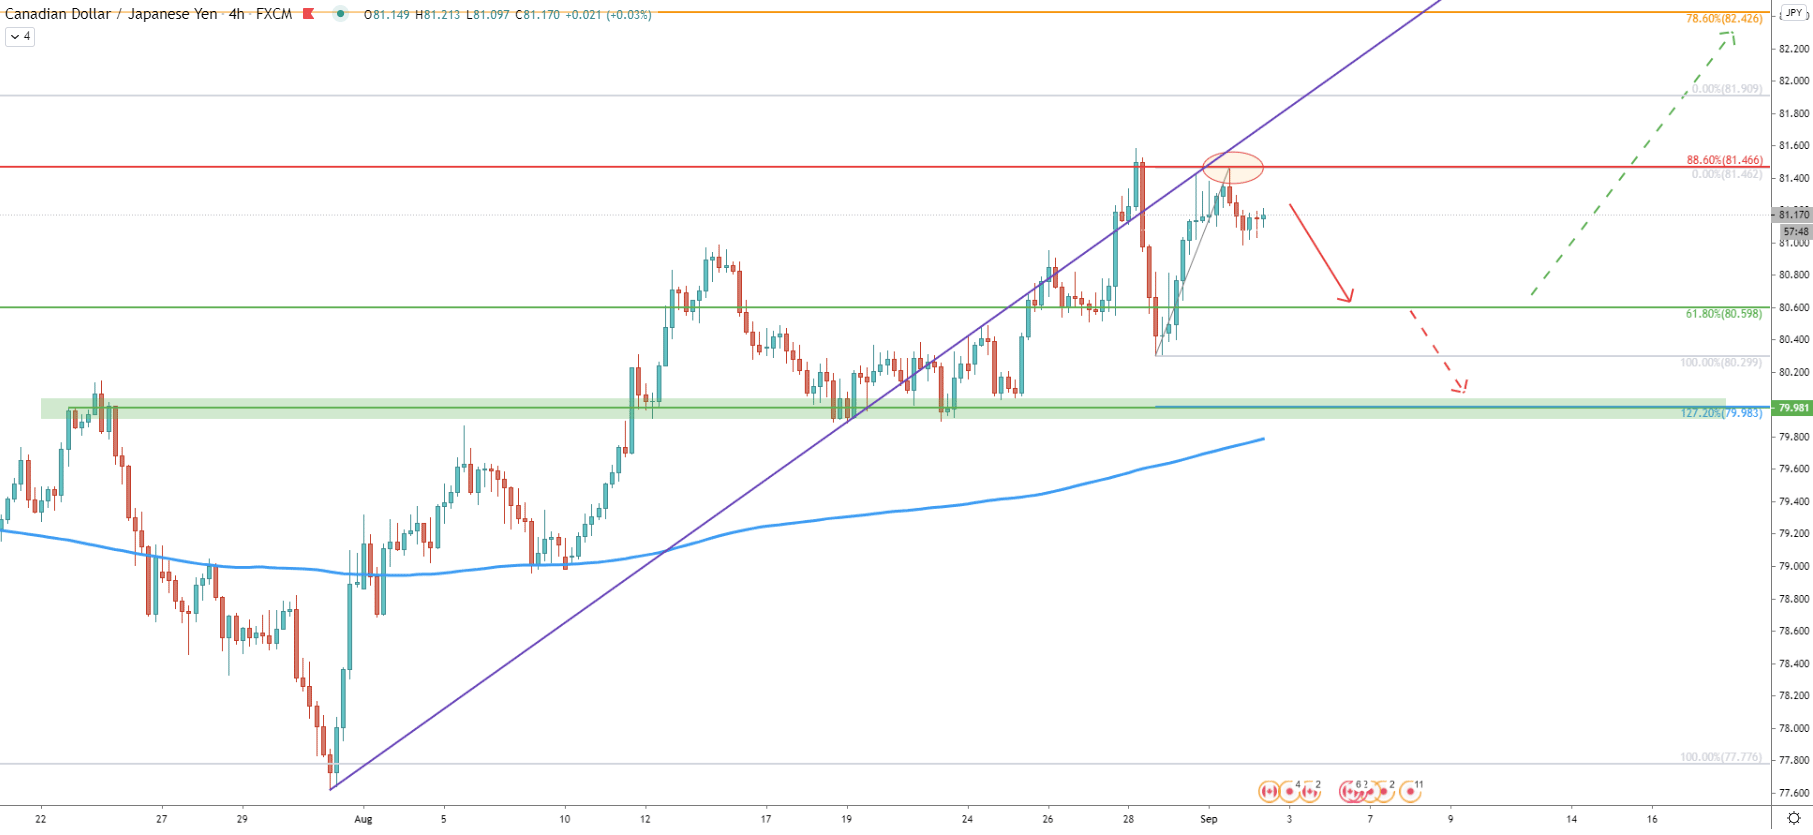
On the 4-hour chart, the rejection of the 88.6% Fibs at 81.46 becomes very obvious. Simultaneously, we can witness the rejection of the uptrend trendline, which is currently acting as the resistance. The second downside target at 80.00 psychological support corresponds to the 127.2% Fibs applied to the current pullback and also corresponds to the extended 200 Exponential Moving Average making it the second most important support level.

On the hourly chart, we’ll pay more attention to the nearest support area between 80.58 and 80.48. On the 3rd chart, a bearish divergence was formed, and after bouncing off the 88.6% Fibs, the price has rejected 127.2% Fibs at 81.29. Lower lows and lower highs stared to appear, yet again confirming the potential price decline.
It is possible that CAD/JPY will re-test the 81.30 resistance area, before/if the downtrend begins. This resistance could provide a perfect selling opportunity in regards to the risk/reward ratio. The downside target corresponds to the lower trendline of the descending channel and could be reached within just several trading days.
Obviously the major trend remains bullish, and every support level mentioned in these analyses can play an important role in further price development. If CAD/JPY will continue breaking all the support levels, eventually the uptrend is likely to turn into the downtrend.
CAD/JPY reached and rejected multiple resistance indicators and formed a bearish divergence on three different timeframes. This could mean that the correctional move down is on its’ way and might send price as low as 78.00.
The nearest downside target is at 80.58, which should be watched extremely closely if reached. Because the break below will only increase the selling pressure and can send the price down to 80.00, 79.30, or even towards the 78.00 support.
The probability of an uptrend continuation is slightly lower in relation to the probability of the downside correction. However, a daily break and close above 81.46 resistance, will invalidate the bearish scenario, and only then uptrend can be expected to continue.
Support: 80.58, 80.00, 79.30, 78.00
Resistance: 81.46, 81.90, 82.41, 83.50


