
Published: February 11th, 2020
Today our attention was caught by the CAD/JPY currency pair as it might offer a good risk/reward trading opportunity in the very near future. We will look at the multi-timeframe analysis, specifically, Daily, 4 Hour and 1 Hour chart in order to find the best trade setup.
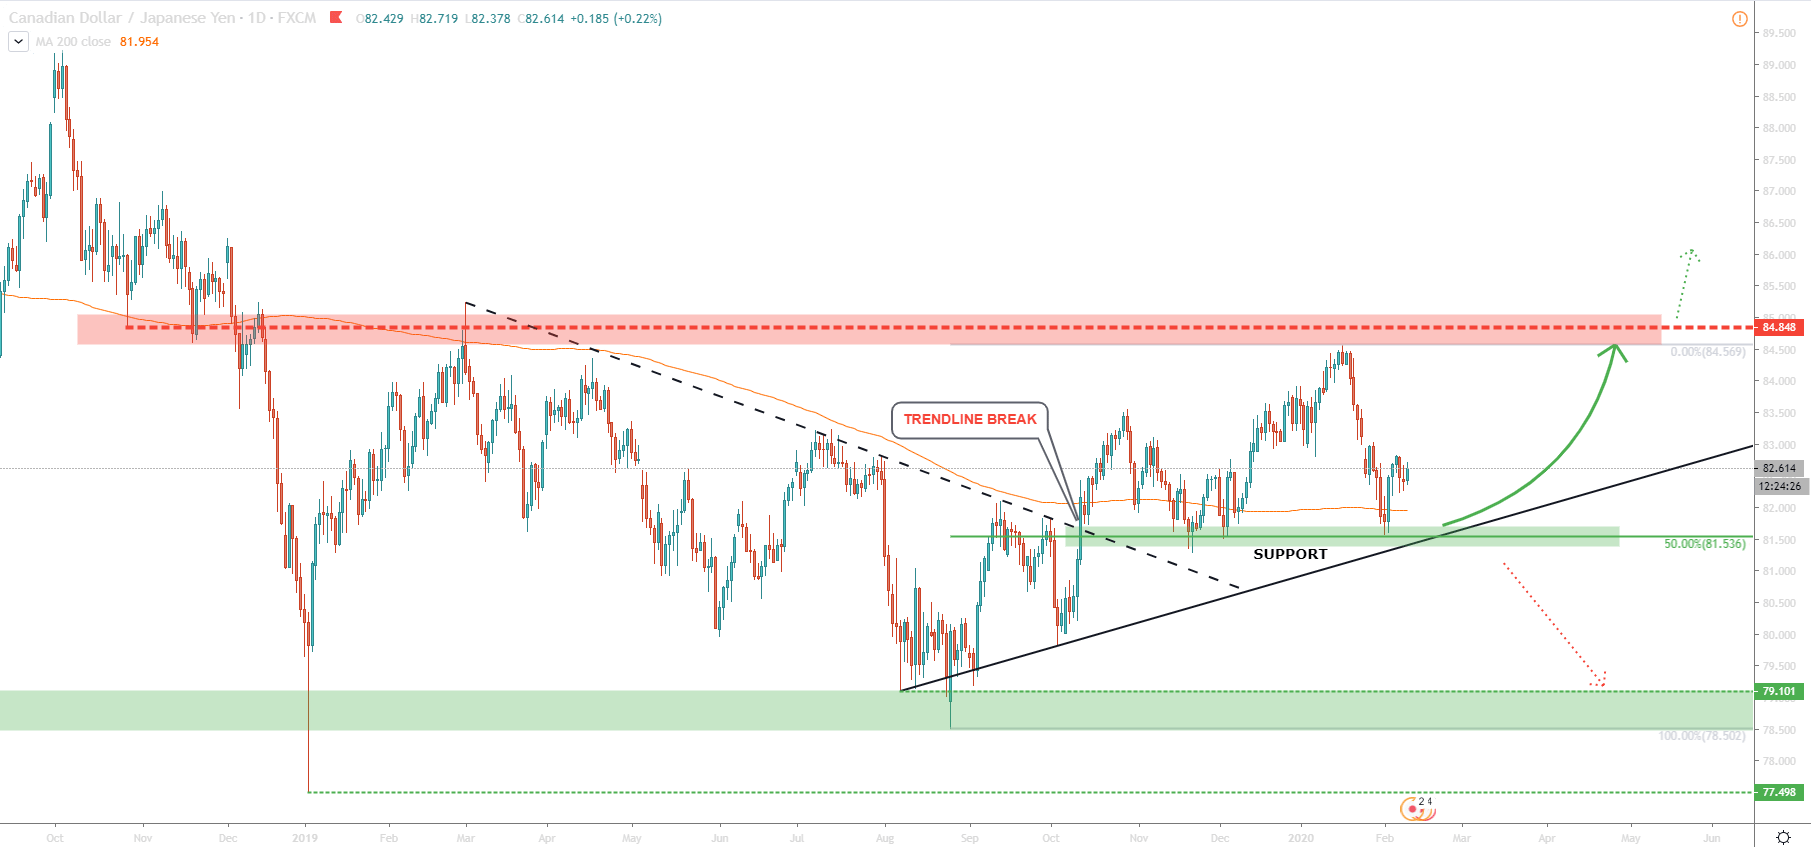
Let’s start with a Daily chart. At first glance, there is a clear range-trading, where price has stuck between 79.00 support and 85.00 resistance for over a year now. But, the downtrend trendline was penetrated and the double bottom was formed on the trendline breakout level. This is also the price where a 50% Fibonacci retracement level is based, making it an important support area. It is also important to mention that CAD/JPY remains above the 200-day moving average, which is a positive sign.
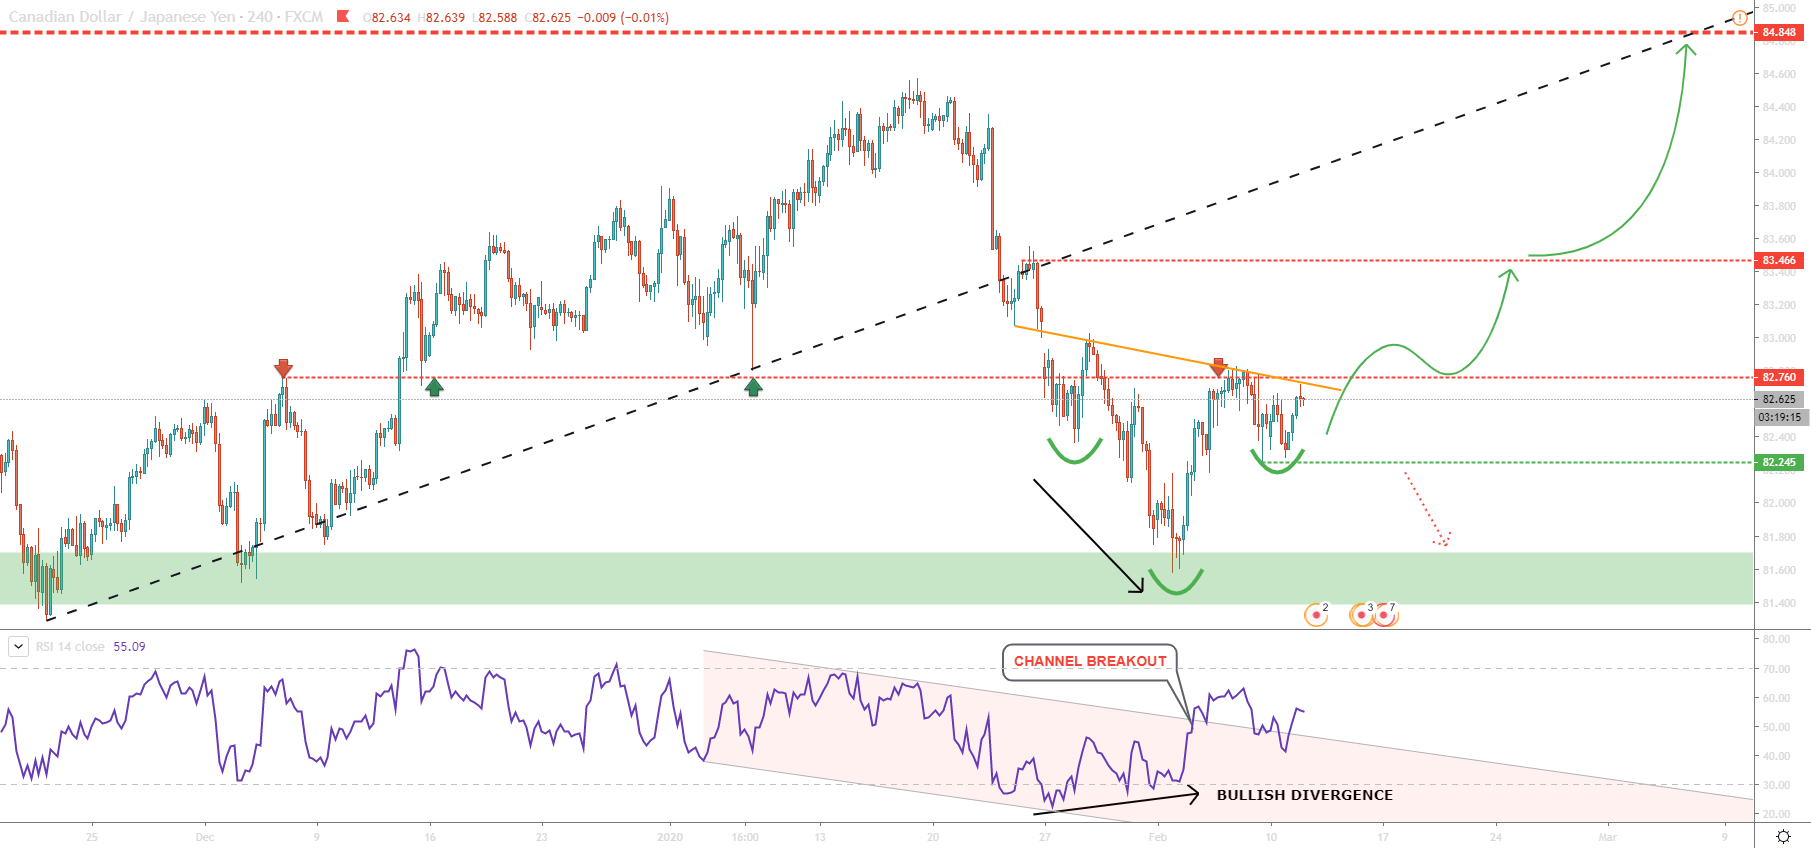
Time to look at the 4-hour chart where an interesting pattern is forming. This could be an inverted head and shoulders pattern although at this point it is not confirmed. The confirmation would be a break and close above the neckline (the orange line on the chart).
Chances of the break above the neckline remain high because the RSI oscillator has formed a bullish divergence followed by a break above the descending channel. This could be a signature of the change in trend at least in the short term. But at the same time, 82.76 resistance should be taken into consideration before trading the H&S pattern. Both, the resistance and the necklike must be broken in order to confirm the bullish intentions of CAD/JPY.
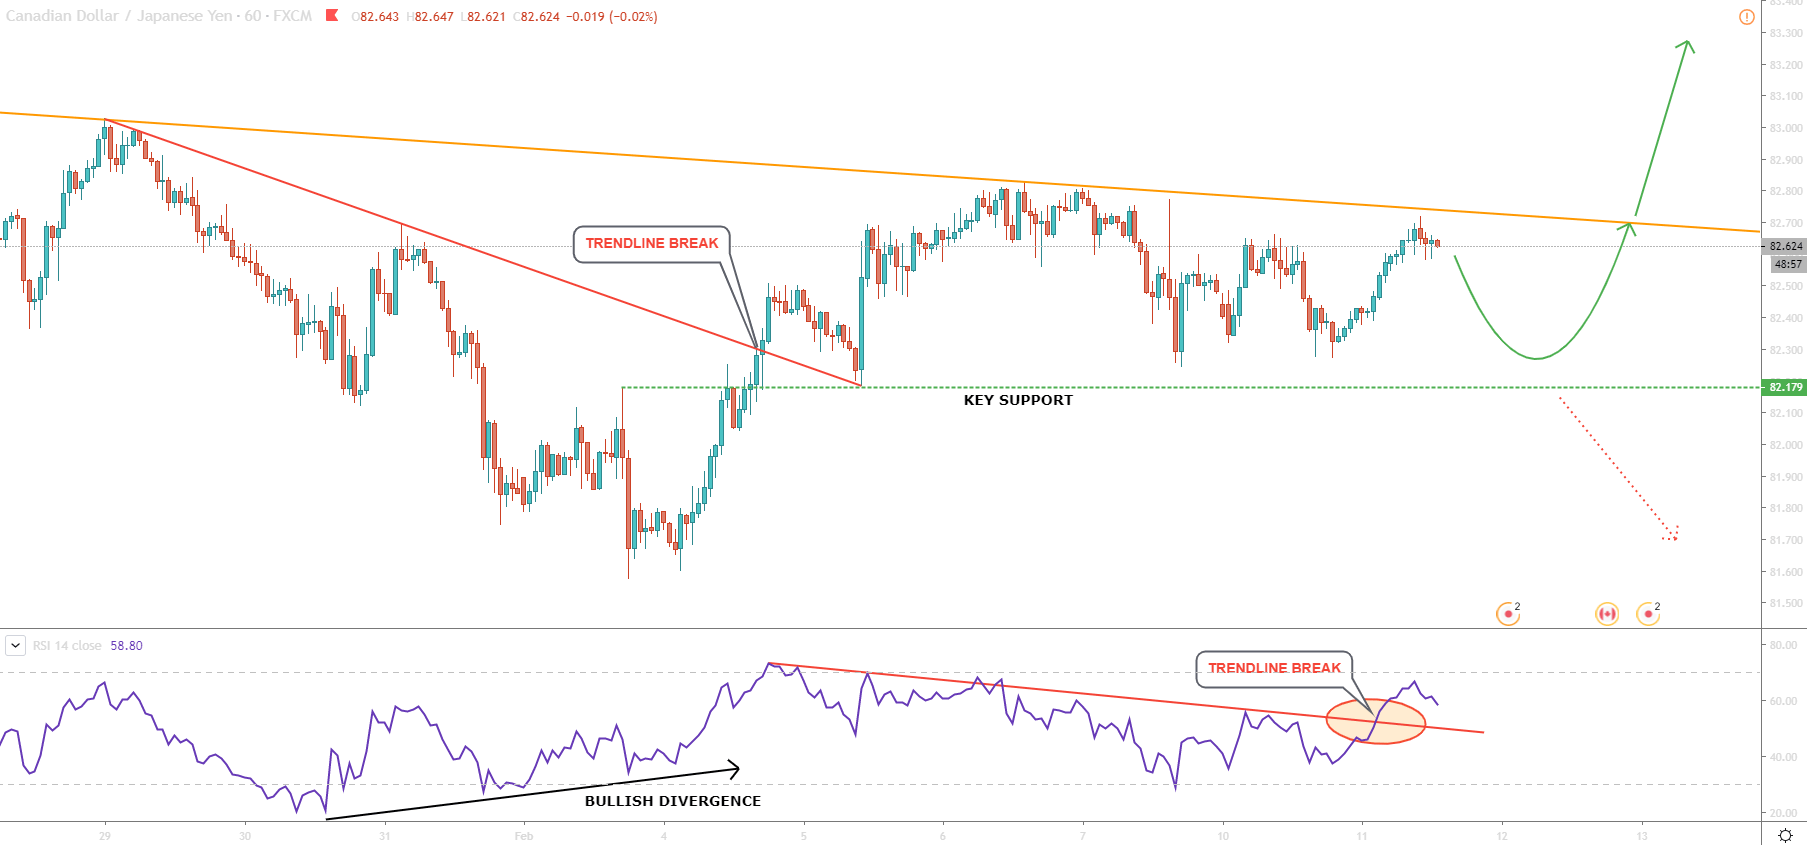
Finally, we will look at the 1-hour chart to get the most probable scenario for this and the coming week. Simultaneously we will try to show the best risk/reward trading opportunity.
At the bottom, formed on February 13th, the price has reached 40-day low and tested 81.57 level. This is where RSI yet again formed a bullish divergence, resulting in a strong corrective wave up. Although this could have been not just a correction, but in fact trend reversal.
While moving up, price broke above the downtrend channel and now we can see a “higher highs, higher lows” pattern. This is an indication of an uptrend, only if the 82.17 support will not be broken. Therefore, if choosing a buy trade entry, this could one of the levels to consider for placing a stop loss.
Yes, the pattern is getting more bullish, although still, price is going through a consolidation phase. Price continues to trade below the downtrend trendline and above the support. It makes a buy trade unattractive and right now it is better to either wait for a correctional move down towards the support or a break above the downtrend trendline.
Buying CAD/JPY will become more and more attractive as time goes by, as at some point consolidation will come to an end, and the next impulsive move should take place.
Break and close below 81.50 would invalidate bullish outlook and could result in an extended long-term consolidation. This scenario is likely to make this pair much less attractive for trading due to low probability trade setups.
Long term, price is clearly consolidating, but in the mid and short term, there is an emerging uptrend. Currently, there is no good entry price to go long on CAD/JPY. However, a correctional move down towards the support could present a good buying opportunity this week. Another opportunity could be on correction down after the neckline breakout.
Support: 82.24, 82.18, 81.53, 79.10
Resistance: 82.76, 83.46, 84.84


